

Identification of the Shared Gene Signatures between Autism Spectrum Disorder and Epilepsy via Bioinformatic Analysis
- PMID: 36601364
- PMCID: PMC9806688
- DOI: 10.1155/2022/9883537
Identification of the Shared Gene Signatures between Autism Spectrum Disorder and Epilepsy via Bioinformatic Analysis
Abstract
Purpose: To identify gene signatures that are shared by autism spectrum disorder (ASD) and epilepsy (EP) and explore the potential molecular mechanism of the two diseases using WGCNA analysis. Additionally, to verify the effects of the shared molecular mechanism on ADHD, which is another neurological comorbidity.
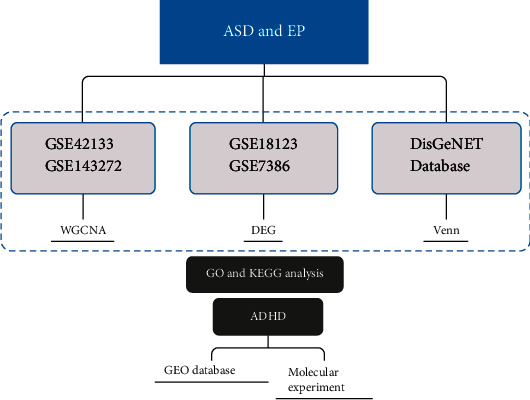
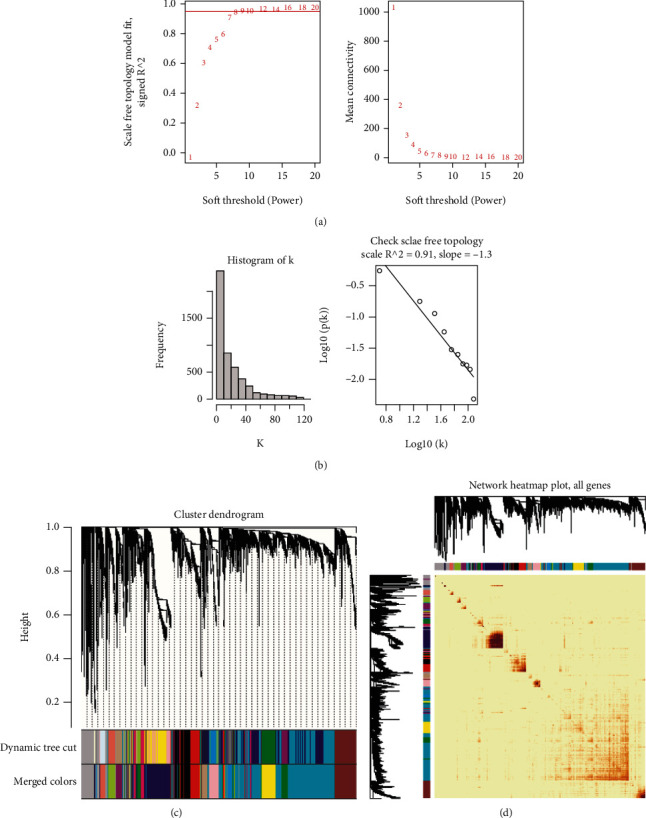
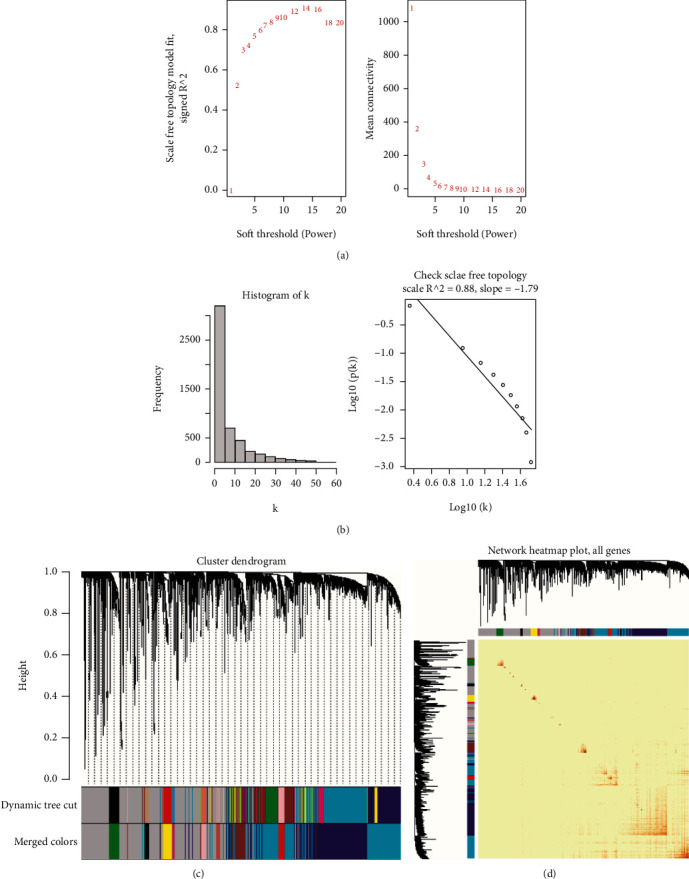
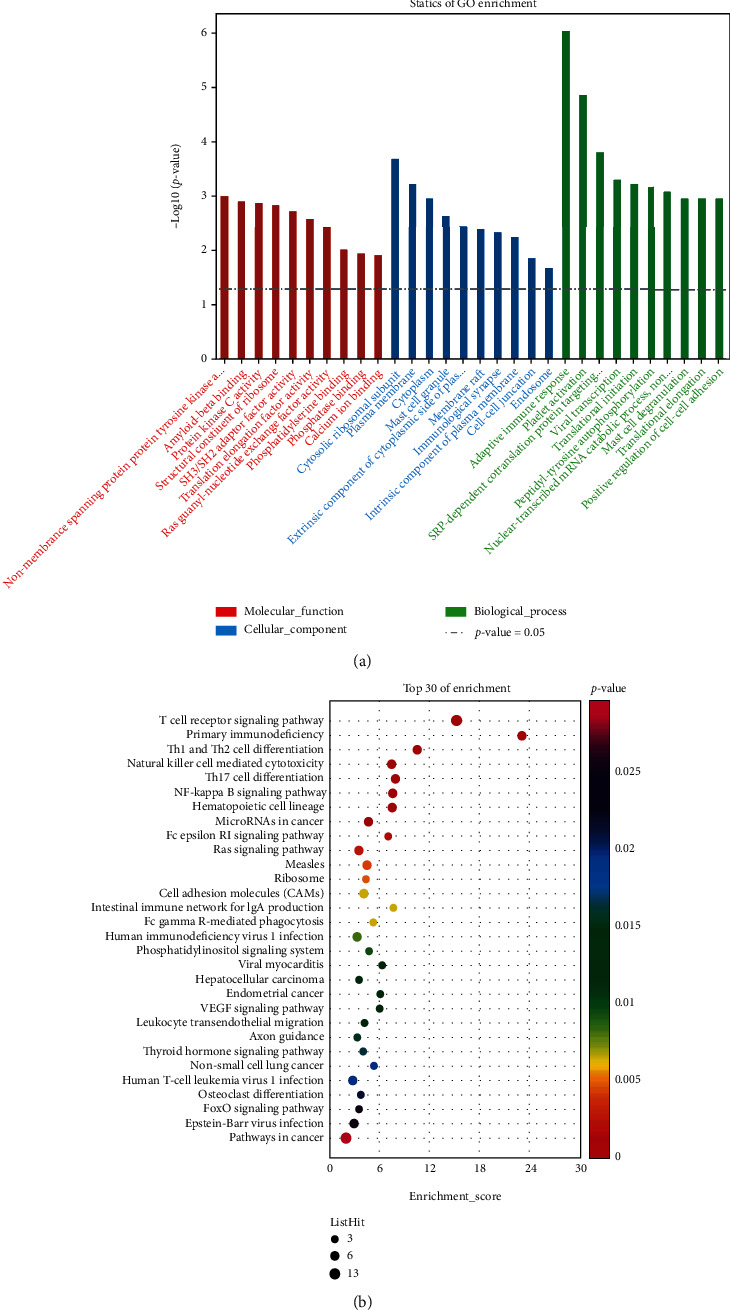
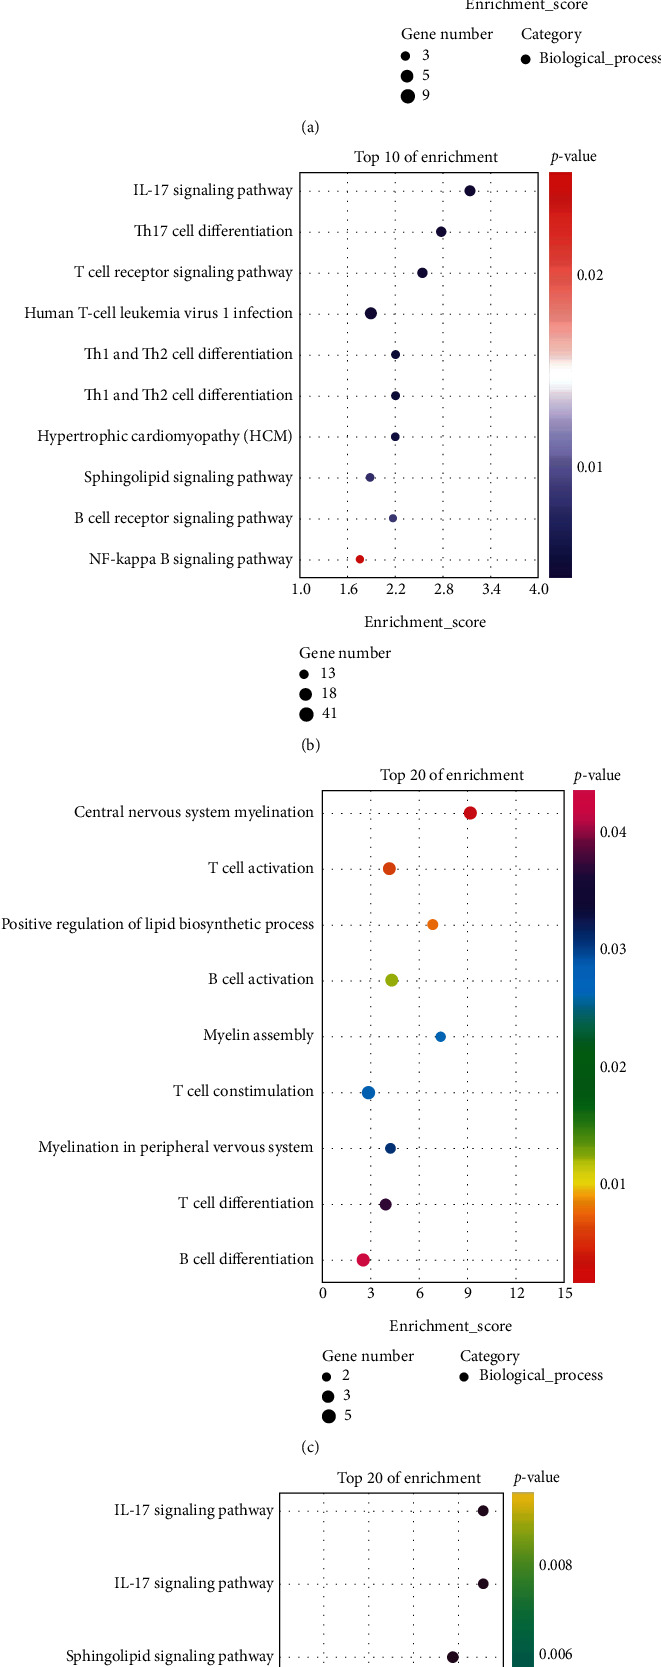
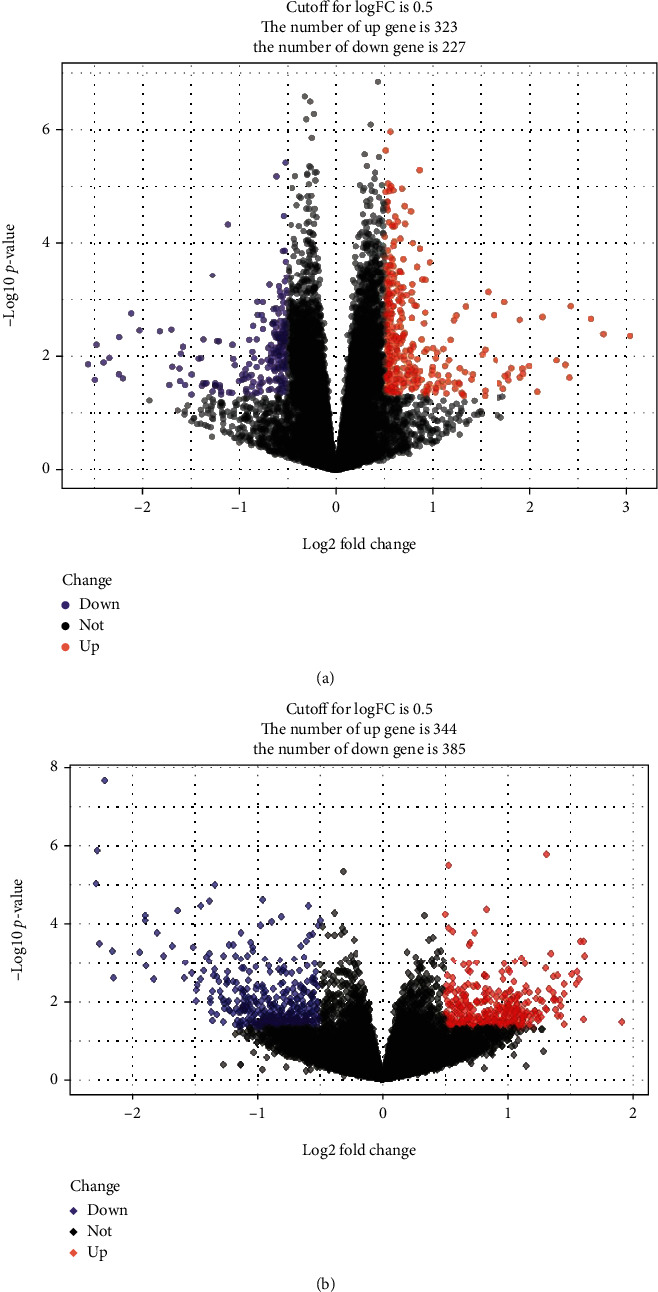
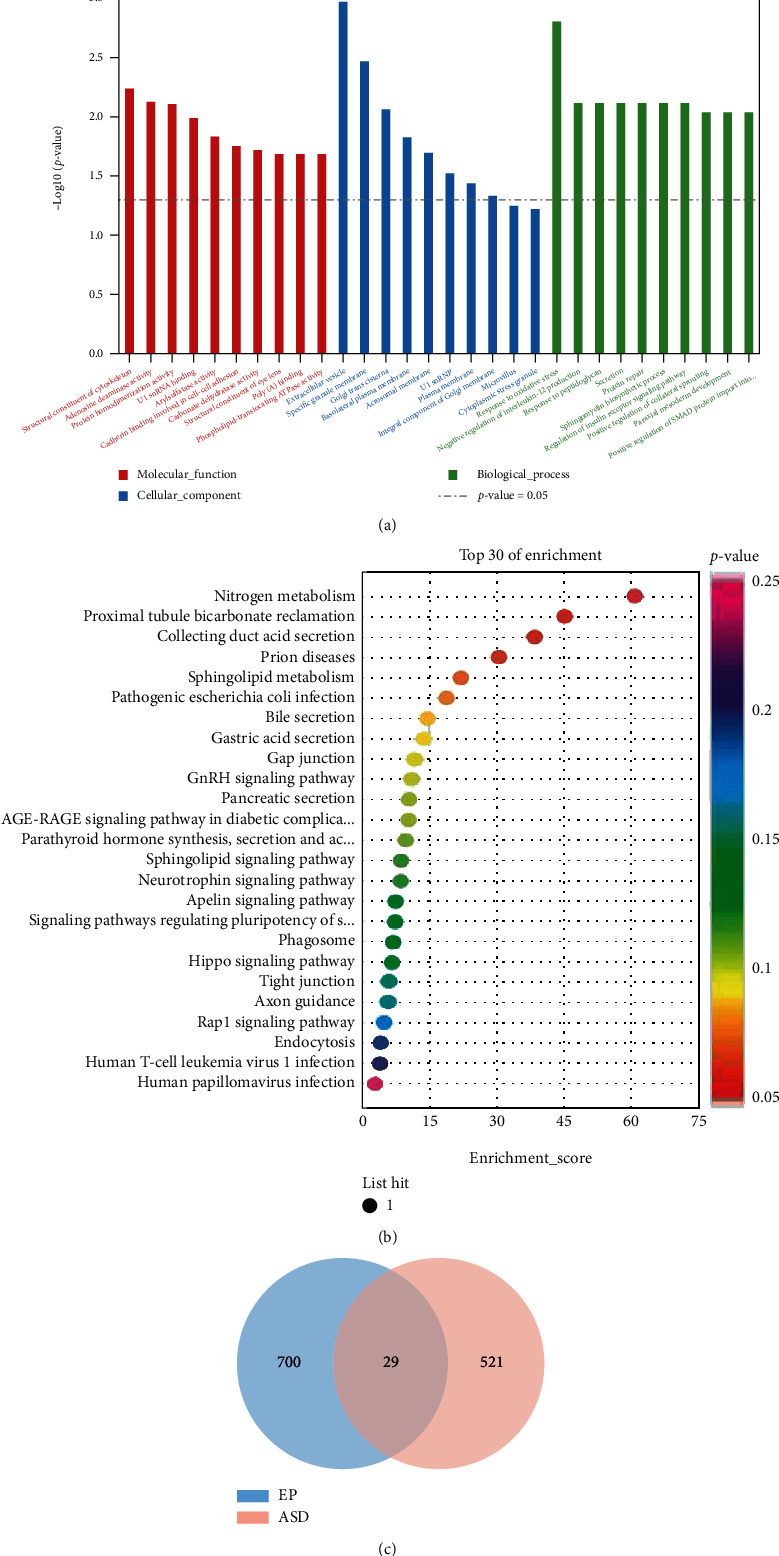
Methods: We screened the crosstalk genes between ASD and EP based on WGCNA and differential expression analysis from GEO and DisGeNET database and analyzed the function of the genes' enrichment by GO and KEGG analyses. Then, with combination of multiple datasets and multiple bioinformatic analysis methods, the shared gene signatures were identified. Moreover, we explored whether the shared gene signature had influence on the other neurological disorder like ADHD by analyzing the difference of the relative genes' expression based on bioinformatic analysis and molecular experiment.
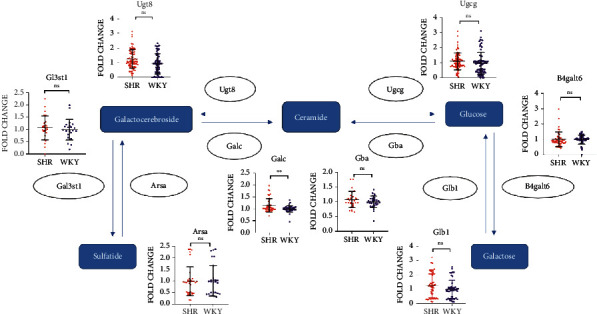
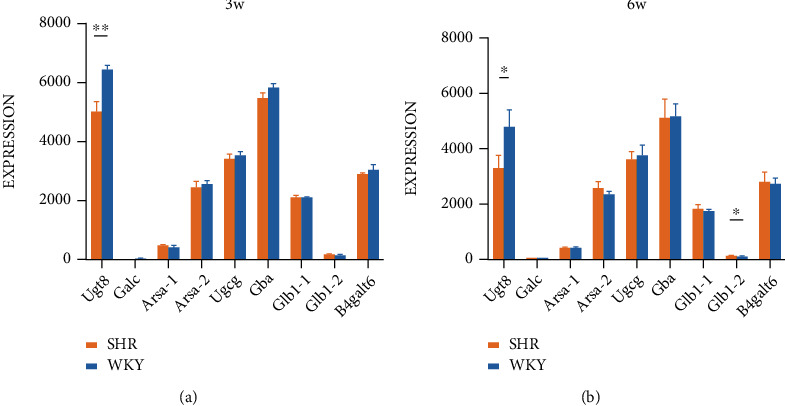
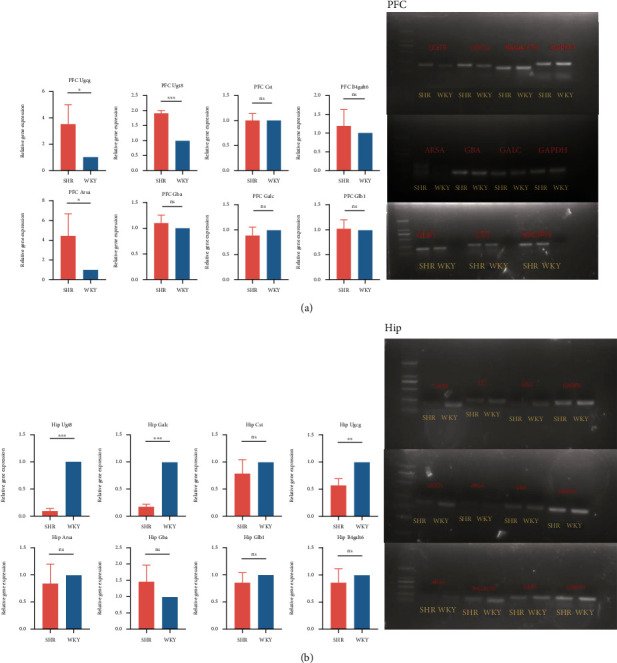
Results: By comprehensive bioinformatic analysis for multiple datasets, we found that abnormal immune response and abnormal lipid metabolic pathway played important roles in coincidence of ASD and EP. Base on the results of WGCNA, we got the hub genes in ASD and EP. In attention deficit and hyperactivity disorder (ADHD) animal model, we also found a significant difference of gene expression related to sulfatide metabolism, indicating that the abnormal sphingolipid metabolism was common in multiple neurological disorders.
Conclusion: This study reveals shared gene signatures between ASD and EP and identifies abnormal sphingolipid metabolism as an important participant in the development of ASD, EP, and ADHD.
Copyright © 2022 Yuexia Xu et al.
Conflict of interest statement
The authors declared no potential conflicts of interest with respect to the research, authorship, and/or publication of this article.
Figures


Similar articles
-
Shared genetics between autism spectrum disorder and attention-deficit/hyperactivity disorder and their association with extraversion.Psychiatry Res. 2022 Aug;314:114679. doi: 10.1016/j.psychres.2022.114679. Epub 2022 Jun 13. Psychiatry Res. 2022. PMID: 35717853
-
Exploring the molecular mechanism of comorbidity of autism spectrum disorder and inflammatory bowel disease by combining multiple data sets.J Transl Med. 2023 Jun 8;21(1):372. doi: 10.1186/s12967-023-04218-z. J Transl Med. 2023. PMID: 37291580 Free PMC article.
-
Dlg4 and Vamp2 are involved in comorbid epilepsy and attention-deficit hyperactivity disorder: A microarray data study.Epilepsy Behav. 2020 Sep;110:107192. doi: 10.1016/j.yebeh.2020.107192. Epub 2020 Jun 21. Epilepsy Behav. 2020. PMID: 32580088
-
A systematic review of comorbidity between cerebral palsy, autism spectrum disorders and Attention Deficit Hyperactivity Disorder.Eur J Paediatr Neurol. 2019 Jan;23(1):31-42. doi: 10.1016/j.ejpn.2018.10.005. Epub 2018 Nov 2. Eur J Paediatr Neurol. 2019. PMID: 30446273
-
Autism Spectrum Disorders and ADHD: Overlapping Phenomenology, Diagnostic Issues, and Treatment Considerations.Curr Psychiatry Rep. 2019 Mar 22;21(5):34. doi: 10.1007/s11920-019-1020-5. Curr Psychiatry Rep. 2019. PMID: 30903299 Review.
Cited by
-
Exploring the shared genetic basis between autism spectrum disorder and gastrointestinal disorders: a bioinformatic study.Sci Rep. 2025 Aug 17;15(1):30086. doi: 10.1038/s41598-025-15476-w. Sci Rep. 2025. PMID: 40820227 Free PMC article.
-
[Conservative therapy for lumbar disc herniation].Orthopadie (Heidelb). 2024 Dec;53(12):918-927. doi: 10.1007/s00132-024-04579-3. Epub 2024 Nov 15. Orthopadie (Heidelb). 2024. PMID: 39546019 Review. German.
References
MeSH terms
LinkOut - more resources
Full Text Sources
Medical
