. 2022 Dec 19:13:1089092.
doi: 10.3389/fmicb.2022.1089092. eCollection 2022.

Acanthamoeba spp. aggregate and encyst on contact lens material increasing resistance to disinfection

Affiliations

Acanthamoeba spp. aggregate and encyst on contact lens material increasing resistance to disinfection

Allison Campolo et al. Front Microbiol. .

Abstract

Introduction: Acanthamoeba keratitis is often caused when Acanthamoeba contaminate contact lenses and infect the cornea. Acanthamoeba is pervasive in the environment as a motile, foraging trophozoite or biocide-resistant and persistent cyst. As contact lens contamination is a potential first step in infection, we studied Acanthamoeba's behavior and interactions on different contact lens materials. We hypothesized that contact lenses may induce aggregation, which is a precursor to encystment, and that aggregated encystment would be more difficult to disinfect than motile trophozoites.

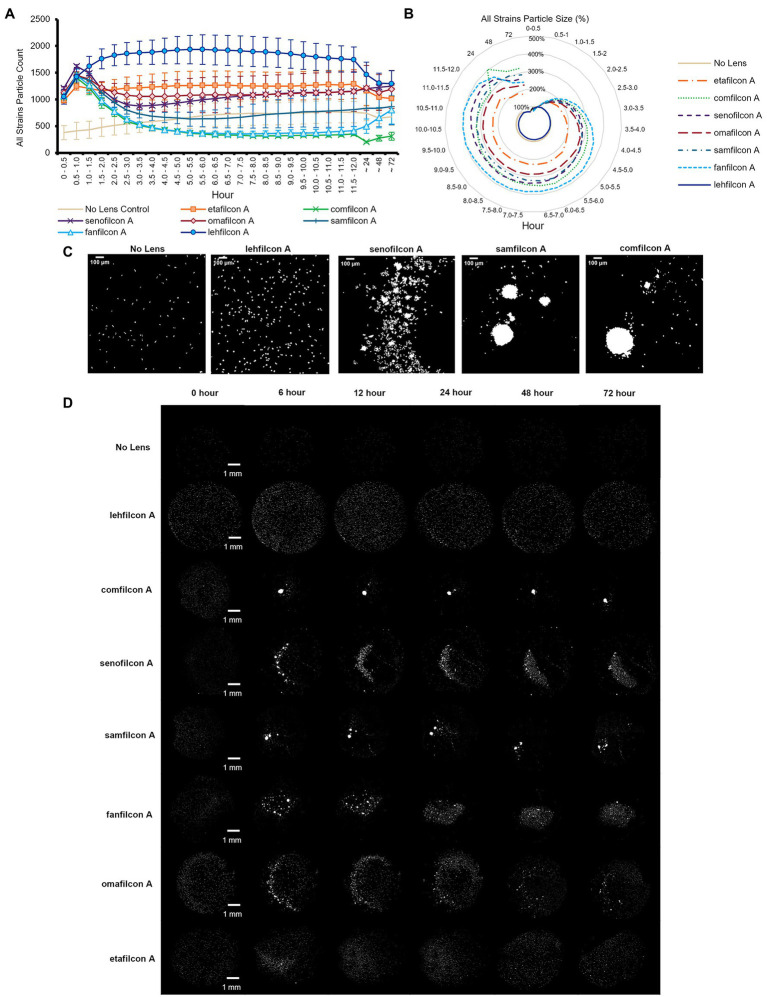
Methods: Six clinically and/or scientifically relevant strains of Acanthamoeba (ATCC 30010, ATCC 30461, ATCC 50370, ATCC 50702, ATCC 50703, and ATCC PRA-115) were investigated on seven different common silicone hydrogel contact lenses, and a no-lens control, for aggregation and encystment for 72 h. Cell count and size were used to determine aggregation, and fluorescent staining was used to understand encystment. RNA seq was performed to describe the genome of Acanthamoeba which was individually motile or aggregated on different lens materials. Disinfection efficacy using three common multi-purpose solutions was calculated to describe the potential disinfection resistance of trophozoites, individual cysts, or spheroids.

Results: Acanthamoeba trophozoites of all strains examined demonstrated significantly more aggregation on specific contact lens materials than others, or the no-lens control. Fluorescent staining demonstrated encystment in as little as 4 hours on contact lens materials, which is substantially faster than previously reported in natural or laboratory settings. Gene expression profiles corroborated encystment, with significantly differentially expressed pathways involving actin arrangement and membrane complexes. High disinfection resistance of cysts and spheroids with multi-purpose solutions was observed.

Discussion: Aggregation/encystment is a protective mechanism which may enable Acanthamoeba to be more disinfection resistant than individual trophozoites. This study demonstrates that some contact lens materials promote Acanthamoeba aggregation and encystment, and Acanthamoeba spheroids obstruct multi-purpose solutions from disinfecting Acanthamoeba.

Keywords: Acanthamoeba; aggregate; contact lens; contact lens solution; cyst; spheroid.


Conflict of interest statement

The funder was not involved in the study design, collection, analysis, interpretation of data, or the writing of this article. The funder approved the decision to submit for publication. All authors except CR are employees of Alcon Research. The remaining author declares that the research was conducted in the absence of any commercial or financial relationships that could be construed as a potential conflict of interest.

Figures

Figure 1
Figure 1
Methodological representations. (A) Plate set up for time lapse count and strain analysis of Acanthamoeba aggregation on contact lens materials. (B) Representative large images taken at 4× magnification in brightfield, and then as they appear in binary which is used for count and size analysis (scale bar = 100 μm). (C) Representative large images of fluorescent confocal microscopy images, taken in brightfield, with three different filters, and merged (please refer to Figure 7 for details; scale bar = 50 μm) depicting encystment at 6 h using a Biofloat spheroid plate.
Figure 2
Figure 2
Acanthamoeba demonstrated significantly less aggregation on lehfilcon A lenses compared to other materials. Mean ± SE of (A) all strains (ATCC 30010, 30461, 50370, 50702, 50703, and PRA-115) count (number of individual particles), (B) all strains normalized particle size. (C) Enlarged representative binary images of amoeba (ATCC 30461) on contact lenses at 12 h timepoint (scale bar = 100 μm), (D) Representative binary images of amoeba (ATCC 30461) on all materials tested (scale bar = 1 mm). Size is normalized to the baselines obtained in the 0.5–1.0 h. Statistical comparisons for subpanels (A) and (B) noted in Supplementary Figure S2. n = 6 per group.
Figure 3
Figure 3
Acanthamoeba demonstrated significantly less aggregation on lehfilcon A lenses compared to other lens materials. Mean ± SE of (A) ATCC 30010 count, (B) ATCC 30010 particle size, (C) ATCC 30461 count, (D) ATCC 30461 particle size, (E) ATCC 50370 count, (F) ATCC 50370 particle size, (G) ATCC 50702 count, (H) ATCC 50702 particle size, (I) ATCC 50703 count, (J) ATCC 50703 particle size, (K) ATCC PRA-115 count, (L) ATCC PRA-115 particle size. Size is normalized to the baselines obtained in the 0.5–1.0 h. Statistical comparisons noted in Supplementary Figures S3 and S4. Matching representative images presented in Figures 4 and 5. n = 6 per group.
Figure 4
Figure 4
Representative images of Acanthamoeba on contact lens materials at 6, 12, and 72 h. (A) ATCC 30010, (B) ATCC 50370. Mean ± SE representation in Figure 3. n = 6 per group.
Figure 5
Figure 5
Representative images of Acanthamoeba on contact lens materials at 6, 12, and 72 h. (A) ATCC 50702, (B) ATCC 50703, (C) ATCC PRA-115. Mean ± SE representation in Figure 3. n = 6 per group.
Figure 6
Figure 6
Once aggregated, cell counts of Acanthamoeba polyphaga (ATCC 30461) spheroids are maintained through 24 h. (A) Cell count of five largest spheroids on any one lens combined, calculated per lens type and presented at mean ± SE among 6 replicates. (B) Percentage of cells that are maintained in spheroids of various sizes over time, delineated by color for each spheroid size. Percentages are an average from 6 replicates per lens material. (C–F) Individual spheroid cell counts at the 0.5 h, 6 h, 12 h, and 24 h timepoints. Each individual spheroid on any lens, replicate, and timepoint is represented by a dot corresponding to its cell count. Replicates are visualized from left to right for each lens material (n = 6). Time 0 baseline is calculated from the 0.5 h to allow cells to adhere to the material. Analyzed via two-way repeat measure ANOVA. Within a given timepoint: (a) p < 0.05 vs. lehfilcon A, (b) p < 0.05 vs. comfilcon A, (c) p < 0.05 vs. senofilcon A, (d) p < 0.05 vs. omafilcon A, (e) p < 0.05 vs. samfilcon A, (f) p < 0.05 vs. fanfilcon A, (g) p < 0.05 vs. etafilcon A, (h) p < 0.05 vs. No Lens Control. Within a given lens type, *p < 0.05 baseline (0.5 h).
Figure 7
Figure 7
Acanthamoeba polyphaga (ATCC 30461) demonstrated encystment at 4 h on all three materials tested, and maintained encystment through 72 h. Controls: Control cells (trophozoites, and cysts pre-made via starvation) were imaged on a glass slide to indicate stain response prior to aggregation experiments. Aggregation: Representative images of fluorescently stained Acanthmoeba spheroids on a spheroid-producing Biofloat plate, senofilcon A, or comfilcon A, without other encystment-inducing substrates. Calcofluor white staining (DAPI filter, blue color) binds to the cellulose of cell walls and indicates cysts. Ethidium homodimer staining (TRITC filter, orange color) binds to nucleic acids and indicates compromised cells or cell death (able to be pentrated by stain and bind to nucleic acids) or presence of extracellular matrix. Fluoroscein diacetate (FITC filer, green color) is a dye that can penetrate trophozoite cell walls and indicates enzymatic activity. All scale bars equal 50 μm. Eight spheroids were created and imaged for each condition in separate wells and representative images were chosen at random.
Figure 8
Figure 8
Genomic analysis of Acanthamoeba polyphaga (ATCC 30461) on three different contact lens materials at hours 4, 12, and 24. (A) Venn diagram of overlapping genes that were significantly different between lehfilcon A vs. comfilcon A, by hour, (B) Venn diagram of overlapping genes that were significantly different between lehfilcon A vs. samfilcon A, by hour, and (C) Venn diagram of overlapping genes that were significantly different between lehfilcon A vs. comfilcon A and lehfilcon A vs. samfilcon A, by hour. (D) 23 genes were significantly differentially expressed between lehfilcon A and both other materials, and in all three time points; p < 0.05, n = 6 per group. Genes are described according to locus identifier, closest identified homologue in ATCC 30010, and GO terms associated with ATCC 30010 protein according to AmoebaDB. (E) All 21 genes are visualized as proteins and their protein–protein interactions are identified via STRING: significant pathways are identified using a false discovery rate of <0.05. Proteins that were significantly upregulated in aggregating lenses at any timepoint are indicated in the protein–protein interaction map with a blue circle. All other proteins visualized were significantly downregulated in aggregating lenses compared to the non-aggregating lens. Further visualizations of other significant genes presented in Figures 9 and 10.
Figure 9
Figure 9
Genomic analysis of Acanthamoeba polyphaga (ATCC 30461) on three different contact lens materials at hours 4, 12, and 24. Eighty two genes were found to be significantly differentially regulated in at least two consecutive time points; p < 0.05, n = 6 per group. Genes were clustered according to gene expression pattern with those depicted falling into a predominantly contact lens material-dependent expression pattern. Heat maps display the kinetics of log2 fold change in expression on lehfilcon A relative to comfilcon A (left), lehfilcon A relative to samfilcon A (middle), and comfilcon A relative to samfilcon A (right). Genes are described according to locus identifier, closest identified homologue in ATCC 30010, and GO terms associated with ATCC 30010 protein according to AmoebaDB.
Figure 10
Figure 10
Genomic analysis of Acanthamoeba polyphaga (ATCC 30461) on three different contact lens materials at hours 4, 12, and 24. Seventy seven genes were found to be significantly differentially regulated in at least two consecutive time points; p < 0.05, n = 6 per group. Genes were clustered according to gene expression pattern with those depicted falling into a time and material-dependent expression pattern. Heat maps display the kinetics of log2 fold change in expression on lehfilcon A relative to comfilcon A (left), lehfilcon A relative to samfilcon A (middle), and comfilcon A relative to samfilcon A (right). Genes are described according to locus identifier, closest identified homologue in ATCC 30010, and GO terms associated with ATCC 30010 protein according to AmoebaDB.
Figure 11
Figure 11
Acanthamoeba polyphaga (ATCC 30461) in three different cell concentrations (1,000, 375, or 100 cells per 100 μl) was used to examine MPS disinfection efficacy against (A) trophozoites, cysts, and spheroids, after cells had adhered to the plate for 12 or 24 h. (B) An inoculum control was run concurrently with the same cultures used in (A). Each bar represents a mean ± SE of 3 replicates, each replicate being composed of 8 wells from which percent survivorship was calculated. Statistical analysis via 2-way ANOVA: comparisons versus a MPS within the same cell condition and same time, *p < 0.05 vs. PAPB/PQ, **p < 0.05 vs. PAPB; comparisons versus a cell condition within the same MPS and same time, p < 0.05 vs. trophozoites, ††p < 0.05 vs. cysts.

Similar articles

Cited by

References

    1. Acanthamoeba polyphaga (Pushkarew) . (2019). Encyclopedia of life. Available at: https://eol.org/pages/593787 (Accessed October 6, 2022).
    1. Ahearn D. G., Simmons R. B., Ward M. A., Stulting R. D. (2012). Potential resistant Morphotypes of Acanthamoeba castellanii expressed in multipurpose contact lens disinfection systems. Eye Contact Lens 38, 400–405. doi: 10.1097/ICL.0b013e318261ab1f, PMID: - DOI - PubMed
    1. Antonelli A., Favuzza E., Galano A., Montalbano Di Filippo M., Ciccone N., Berrilli F., et al. . (2018). Regional spread of contact lens-related Acanthamoeba keratitis in Italy. New Microbiol. 41, 83–85. PMID: - PubMed
    1. Aqeel Y., Siddiqui R., Iftikhar H., Khan N. A. (2013). The effect of different environmental conditions on the encystation of Acanthamoeba castellanii belonging to the T4 genotype. Exp. Parasitol. 135, 30–35. doi: 10.1016/j.exppara.2013.05.017, PMID: - DOI - PubMed
    1. Arshad M., Carnt N., Tan J., Ekkeshis I., Stapleton F. (2019). Water exposure and the risk of contact lens-related disease. Cornea 38, 791–797. doi: 10.1097/ICO.0000000000001898, PMID: - DOI - PubMed