. 2023 Jan 1;79(Pt 1):1-13.
doi: 10.1107/S2053273322010075. Epub 2023 Jan 1.

Geographic style maps for two-dimensional lattices

Affiliations

Geographic style maps for two-dimensional lattices

Matthew Bright et al. Acta Crystallogr A Found Adv. .

Abstract

This paper develops geographic style maps containing two-dimensional lattices in all known periodic crystals parameterized by recent complete invariants. Motivated by rigid crystal structures, lattices are considered up to rigid motion and uniform scaling. The resulting space of two-dimensional lattices is a square with identified edges or a punctured sphere. The new continuous maps show all Bravais classes as low-dimensional subspaces, visualize hundreds of thousands of lattices of real crystal structures from the Cambridge Structural Database, and motivate the development of continuous and invariant-based crystallography.

Keywords: complete invariants; continuity; isometry; metric tensor; obtuse superbase; reduced basis; two-dimensional lattices.


Figures

Figure 1
Figure 1
For almost any perturbation of atoms, the symmetry group and any reduced cell (even its volume) discontinuously change, which justifies a continuous classification.
Figure 2
Figure 2
The deformation of the basis v 1 = (1, 0), v 2 = (−t, 2) for t ∈ [0, 1] defines a continuous loop of lattices. The basis v 1, v 2 is reduced for formula image but after formula image switches to a non-equivalent (up to rigid motion) reduced basis v 1, v 0 = (t − 1, −2).
Figure 3
Figure 3
All lattices continuously deform into each other if we allow any small changes.
Figure 4
Figure 4
The root invariant RI(Λ) from Definition 3.1 used for mapping crystal structures from the CSD in this paper is a continuous and complete isometry invariant of all two-dimensional lattices.
Figure 5
Figure 5
Left: a generic two-dimensional lattice has a hexagonal Voronoi domain with an obtuse superbase v 1, v 2, v 0 = −v 1v 2, which is unique up to permutations and central symmetry. Other pictures: isometric superbases for a rectangular Voronoi domain.
Figure 6
Figure 6
Left: the triangular cone TC = { formula image formula image } is the space of all root invariants, see Definition 3.1. Middle: TC projects to the quotient triangle QT representing all two-dimensional lattices up to isometry and uniform scaling. Right: QT is parameterized by formula image and formula image .
Figure 7
Figure 7
Left: all projected invariants PI(Λ) live in the quotient triangle QT parameterized by formula image and formula image . Right: mirror images (enantiomorphs) of any oblique lattice are represented by a pair (x, y) ↔ (1 − y, 1 − x) in the quotient square QS = QT+ ∪ QT symmetric in the diagonal x + y = 1.
Figure 8
Figure 8
Left: any rectangular lattice Λ with a unit cell a × b has the obtuse superbase B with v 1 = (a, 0), v 2 = (0, b), v 0 = (−a, −b), see Example 3.3 (op). Other lattices Λ have a rectangular cell 2a × 2b and an obtuse superbase B with v 1 = (2a, 0), v 2 = (−a, b), v 0 = (−a, − b). Middle: RI(Λ) = formula image , ab formula image . Right: RI(Λ) = formula image , formula image , see Example 3.3 (oc).
Figure 9
Figure 9
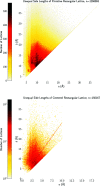
The heat map in QT of all two-dimensional lattices extracted from 870 000+ crystal structures in the CSD. The colour of each pixel indicates (on the logarithmic scale) the number of lattices whose projected invariant formula image = formula image = formula image belongs to this pixel. The darkest pixels represent rectangular lattices on the bottom edge of QT.
Figure 10
Figure 10
The normal-scale heat map in QT of all two-dimensional oblique lattices from CSD crystals. After removing mirror-symmetric lattices on the boundary of QT, we can better see the tendency towards hexagonal lattices at the top-left corner (0, 1) ∈ QT.
Figure 11
Figure 11
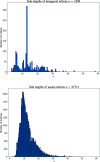
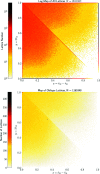
Heat maps of parameters (a, b) in ångströms. Top: rectangular lattices with primitive unit cells a × b in N = 1 268 065 crystal structures in the CSD. Bottom: centred rectangular lattices with conventional cells 2a × 2b in N = 150 167 crystal structures in the CSD.
Figure 12
Figure 12
The histograms of minimum inter-point distances a in ångströms.
Figure 13
Figure 13
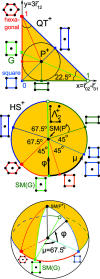
Top: in QT+, the Greenwich line goes from the ‘empty’ point (1,0) through incentre P + to the point formula image . Middle: the hemisphere HS+ has the north pole at P +, the equator ∂QT+ of mirror-symmetric lattices. Bottom: the longitude μ ∈ (−180°, + 180°] anticlockwise measures angles from the Greenwich line, the latitude φ ∈ [−90°, + 90°] measures angles from the equator to the north pole.
Figure 14
Figure 14
The heat map of two-dimensional lattices from crystal structures in the CSD on the northern hemisphere. The radial distance is the latitude φ ∈ [0°, 90°]. Top: all N = 2 191 887 lattices with sign(Λ) ≥ 0, φ ≥ 0. Bottom: all N = 741 105 oblique lattices with sign(Λ) > 0, φ > 0.
Figure 15
Figure 15
The heat map of two-dimensional lattices from crystal structures in the CSD on the northern hemisphere. The radial distance is the latitude φ ∈ [0°, 90°]. Top: all N = 1 854 209 lattices with sign(Λ) ≤ 0, φ ≤ 0. Bottom: all N = 406 930 oblique lattices with sign(Λ) < 0, φ < 0.
Figure 16
Figure 16
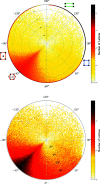
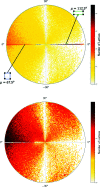
The heat map of two-dimensional lattices from crystal structures in the CSD on the western hemisphere. Angles on the circumference show the latitude φ ∈ [−90°, 90°]. Top: N = 1 100 580 lattices with μ ∈ (−180°, 0°]. The hexagonal lattice at μ = −45° and the centred rectangular lattice at μ = −112.5° are marked on the horizontal arc (western half-equator). Bottom: all N = 932 626 oblique lattices with μ ∈ (−180°, 0°] and φ ≠ 0.
Figure 17
Figure 17
The heat map of two-dimensional lattices from crystal structures in the CSD on the eastern hemisphere. Angles on the circumference show the latitude φ ∈ [−90°, 90°]. Top: all N = 1 511 307 lattices with μ ∈ [0°, 180°), the square lattice point at μ = 67.5° and the rectangular lattice at μ = 112.5° are marked on the horizontal arc (eastern half-equator). Bottom: all N = 215 409 oblique lattices with μ ∈ [0°, 180°), φ ≠ 0.
Figure 18
Figure 18
Heat maps of two-dimensional lattices derived from crystal structures in the CSD in the quotient square QS. Each pixel in the map represents a 0.005 × 0.005 interval of projected form invariant value, where each such value uniquely represents a lattice up to rigid motion only. Top: N = 2 611 887 lattices derived from the CSD. Projected invariants for primitive and centred rectangular lattices are duplicated at the boundaries of the quotient square – indicative positions of non-trivially symmetric lattices are shown. Bottom: all N = 1 165 348 oblique (non-mirror-symmetric) lattices derived from the CSD.

References

    1. Andrews, L. C. & Bernstein, H. J. (1988). Acta Cryst. A44, 1009–1018.
    1. Andrews, L. C. & Bernstein, H. J. (2014). J. Appl. Cryst. 47, 346–359. - PMC - PubMed
    1. Andrews, L. C., Bernstein, H. J. & Pelletier, G. A. (1980). Acta Cryst. A36, 248–252.
    1. Andrews, L. C., Bernstein, H. J. & Sauter, N. K. (2019a). Acta Cryst. A75, 115–120. - PMC - PubMed
    1. Andrews, L. C., Bernstein, H. J. & Sauter, N. K. (2019b). Acta Cryst. A75, 593–599. - PMC - PubMed