. 2023 Feb 23;8(1):e0057622.
doi: 10.1128/msystems.00576-22. Epub 2023 Jan 5.

Dynamics of Microbial Community and Potential Microbial Pollutants in Shopping Malls

Affiliations

Dynamics of Microbial Community and Potential Microbial Pollutants in Shopping Malls

Xin-Li An et al. mSystems. .

Abstract

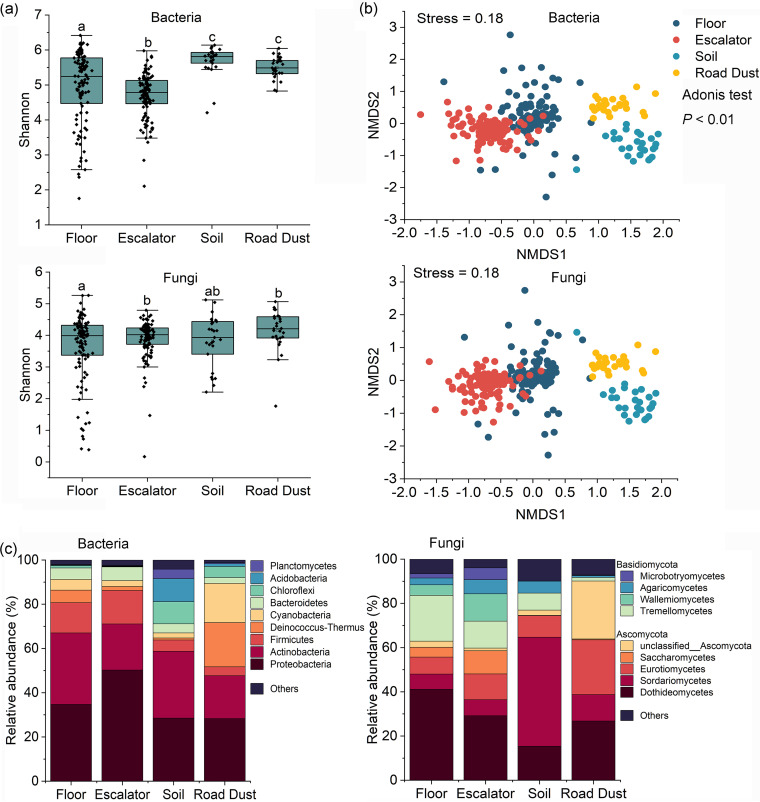
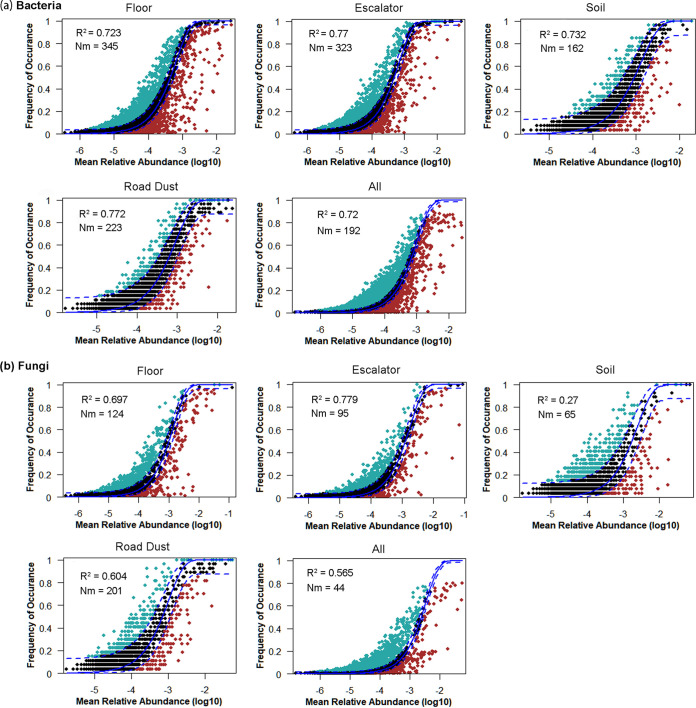
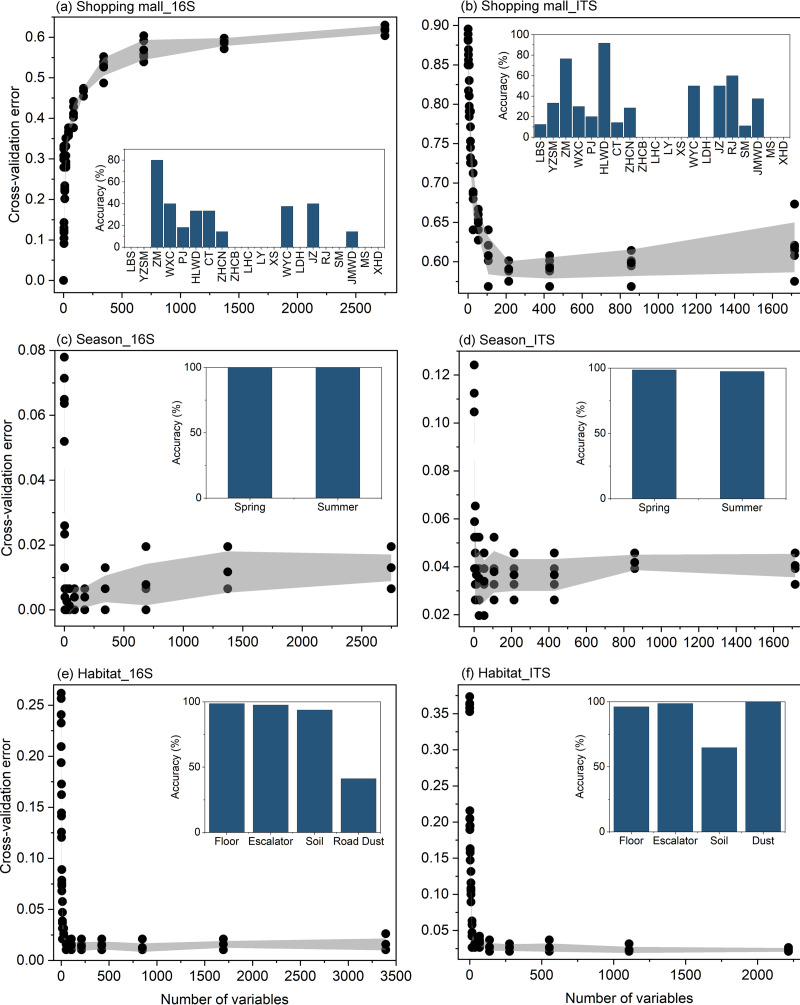
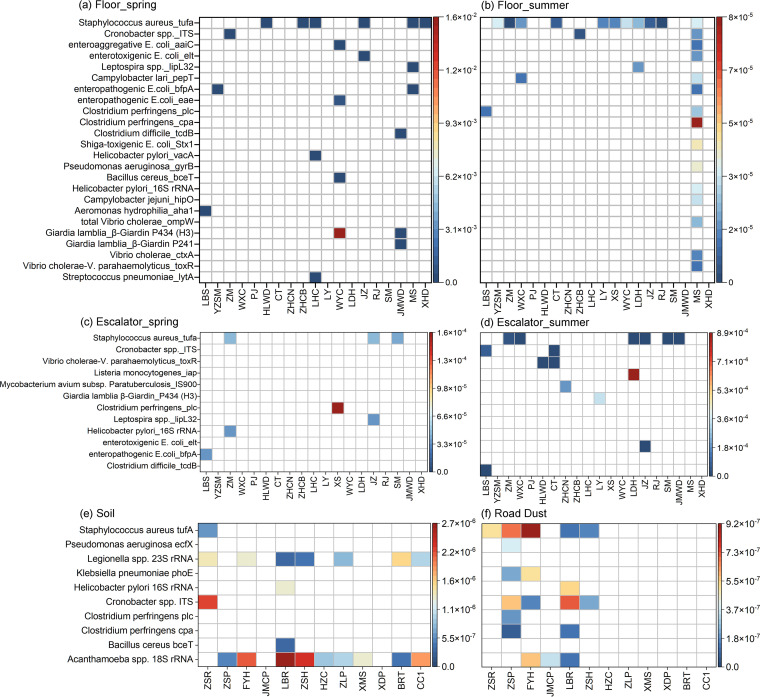
Shopping malls offer various niches for microbial populations, potentially serving as sources and reservoirs for the spread of microorganisms of public health concern. However, knowledge about the microbiome and the distribution of human pathogens in malls is largely unknown. Here, we examine the microbial community dynamics and genotypes of potential pathogens from floor and escalator surfaces in shopping malls and adjacent road dusts and greenbelt soils. The distribution pattern of microbial communities is driven primarily by habitats and seasons. A significant enrichment of human-associated microbiota in the indoor environment indicates that human interactions with surfaces might be another strong driver for mall microbiomes. Neutral community models suggest that the microbial community assembly is strongly driven by stochastic processes. Distinct performances of microbial taxonomic signatures for environmental classifications indicate the consistent differences of microbial communities of different seasons/habitats and the strong anthropogenic effect on homogenizing microbial communities of shopping malls. Indoor environments harbored higher concentrations of human pathogens than outdoor samples, also carrying a high proportion of antimicrobial resistance-associated multidrug efflux genes and virulence genes. These findings enhanced the understanding of the microbiome in the built environment and the interactions between humans and the built environment, providing a basis for tracking biothreats and communicable diseases and developing sophisticated early warning systems. IMPORTANCE Shopping malls are distinct microbial environments which can facilitate a constant transmission of microorganisms of public health concern between humans and the built environment or between human and human. Despite extensive investigation of the natural environmental microbiome, no comprehensive profile of microbial ecology has been reported in malls. Characterizing microbial distribution, potential pathogens, and antimicrobial resistance will enhance our understanding of how these microbial communities are formed, maintained, and transferred and help establish a baseline for biosurveillance of potential public health threats in malls.

Keywords: antimicrobial resistance; built environment; human pathogen; microbial assembly; microbial interactions.


Conflict of interest statement

The authors declare no conflict of interest.

Figures

FIG 1
FIG 1
Diversity and composition of the floor, escalator, greenbelt soil, and road dust microbial communities. (a) Shannon diversity of bacterial and fungal communities across different inhabitants. (b) Distribution patterns of microbial communities visualized using NMDS analysis based on Bray-Curtis distance. (c) Relative abundances of bacterial taxa (at the phylum level) and fungal taxa (at the class level).
FIG 2
FIG 2
NCM of bacterial (a) and fungal (b) communities across floor, escalator, soil, and road dust. “All” represents microbial communities from all habitats. Dark dots indicate occurrence frequency within the 95% confidence interval (dashed blue lines). ASVs that occur more and less frequently than predicted by NCM are marked in green and red, respectively. The coefficient of determination (R2) is the goodness of fit of the neutral model, and it ranges from 0 (no fit) to 1 (perfect fit). Nm indicates the estimates of the metacommunity size times immigration rate. N represents the metacommunity size, and m is the immigration rate.
FIG 3
FIG 3
Classification accuracy of the optimized random forest models for assigning samples to shopping malls, seasons, and habitats. The top 10 important bacterial and fungal signatures were selected as the optimal biomarker sets to optimize the random forest model based on the five cross-validation sets of trained samples. Embedded histograms revealed that the prediction performance of random forest models was evaluated using the testing set (validation set), measured as accuracy.
FIG 4
FIG 4
Heat map showing the incidence and relative abundance (copies/copy of 16S rRNA gene) of marker genes for human pathogens detected from floors (a and b), escalators (c and d), soils (e), and road dusts (f) by using HT-qPCR assays.
FIG 5
FIG 5
Genomic analysis and antimicrobial susceptibility of Enterobacteriaceae species (n = 20) retrieved from floors and escalators. (a) Phylogenetic tree (left) of all strains based on full-length 16S rRNA gene sequences (bootstrap = 10,000). A bubble plot (right) reflects the detection of antibiotic resistance genes (annotated by searching against CARD database; red) and virulence genes (annotated by searching against VFDB database; orange) from genome sequences and antimicrobial susceptibility test (green; strains marked in gray are the ones for which the ertapenem susceptibility test was not performed). (b) A rooted maximum-likelihood phylogenetic tree was constructed based on the alignment of the core genome single nucleotide polymorphisms. The strains in the red branches clustered together, which was consistent with the clustering of their full-length 16S rRNA genes. (c) Flanking regions of the detected antibiotic resistance genes in contigs. Arrows indicate the direction of gene transcription. Different genes are indicated by different colors. Genes with ≥98% amino acid identity and a query coverage of ≥99% were annotated by mapping sequences against the NCBI nr database. AGF, curli fibers/thin aggregative fimbriae.

References

    1. Gilbert JA, Stephens B. 2018. Microbiology of the built environment. Nat Rev Microbiol 16:661–670. doi: 10.1038/s41579-018-0065-5. - DOI - PubMed
    1. Kembel SW, Meadow JF, O'Connor TK, Mhuireach G, Northcutt D, Kline J, Moriyama M, Brown GZ, Bohannan BJ, Green JL. 2014. Architectural design drives the biogeography of indoor bacterial communities. PLoS One 9:e87093. doi: 10.1371/journal.pone.0087093. - DOI - PMC - PubMed
    1. Gibbons SM. 2016. The built environment is a microbial wasteland. mSystems 1:e00033-16. doi: 10.1128/mSystems.00033-16. - DOI - PMC - PubMed
    1. Hsu T, Joice R, Vallarino J, Abu-Ali G, Hartmann EM, Shafquat A, DuLong C, Baranowski C, Gevers D, Green JL, Morgan XC, Spengler JD, Huttenhower C. 2016. Urban transit system microbial communities differ by surface type and interaction with humans and the environment. mSystems 1:e00018-16. doi: 10.1128/mSystems.00018-16. - DOI - PMC - PubMed
    1. Leung MH, Lee PKH. 2016. The roles of the outdoors and occupants in contributing to a potential pan-microbiome of the built environment: a review. Microbiome 4:21. doi: 10.1186/s40168-016-0165-2. - DOI - PMC - PubMed

Publication types

LinkOut - more resources