. 2023 Mar 15;133(6):e165245.
doi: 10.1172/JCI165245.

Clonally expanded HIV-1 proviruses with 5'-leader defects can give rise to nonsuppressible residual viremia

Affiliations

Clonally expanded HIV-1 proviruses with 5'-leader defects can give rise to nonsuppressible residual viremia

Jennifer A White et al. J Clin Invest. .

Abstract

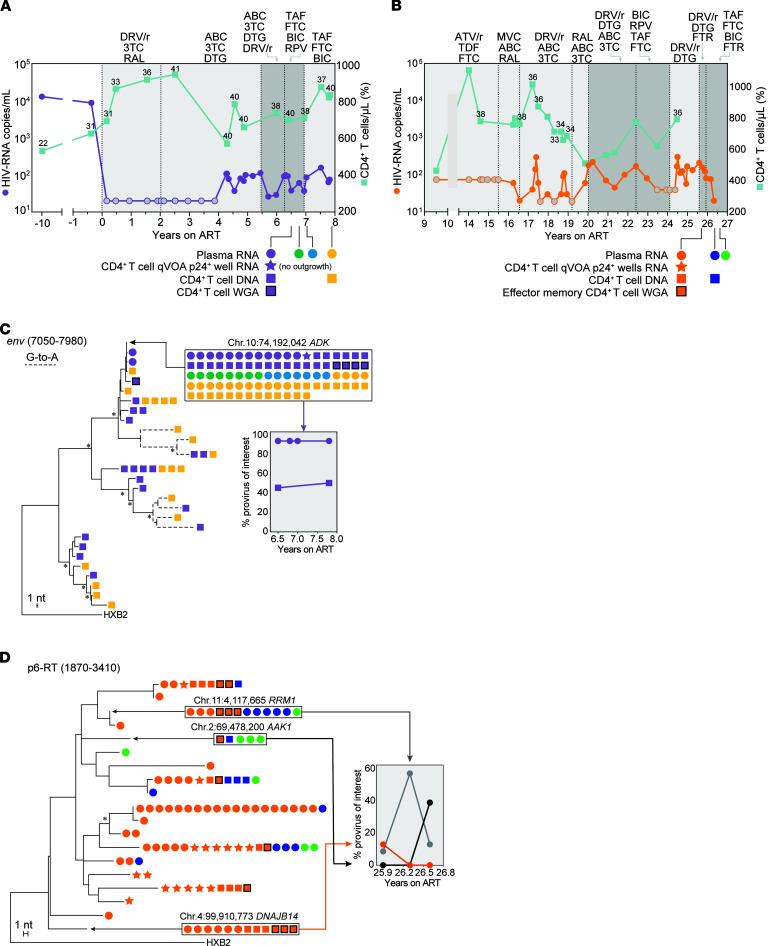
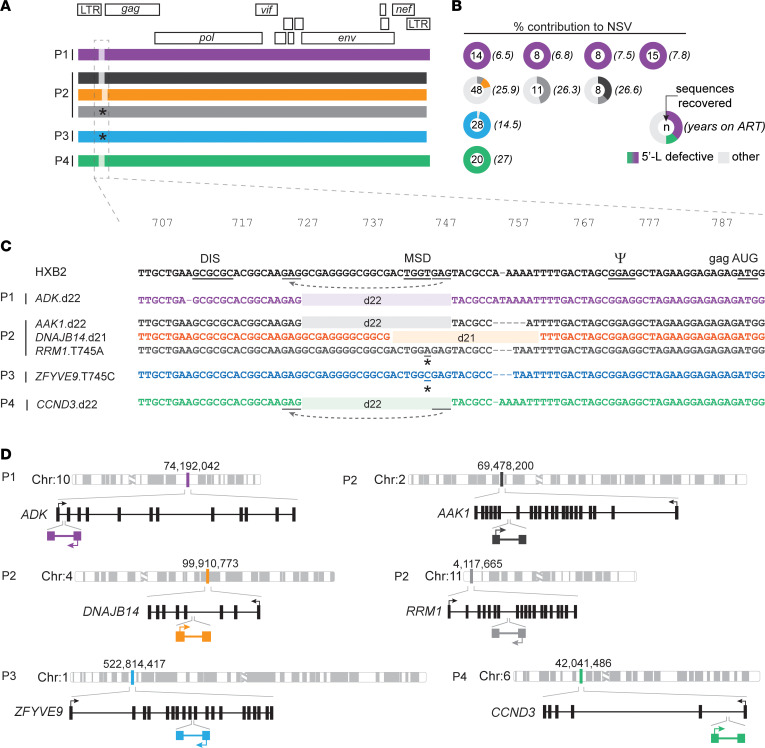
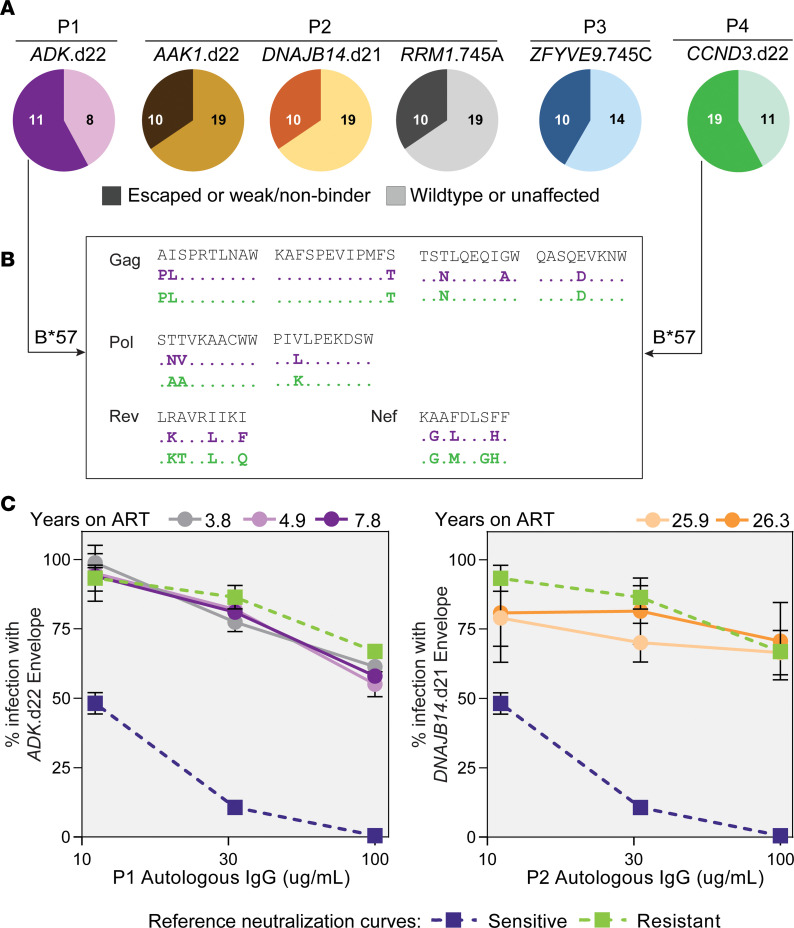
BackgroundAntiretroviral therapy (ART) halts HIV-1 replication, decreasing viremia to below the detection limit of clinical assays. However, some individuals experience persistent nonsuppressible viremia (NSV) originating from CD4+ T cell clones carrying infectious proviruses. Defective proviruses represent over 90% of all proviruses persisting during ART and can express viral genes, but whether they can cause NSV and complicate ART management is unknown.MethodsWe undertook an in-depth characterization of proviruses causing NSV in 4 study participants with optimal adherence and no drug resistance. We investigated the impact of the observed defects on 5'-leader RNA properties, virus infectivity, and gene expression. Integration-site specific assays were used to track these proviruses over time and among cell subsets.ResultsClones carrying proviruses with 5'-leader defects can cause persistent NSV up to approximately 103 copies/mL. These proviruses had small, often identical deletions or point mutations involving the major splicing donor (MSD) site and showed partially reduced RNA dimerization and nucleocapsid binding. Nevertheless, they were inducible and produced noninfectious virions containing viral RNA, but lacking envelope.ConclusionThese findings show that proviruses with 5'-leader defects in CD4+ T cell clones can give rise to NSV, affecting clinical care. Sequencing of the 5'-leader can help in understanding failure to completely suppress viremia.FundingOffice of the NIH Director and National Institute of Dental and Craniofacial Research, NIH; Howard Hughes Medical Institute; Johns Hopkins University Center for AIDS Research; National Institute for Allergy and Infectious Diseases (NIAID), NIH, to the PAVE, BEAT-HIV, and DARE Martin Delaney collaboratories.

Keywords: AIDS/HIV; T cells.


Figures

Figure 1
Figure 1. Clinical history of 2 study participants with NSV and analysis of HIV-1 populations in plasma and CD4+ T cells.
(A and B) Plasma HIV-1 RNA and CD4+ T cell counts over time for P1 and P2. Gray circles indicate values below the limit of quantification. Numbers above squares indicate CD4+ T cell percentages. Light gray areas indicate standard ART. Dark gray areas indicate ART intensification. (C) Maximum likelihood tree analysis of env single-genome sequences from P1. Dashed branches indicate sequences with hypermutation. Tree nodes with bootstrap values above 80 are marked by asterisks. Identical sequences matching proviruses with integration and full genome data are highlighted in boxes. Chromosomal location is indicated above boxed area. Frequencies of variants of interests over time are shown in the graph insert. (D) Maximum likelihood tree analysis of P6-RT single-genome sequences from P2. Only plasma and viral outgrowth RNA sequences are shown, together with matching proviral DNA sequences (the complete tree is shown in Supplemental Figure 3). 3TC, lamivudine; ABC, abacavir; FTC, emtricitabine; TDF, tenofovir disoproxil fumarate; TAF, tenofovir alanfenamide; DRV/r, darunavir-ritonavir; ATV/r, atazanavir-ritonavir; RAL, raltegravir; DTG, dolutegravir; BIC, bictegravir; MVC, maraviroc; RPV, rilpivirine; FTR, fostemsavir.
Figure 2
Figure 2. Paired full-genome sequencing and integration site analysis of 5′-L–defective proviruses causing NSV.
(A) Mapped sequences of proviruses contributing to plasma HIV-1 RNA in each participant. Proviruses of interest are color-coded throughout the figure. Light-shaded areas indicate small 5′-L deletions. Stars indicate point mutations affecting the MSD site. (B) Percentage contributions to NSV of defective proviruses of interest. (C) 5′-L defects aligned to the HXB2 reference. DIS, dimerization initiation signal; PSI, packaging signal; AUG, Gag start codon. Dashes indicate length polymorphisms. Gray lines highlight GAG repeats at deletion junctions causing misplaced jumping of reverse transcriptase (dashed gray arrows). (D) Chromosomal and gene locations of proviruses causing viremia. Sets of arrows indicate direction of proviral and host gene transcription. Schematic gene tracks are shown in black, with vertical bars representing exons.
Figure 3
Figure 3. 5′-L deletions alter dimerization propensities and NC-binding properties.
(A) Secondary structure of the HIV-1 NL4-3 gRNA 5′-L with patient deletions indicated in purple (d22) and orange (d21), with a region of overlap within the splice donor (SD) shown in red. High-affinity binding sites with endothermic contribution on ITC binding within the psi hairpin are indicated with blue text. Gray text indicates the portion of AUG truncated to better study the dimer and its initial binding sites by ITC. (B) Concentration-dependent dimerization assays of the full leader show that the WT and d21 constructs maintain similar dimerization propensities, while the d22 variants exhibit reduced dimerization. (CE) ITC isotherms for the truncated dimeric 5-L titrated with low protein-to-RNA ratios. WT exhibits previously described initial binding with an endothermic contribution (C) that is not seen for the d22 (D) or d21 (E) 5-L constructs.
Figure 4
Figure 4. 5′-L-defective proviruses are inducible and their genomic RNA is packaged and can use alternative splicing donors.
(A) CD4+ T cells from P1 and P2 were cultured for 48 hours in the presence of dolutegravir (DTG) and anti-CD3/CD28 beads. Cells and supernatants were collected at 0, 24, and 48 hours. Right panel shows the location of primers and probes used to quantify viral RNA. Shaded areas indicate 5-L deletion used to measure provirus-specific transcription. (B) Mean levels of read-through, total, and provirus-specific RNA detected in cells and supernatant upon T cell activation. Gray circles represent digital PCR replicate reactions. Error bars indicate SEM. (C) Singly and multiply spliced transcripts amplified at limiting dilution from cells at 48 hours. Arrows indicate primer locations. Ticks indicate the locations of splicing donors and acceptors in the HIV-1 genome. Major and alternative splicing donor sites are labeled in black. Mapped splicing junctions are underlined and in bold; 22 nt deletion is represented by dashed lines. Numbers in parentheses indicate the number of sequences recovered for each type of spliced variant.
Figure 5
Figure 5. 5′-L deletions lead to noninfectious particles lacking env incorporation.
(A) Deletions found in proviruses causing viremia were introduced in an NL4-3 expression plasmid by site-directed mutagenesis. Deletion start and end positions relative to HXB2 are indicated in parentheses. (B) Copies of HIV-1 RNA recovered at 72 hours after transfection of 293T cells, expressed as copies per mL (left) or normalized by p24 pg/mL (right). (C) Spinoculation of primary CD4+ T cells shows exponential increase in p24 levels only with WT NL4-3, in the absence of antiretrovirals (ARVs: TDF, FTC, DTG). (D) Reverse transcription was assessed by measuring late cDNA products by ddPCR targeting the U5-PBS junction. Primary CD4+ T cells were collected at 0, 6, and 12 hours after spinoculation with and without ARVs. U5-PBS copies detected in the presence of ARVs, which are the result of incomplete DNAseI digestion of plasmid carryover from transfection, were subtracted from copies detected in conditions without ARVs. (E) Virus produced upon 293T transfection was pelleted by ultracentrifugation, lysed, normalized by p24, and used for Western blots with primary antibodies specific to p24 and gp41. (F) Surface staining of HIV-1 env on 293T cells 24 hours after transfection. (G) Frequency of env-positive cells transfected with WT versus 5-L deletions. Fold reduction relative to WT is indicated above each mutant. Results from 2 transfection experiments are shown. Each circle represents the average of 2 technical replicates. (H) Quantification of cell-associated spliced HIV-1 transcripts belonging to the 4 kb class or tat/rev mRNA normalized to RNA ng. (I) Percentage of spliced transcripts relative to total HIV-1 polyA RNA. Error bars indicate SEM (B, H and I) or SD (C and F). Statistical significance between conditions was determined by 1-way ANOVA. *P < 0.05; **P <0.01, ***P <0.001.
Figure 6
Figure 6. Proviruses that contribute to plasma virus are stable over time and show clonal expansion concurrent with onset of NSV.
(A) Experimental approach: genomic DNA is sheared to obtain fragments shorter than 6000 nt. Total LTR copies are quantified with primers and probe targeting both R-U5 junctions, while proviruses of interest are quantified targeting the site of HIV-1 integration or the 5-L deletion. (B) Representative ddPCR 2D plots of ADK.d22-specific assays. Due to the proximity of the integration site and 5 the R-U5 junction, most proviruses of interest are double positive. (C) Longitudinal quantification of total LTR copies and proviruses contributing to viremia. Numbers above symbols indicate mean copies in each sample. Numbers in red indicate limit of detection (gray symbols). Error bars indicate SEM. Shaded areas represent time with plasma HIV-1 RNA above the limit of quantification. Black arrow highlights higher viremia in P4. na, not available.
Figure 7
Figure 7. Cells carrying the ADK.d22 and DNAJB14.21 proviruses are compartmentalized in EM cells.
(A and B) Distribution of CD3+CD4+ live cells based on CD45RA and CCR7 surface markers. Colored boxes represent sorting gates, and numbers indicate percentages of events in each gate. (C and D) Frequency of total LTR copies among sorted CD4 subsets. (E and F) Frequency of ADK.d22 and DNAJB14.d21 among sorted CD4 subsets. Numbers above symbols indicate mean values. Percentages of all LTRs represented by the 2 proviruses are displayed above the graph. (G and H) Contribution of subsets to CD4+ T cells, total LTR copies, and clones carrying the provirus of interest. Gray symbols indicate values below the limit of detection. Error bars indicate SEM. Statistical significance of differences among sorted populations was tested by 1-way ANOVA. Samples were collected at 7.8 and 26.6 years on ART, respectively. *P < 0.05; ****P <0.0001.
Figure 8
Figure 8. Proviruses contributing to viremia show variable proportion of CTL escape mutations and are resistant to autologous neutralization.
(A) Distribution of T cell epitopes from full proviral genomes. Documented escape mutations and predicted weak or nonbinders are indicated in darker shades (left section of the pie charts). Numbers within pie charts represent the number of epitopes analyzed in each category. (B) Representative epitopes restricted by HLA-B*57 showing mutations with documented impact on HLA binding. (C) Neutralization experiments with autologous IgGs and viruses pseudotyped with envs from proviruses of interest. Error bars indicate SD of 3 technical replicates. Neutralization curves of stereotypical sensitive (blue) and resistant (green) envs are displayed for reference.

Comment in

  • Nonsuppressible viremia during HIV-1 therapy meets molecular virology doi: 10.1172/JCI167925

References

    1. Sengupta S, Siliciano RF. Targeting the latent reservoir for HIV-1. Immunity. 2018;48(5):872–895. doi: 10.1016/j.immuni.2018.04.030. - DOI - PMC - PubMed
    1. Chun TW, et al. Presence of an inducible HIV-1 latent reservoir during highly active antiretroviral therapy. Proc Natl Acad Sci U S A. 1997;94(24):13193–13197. doi: 10.1073/pnas.94.24.13193. - DOI - PMC - PubMed
    1. Wong JK, et al. Recovery of replication-competent HIV despite prolonged suppression of plasma viremia. Science. 1997;278(5341):1291–1295. doi: 10.1126/science.278.5341.1291. - DOI - PubMed
    1. Finzi D, et al. Identification of a reservoir for HIV-1 in patients on highly active antiretroviral therapy. Science. 1997;278(5341):1295–1300. doi: 10.1126/science.278.5341.1295. - DOI - PubMed
    1. Siliciano JD, et al. Long-term follow-up studies confirm the stability of the latent reservoir for HIV-1 in resting CD4+ T cells. Nat Med. 2003;9(6):727–728. doi: 10.1038/nm880. - DOI - PubMed

Publication types