. 2023 Mar 1;210(5):609-617.
doi: 10.4049/jimmunol.2200463.

Complete Tolerogenic Adjuvant Stimulates Regulatory T Cell Response to Immunization

Affiliations

Complete Tolerogenic Adjuvant Stimulates Regulatory T Cell Response to Immunization

Guoxing Zheng et al. J Immunol. .

Abstract

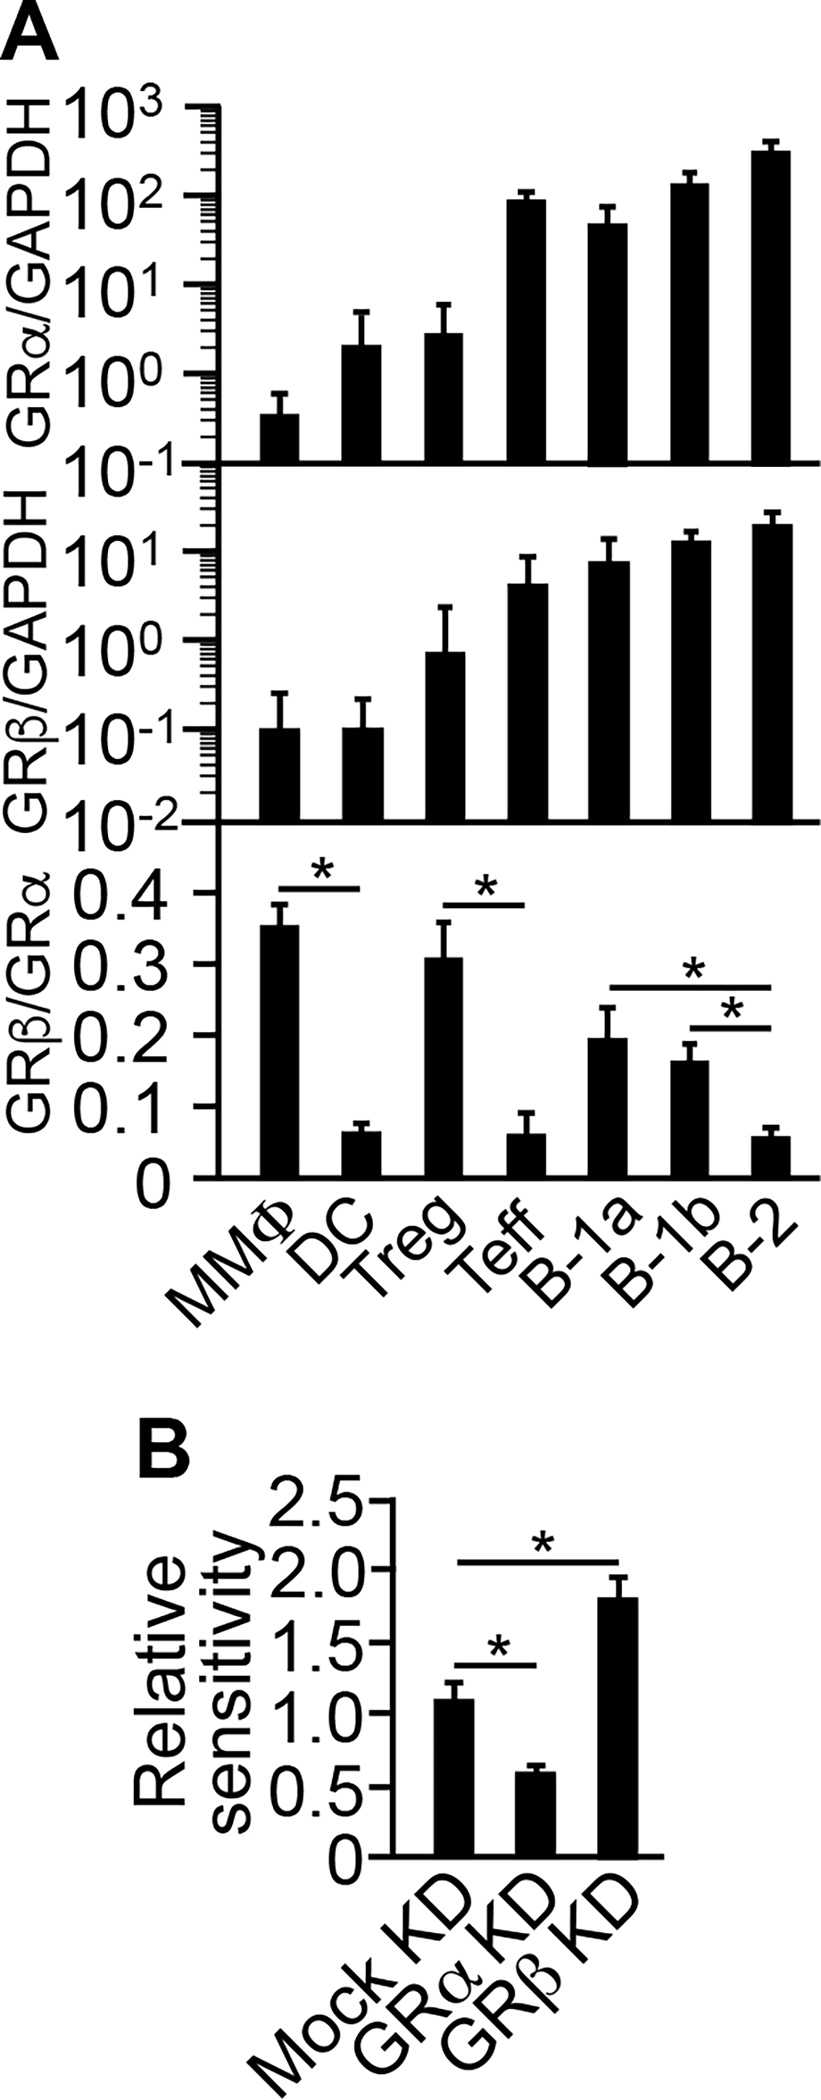
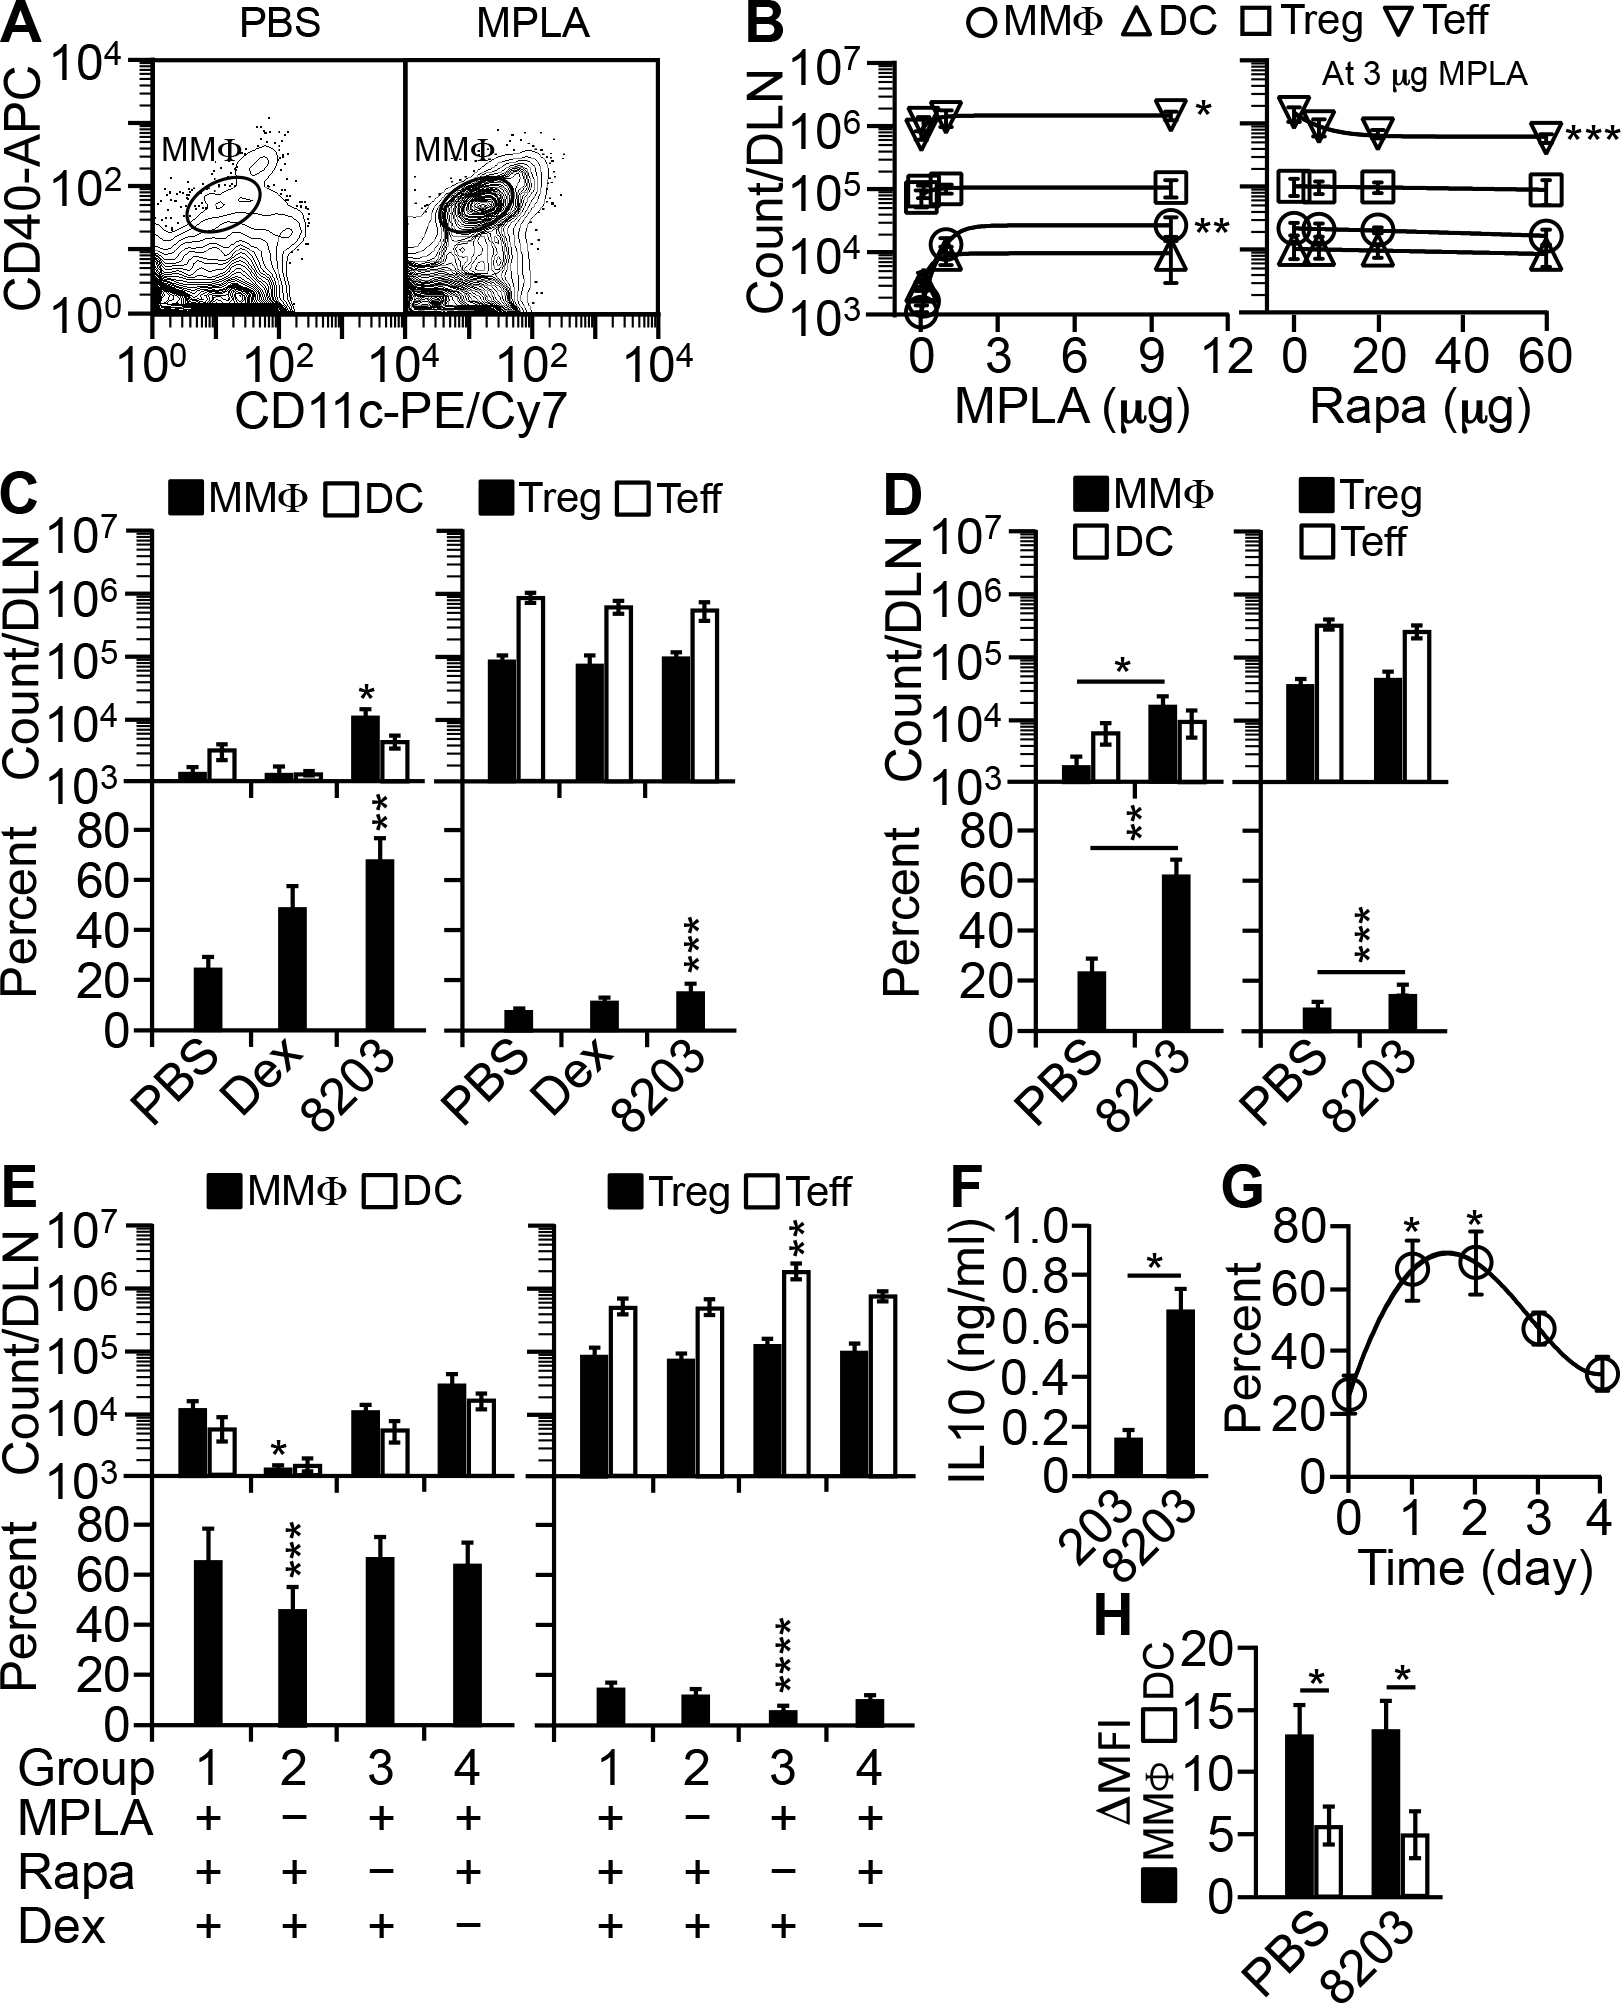
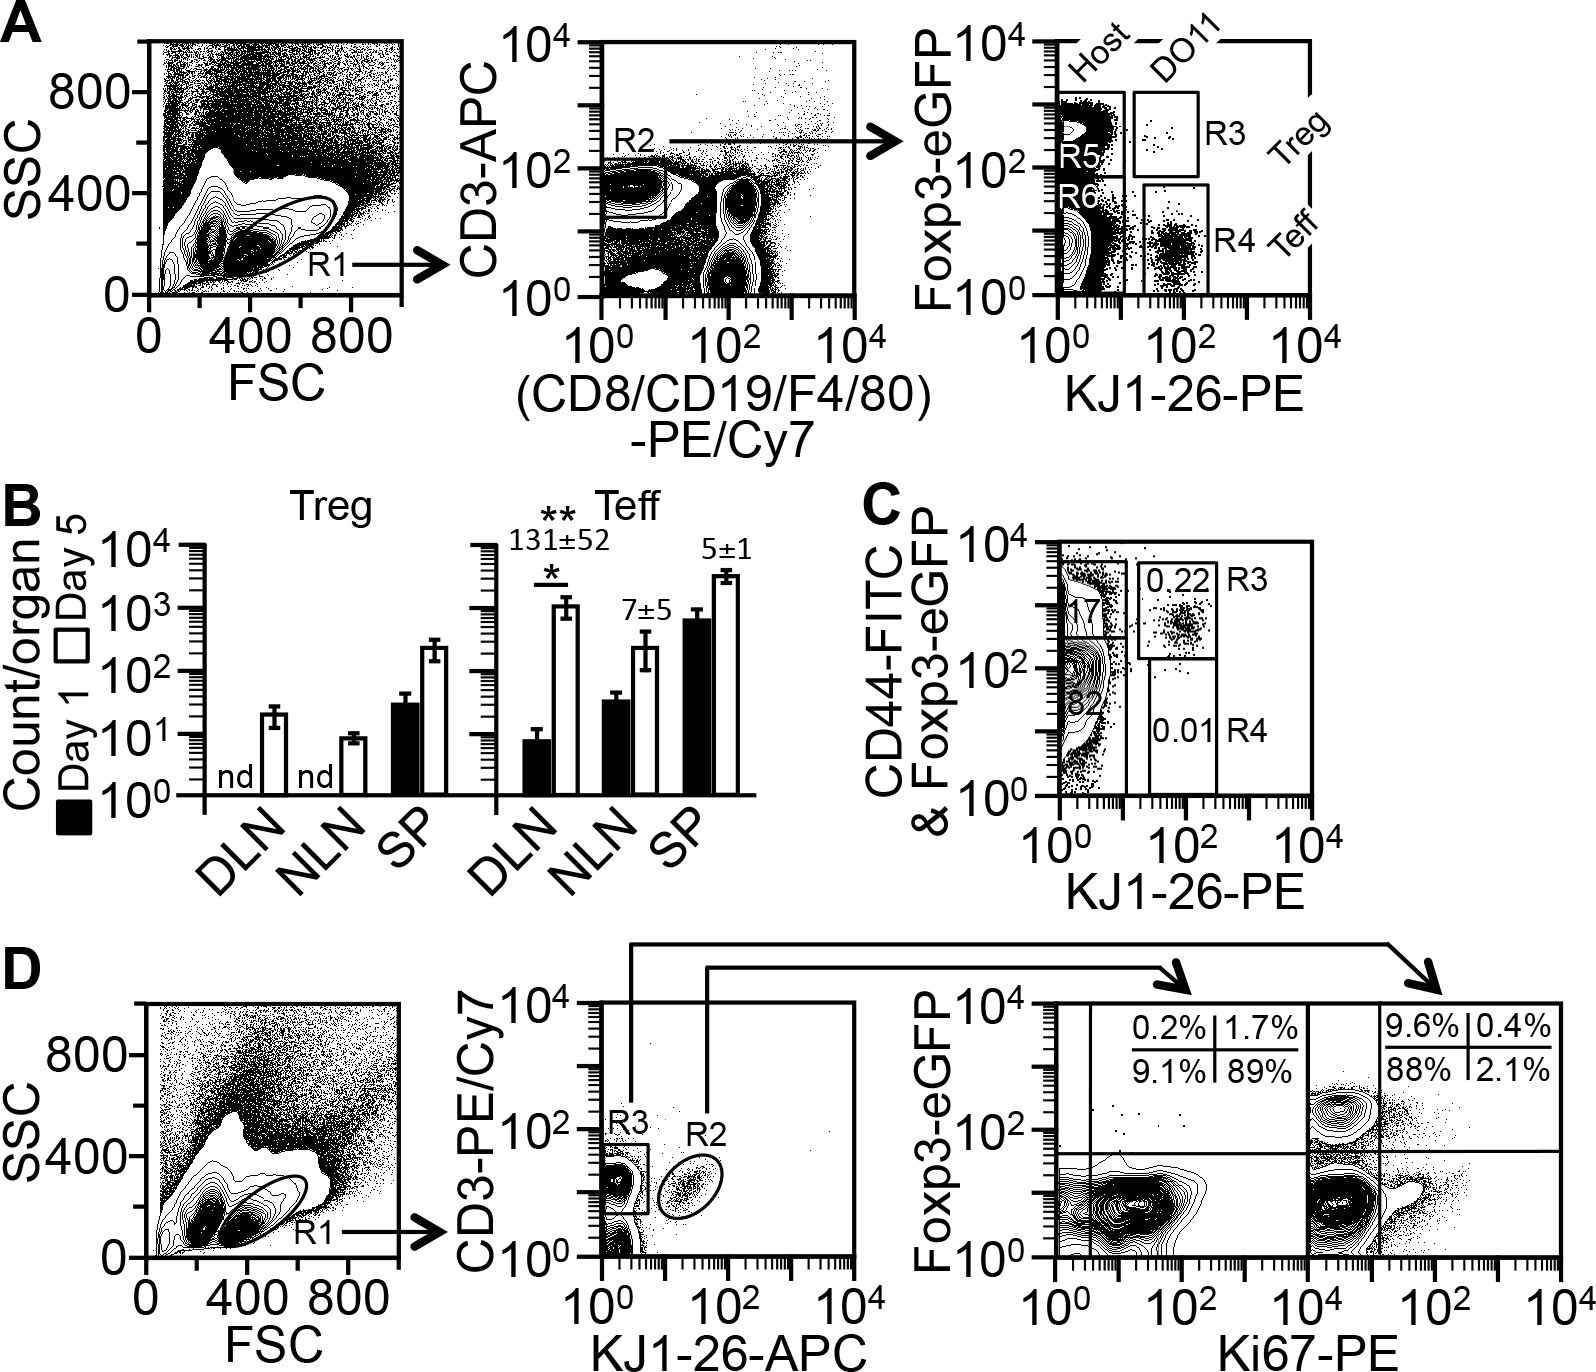
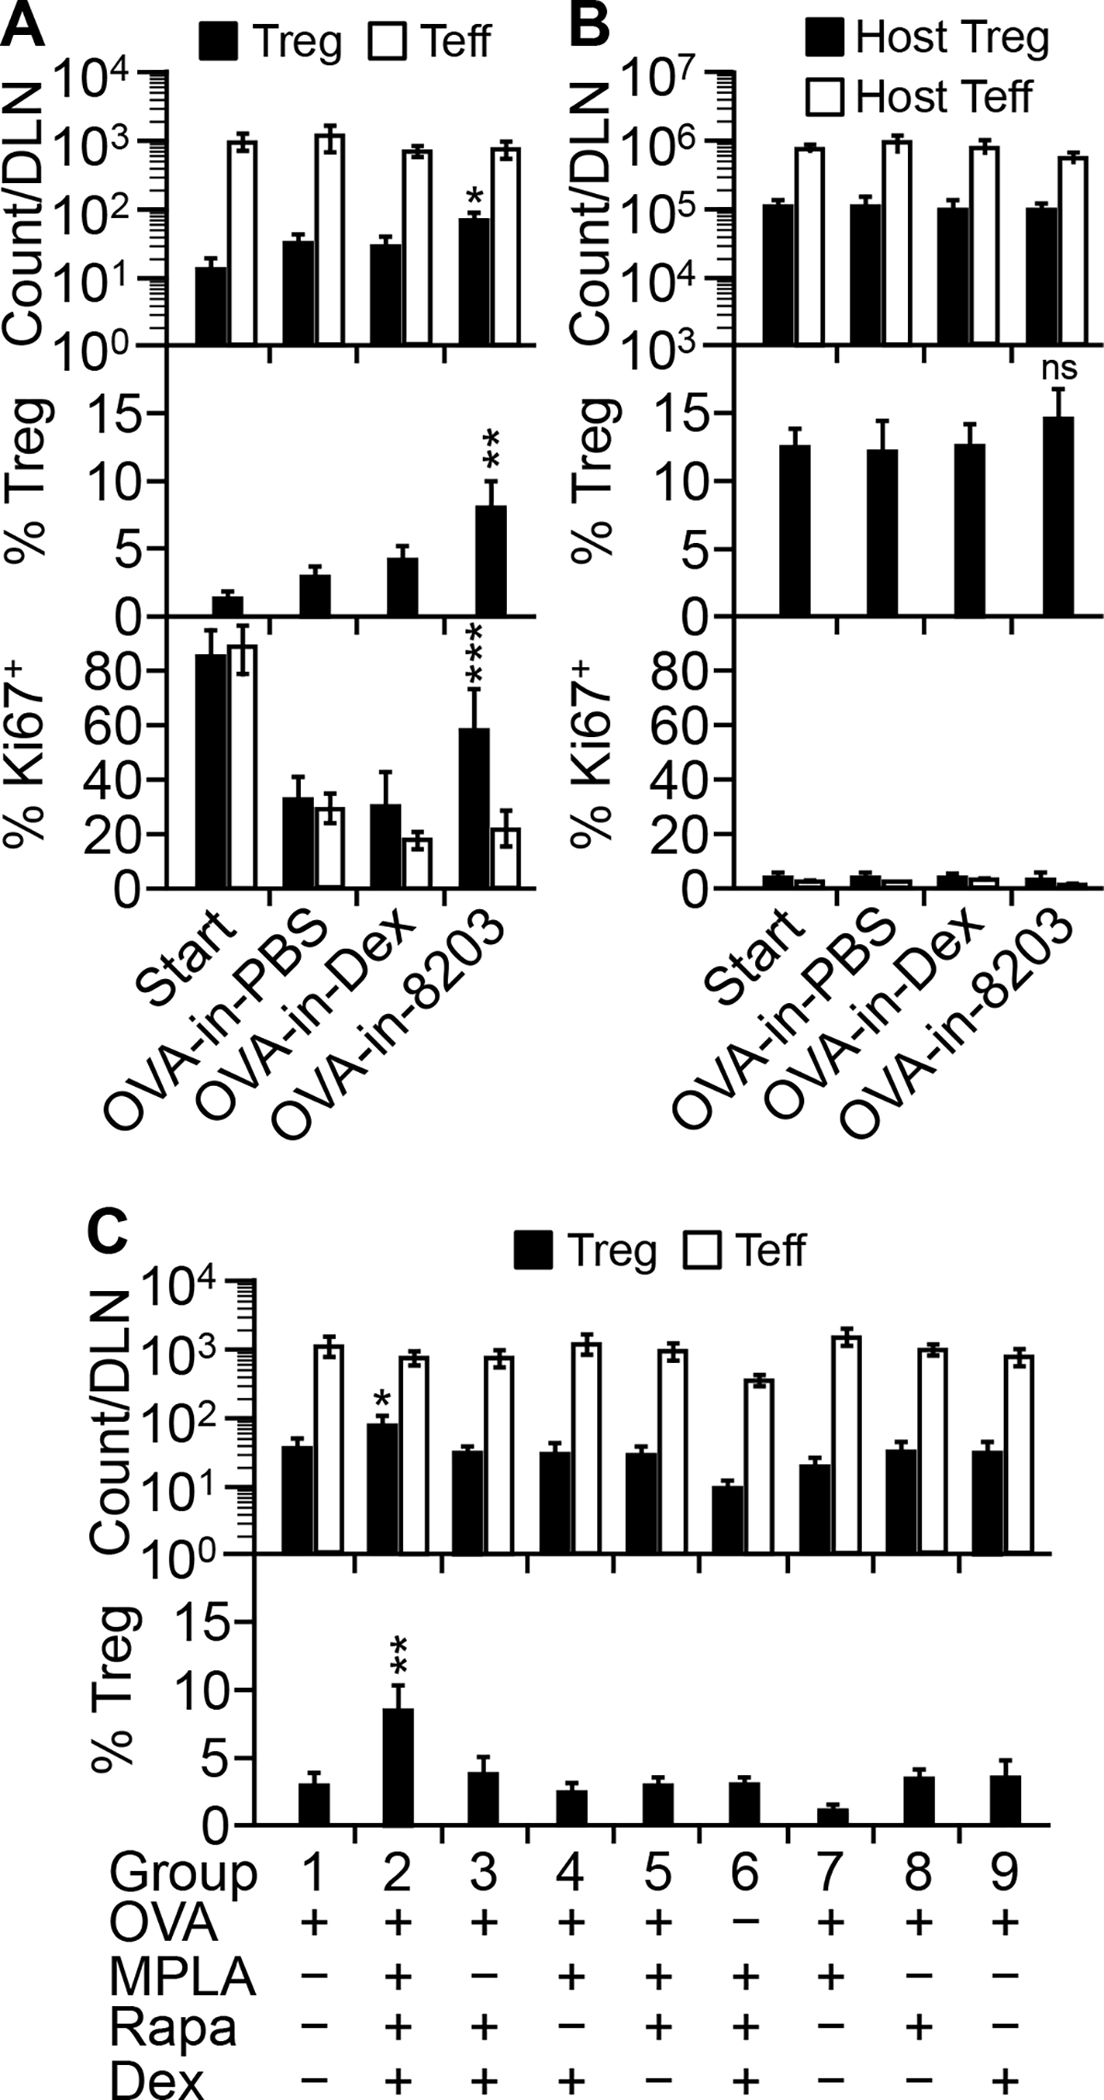
We have determined in mice the minimum composition required for forming a vaccine adjuvant that stimulates a regulatory T (Treg) cell response to immunization, and we named the adjuvant "complete tolerogenic adjuvant." This new kind of adjuvant may let us use the well-proven "Ag with adjuvant" form of immunization for inducing Treg cell-mediated Ag-specific immunosuppression. The minimum composition consists of dexamethasone, rapamycin, and monophosphoryl lipid A at a mass ratio of 8:20:3. By dissecting the respective role of each of these components during immunization, we have further shown why immunosuppressive and immunogenic agents are both needed for forming true adjuvants for Treg cells. This finding may guide the design of additional, and potentially more potent, complete tolerogenic adjuvants with which we may form numerous novel vaccines for treating immune diseases.


Conflict of interest statement

Disclosures

The authors have no financial conflicts of interest.

Figures

FIGURE 1.
FIGURE 1.
Higher GRβ:GRα ratio attributes to lower sensitivity to Dex. (A) Treg cells, B-1 cells, and MMΦs all have a higher GR-β/GR-α ratio in mRNA than their immunogenic counterparts. CD3+CD4+CD25+Foxp3-eGFP+ Treg cells, CD3+CD4+CD25 Foxp3-eGFP Teff cells, CD5+CD19+CD23FSClarge B-1a cells, CD5CD19+CD23FSClarge B-1b cells, CD19+CD23+ FSCsmall B-2 cells, CD11cloCD40lo MMΦs, and CD11chi DCs were flow sorted from BALB/c Foxp3-eGFP mice. Total RNA was isolated and reverse-transcribed, and qRT-PCR was performed using the GRα- or GRβ-specific primer pair and GAPDH as an internal standard (10). Data are mean ± SD of five experiments. *p ≤ 0.001 (one-way ANOVA). (B) Knockdown (“KD”) of GRα decreases, whereas KD of GRβ increases, Dex-induced depletion of B-1 cells in vivo. B-1 cells were treated ex vivo with siRNAs (10). KD efficiencies were within 58–73% (not shown). The treated cells were adoptively transferred into the peritoneal cavity, followed by an intramuscular injection of dexamethasone (8). Cell depletion from the peritoneal cavity was measured as relative to that of untreated B-1 cells (“Relative sensitivity”). Data are mean ± SD of three experiments. *p ≤ 0.003 (one-way ANOVA).
FIGURE 2.
FIGURE 2.
Composition 8203 potentiates DLN for Treg response. (A) MPLA preferentially attracts MMΦs to DLN. Shown is flow cytometry of DLN CD11c+CD40+ cells one day after a single injection of 10 μg of MPLA, or a PBS control, into a footpad. (B) Rapamycin (“Rapa”) blocks MPLA-induced influx of Teff cells to DLN. Shown are dose-response curves generated by nonlinear regression. Left: absolute cell counts for MMΦs, DCs, Treg cells, and Teff cells one day after a single injection into a footpad of a graded dose of MPLA. Right: the same set of cells after injection of 3 μg (based on the left panel) of MPLA mixed with a graded dose of Rapa. Each dose point is mean ± SD of four experiments. *p ≤ 0.03 and **p ≤ 0.01, for Teff and MMΦ counts, respectively, at MPLA doses of ≥1 μg versus 0; ***p ≤ 0.03, Teff count at Rapa doses of ≥6 μg versus 0 (one-way ANOVA). (C) Composition 8203 preferentially attracts MMΦs and Treg cells to DLN. DLN cells were counted one day after a single injection into a footpad of PBS, Dex (8 μg), or 8203. Data are mean ± SD of four experiments. *p ≤ 0.001 and **p ≤ 0.02, for absolute and relative MMΦ counts, respectively, of 8203 injected versus any other; ***p ≤ 0.01, relative Treg count of 8203 injected versus PBS injected (one-way ANOVA). (D) Composition 8203 shows similar effects in C57BL/6 Foxp3-eGFP mice. DLN cells were counted one day after a single injection into a footpad of PBS or 8203. Data are mean ± SD of four experiments. *p = 0.005, **p = 0.00009, and ***p = 0.04 (two-sided t test). (E) Role of each component of 8203. DLN cells were counted one day after a single injection into a footpad of 8203 or a composition missing one of the three components. Data are mean ± SD of four experiments. *p ≤ 0.02 and ***p ≤ 0.03, for absolute and relative MMΦ counts, respectively, in group 2 versus any other group; **p ≤ 0.0002 and ****p ≤ 0.0009, absolute Teff count and relative Treg count, respectively, in group 3 versus any other group (one-way ANOVA). (F) Dexamethasone is required for converting MMΦs (IL-10lo) into Dex-MΦs (IL-10hi) (9). MMΦs were isolated from the DLN by flow sorting one day after injection at a footpad with either 8203 or “203” (20 μg rapamycin/3 μg MPLA, as a negative control for dexamethasone), and cultured at 250,000 cells/ml in U-bottom wells in the presence of 0.1 μg/ml of LPS. At 20 h, the medium was analyzed for IL-10 by a CBA assay. Data are mean ± SD of four experiments. *p ≤ 0.00002 (two-sided t test). (G) Effect of 8203 on MMΦ influx lasts for three days after a single injection. Shown is a nonlinearly fitted decay curve for the relative count of MMΦs (% of total CD11c+CD40+ cells) in the DLN. Each point is mean ± SD of four experiments. *p ≤ 0.02, for days 1 and 2 versus any other day (one-way ANOVA). (H) Composition 8203 allows normal uptake and processing of whole protein Ag. Mice were injected at a footpad with 5 μg of DQ OVA in either PBS or 8203; after 2 days, MMΦs and DCs in the DLN were analyzed for mean fluorescence intensity (MFI) resulted from intracellular cleavage of DQ OVA. ΔMFI = MFI from DQ OVA injected − MFI from PBS (control) injected. Data are mean ± SD of four experiments. *p ≤ 0.004 (two-sided t test).
FIGURE 3.
FIGURE 3.
Model for testing tolerogenic adjuvants. (A) Method for detecting TCR-transgenic (“DO11”) Treg (R1*R2*R3), TCR-transgenic Teff (R1*R2*R4), host Treg (R1*R2*R5), and host Teff (R1*R2*R6) cells in the model (see “Analysis of CD4+ T cell counts in the model”). Depicted are the cells from the DLN on day 5. (B) Counts of KJ1-26+ Treg and Teff cells in DLN, non-draining lymph nodes (“NLN”), and the spleen (“SP”) on day 5 versus day 1, as determined by the method in A. Data are mean ± SD of four experiments. Numbers on the top of the bars indicate the fold change in Teff counts since day 1. *p = 0.004 (two-sided t test); **p ≤ 0.0002, for the fold change in DLN versus NLN and SP (one-way ANOVA); nd, not determined due to low counts. (C) Method for CD44 analysis. Cells shown in A were additionally stained with FITC anti-CD44 and analyzed by the method in A. Numbers in the gates indicate percentages of the total CD4+ T cells. The R3 gate contains both KJ1-26+CD44+ Teff cells (FITC+; 0.22%) and KJ1-26+ Treg cells (Foxp3-eGFP+; 0.004%), as determined with an isotype-matched FITC control (not shown). Shown is one of two similar results. (D) Method for detecting Ki67+ Treg and Teff cells (see “Analysis of CD4+ T cell proliferation in the model”). Depicted are the cells from the DLN on day 5. Quadrant plots on the right are drawn based on the locations of the Ki67 subpopulation. Shown is one of two similar results.
FIGURE 4.
FIGURE 4.
Composition 8203 is a complete tolerogenic adjuvant for Treg cells. (A) Composition 8203 augments absolute expansion of KJ1-26+ Treg cells in DLN. The model was injected on day 5 at the primed footpad with OVA-in-PBS, OVA-in-Dex, or OVA-in-8203. DLN T cells were analyzed on day 8. The baseline of the model (on day 5) is shown as “Start.” Data are mean ± SD of six (for cell count analysis) or four (for Ki67 analysis) experiments. *p ≤ 0.001 and **p ≤ 0.001, for absolute and relative Treg counts, respectively, in the OVA-in-8203 injected versus any other group (one-way ANOVA). ***p ≤ 0.04, for % Ki67+ Treg cells in the OVA-in-8203 injected versus any other group (one-way ANOVA). (B) Composition 8203 has little effect on host Treg or Teff cells in the same DLN shown in A. Data are mean ± SD of six (count analysis) or four (Ki67 analysis) experiments. “ns,” not significant. (C) All the OVA-in-8203 components are required for absolute KJ1-26+ Treg cell expansion. The model was injected with indicated compositions and analyzed as in A. Data are mean ± SD of four experiments. *p ≤ 0.01 and **p ≤ 0.001, for absolute and relative counts, respectively, of KJ1-26+ Treg cells in the OVA-in-8203 treated (group 2) versus any other group (one-way ANOVA).
FIGURE 5.
FIGURE 5.
Composition 8203 augments absolute expansion of Treg cells via MMΦs. (A) Clodronate liposomes (“CL”) reduce OVA-in-8203-induced influx of MMΦs into DLN. CL was injected i.v. on days 4–6, and OVA-in-8203 was injected at the primed footpad on day 5. MMΦs in the DLN were counted on the indicated days. Data are mean ± SD of four experiments. *p ≤ 0.002 versus plain liposomes (“Liposome”) (one-way ANOVA). (B) CL diminishes the effect of 8203 on absolute expansion of Treg cells in DLN (analyzed on day 8). Mice in A were analyzed for KJ1-26+ Treg cells in the same DLN on day 8. Data are mean ± SD of six experiments. *p ≤ 0.02 (one-way ANOVA).
FIGURE 6.
FIGURE 6.
Composition 8203 promotes systemic dissemination of the Treg cells expanded in DLN. (A) OVA-in-8203 expands KJ1-26+ Treg cells in nondraining lymph nodes (“NLN”) and the spleen (“SP”). Data are mean ± SD of six (NLN) or eight (SP) experiments. *p ≤ 0.01 and **p ≤ 0.04, for absolute KJ1-26+ Treg counts in NLN and SP, respectively, in the OVA-in-8203 treated versus any other group (one-way ANOVA). (B) NLN and SP have a smaller fraction of proliferating KJ1-26+ T cells than does DLN. Data are mean ± SD of four experiments. *p ≤ 0.0002 and **p ≤ 0.0004, for % Ki67+ KJ1-26+ Treg and Teff cells, respectively, in DLN versus in NLN and SP (one-way ANOVA). (C) FTY720 (“FTY”) blocks dissemination of OVA-in-8203-expanded Treg cells. The model was injected with OVA-in-8203 either alone (“−FTY”) or with FTY (“+FTY”) on day 5, and cell counts were analyzed on day 8. Data are mean ± SD of four experiments. *p ≤ 0.012 (two-sided t test). (D) Percentages of DLN-derived KJ1-26+ Treg and Teff cells in NLN and SP (“% from DLN“) were calculated from data in C as follows: % from DLN = (count obtained without FTY − average count obtained with FTY) / count obtained without FTY × 100%. *p ≤ 0.001 (two-sided t test).
FIGURE 7.
FIGURE 7.
Composition 8203 helps prolong Treg cell expansion. (A) Kinetics after a single injection. The model was injected once on day 5 at the primed footpad with OVA-in-PBS or OVA-in-8203. KJ1-26+ Treg and Teff cells in the DLN were counted daily thereafter. Shown are daily count curves generated by nonlinear regression. Each time point is mean ± SD of four experiments. *p ≤ 0.002, for % Treg on day 8 versus days 5, 6, and 7 (one-way ANOVA). (B&C) Kinetics during repeated injections. The model was injected on day 5 with OVA-in-8203 (B) or OVA-in-PBS (C) once every 3 days. Expansion of KJ1-26+ Treg and Teff cells in indicated organs was followed in the same interval, and cell count curves generated as described in A. Each time point is mean ± SD of four experiments. (D) Role of Ag and each component of 8203 in T cell expansion. The model was injected and analyzed as in B and C. The day when KJ1-26+ T cells in the DLN reached the maximal number is defined as the “Ending day” for cell expansion. Data are mean ± SD of four experiments. *p ≤ 0.001, for Treg cells in groups 4 and 6 versus group 2 (OVA-in-8203); **p ≤ 0.001, for Treg cells in group 7 versus group 1 (OVA-in-PBS); ***p ≤ 0.001, for Teff cells in groups 4 and 5 versus group 2; “ns” (not significant), for Teff cells in group 7 versus group 1 (one-way ANOVA).
FIGURE 8.
FIGURE 8.
Composition 8203 helps expand nTreg cells. (A) Expansion of KJ1-26+ Treg cells by OVA-in-8203 requires “source Treg cells.” Mice transfused with pure KJ1-26+ Teff cells (see “Mouse model for testing tolerogenic adjuvants”) (“Recipient”) or with PBS (“Non-recipient) were given the optimal regimen of OVA-in-8203. KJ1-26+ Teff and Treg cells were counted three days after the end of the regimen. Data are mean ± SD of two experiments. *p ≤ 0.05 (one-sided t test). (B) Spearman correlation analysis for expression of nTreg markers. KJ1-26+ Treg cells expanded in the model by the optimal regimen of OVA-in-8203 (“OVA-in-8203”) were compared with the source Treg cells in naïve DO11.10 Foxp3-eGFP mice (“naïve”). ΔMFI = MFI of marker-specific staining − MFI of control Ab staining. Data points are average of two experiments. There was a positive correlation between the OVA-in-8203-expanded and the source Treg cells (Rho = 1, p = 0.0028). Of note, the TNFR2 expression depicted is for the TNFR2+ fraction. (C) Expansion of source Treg cells by OVA-in-8203. DO11.10 Foxp3-eGFP mice were primed and given the optimal regimen of OVA-in-8203 in the same manner as described for the model. Three days after the end of the regimen, Treg cells in the DLN (“OVA-in-8203”) were counted and analyzed for TNFR2 expression. The popliteal lymph nodes from naïve mice (PBS injected; “Naïve”) were used as a control. Shown is one of two similar results. (D) Suppression assay. eFluor 670-stained KJ1-26+ Teff responder cells were co-cultured with naïve KJ1-26+ nTreg cells (“Treg1”) or OVA-in-8203-expanded KJ1-26+ Treg cells (“Treg2”). Data are mean ± SD of two experiments. *p ≤ 0.008 (one-way ANOVA).
FIGURE 9.
FIGURE 9.
Composition 8203-adjuvanted immunization induces Ag-specific immune suppression. (A) Counts of KJ1-26+ Treg and Teff cells in the spleen (“SP”) of immunized (“OVA-in-8203”) or control immunized (“OVA-in-PBS”) mice immediately before the challenge. Data are mean ± SD of four experiments. *p = 0.009 (two-sided t test). (B) Counts of KJ1-26+ Treg and Teff cells in the SP five days after the challenge. Data are mean ± SD of four experiments. *p = 0.03 (two-sided t test). (C) Teff response to the challenge. Lower: DTH reactions. Data are mean ± SD of 8 mice/group. *p = 0.001 (two-sided t test). Upper: count of KJ1-26+ Teff cells in pooled DLNs five days after the DTH test for OVA. Of note, KJ1-26+ Treg cells were not analyzed due to low counts. Data are mean ± SD of four experiments. **p = 0.001 (two-sided t test).

References

    1. Sakaguchi S, Mikami N, Wing JB, Tanaka A, Ichiyama K, and Ohkura N. 2020. Regulatory T Cells and Human Disease. Annu Rev Immunol 38: 541–566. - PubMed
    1. Kang Y, Xu L, Wang B, Chen A, and Zheng G. 2008. Cutting edge: Immunosuppressant as adjuvant for tolerogenic immunization. J Immunol 180: 5172–5176. - PMC - PubMed
    1. Chen X, Murakami T, Oppenheim JJ, and Howard OM. 2004. Differential response of murine CD4+CD25+ and CD4+CD25− T cells to dexamethasone-induced cell death. Eur J Immunol 34: 859–869. - PubMed
    1. Chen X, Oppenheim JJ, Winkler-Pickett RT, Ortaldo JR, and Howard OM. 2006. Glucocorticoid amplifies IL-2-dependent expansion of functional FoxP3(+)CD4(+)CD25(+) T regulatory cells in vivo and enhances their capacity to suppress EAE. Eur J Immunol 36: 2139–2149. - PubMed
    1. Northrup L, Sullivan BP, Hartwell BL, Garza A, and Berkland C. 2017. Screening Immunomodulators To Skew the Antigen-Specific Autoimmune Response. Mol Pharm 14: 66–80. - PubMed

Publication types