. 2023 Apr 13;141(15):1858-1870.
doi: 10.1182/blood.2022019138.

MYB insufficiency disrupts proteostasis in hematopoietic stem cells, leading to age-related neoplasia

Affiliations

MYB insufficiency disrupts proteostasis in hematopoietic stem cells, leading to age-related neoplasia

Mary L Clarke et al. Blood. .

Abstract

MYB plays a key role in gene regulation throughout the hematopoietic hierarchy and is critical for the maintenance of normal hematopoietic stem cells (HSC). Acquired genetic dysregulation of MYB is involved in the etiology of a number of leukemias, although inherited noncoding variants of the MYB gene are a susceptibility factor for many hematological conditions, including myeloproliferative neoplasms (MPN). The mechanisms that connect variations in MYB levels to disease predisposition, especially concerning age dependency in disease initiation, are completely unknown. Here, we describe a model of Myb insufficiency in mice that leads to MPN, myelodysplasia, and leukemia in later life, mirroring the age profile of equivalent human diseases. We show that this age dependency is intrinsic to HSC, involving a combination of an initial defective cellular state resulting from small effects on the expression of multiple genes and a progressive accumulation of further subtle changes. Similar to previous studies showing the importance of proteostasis in HSC maintenance, we observed altered proteasomal activity and elevated proliferation indicators, followed by elevated ribosome activity in young Myb-insufficient mice. We propose that these alterations combine to cause an imbalance in proteostasis, potentially creating a cellular milieu favoring disease initiation.


Conflict of interest statement

Conflict-of-interest disclosure: The authors declare no competing financial interests.

Figures

None
Graphical abstract
Figure 1.
Figure 1.
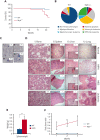
Myb deficiency leads to age-related hematological disease. (A) Kaplan-Meier curve showing the percentage survival of a cohort of aging WT and Myb+/− mice (n = 19 and 17, respectively) over 22 months. Significance was calculated using the log rank test with P = .0035. (B) Pie charts depicting the types of myeloid disease arising with age. (C) Blood smears from diseased mice showing examples of abnormal peripheral blood cells. (i) Target cell erythrocyte (codocyte) (∗). Polychromatic erythrocyte (→). (ii) Teardrop erythrocyte (dacrocyte) (∗). (iii) Micromegakaryocte (∗). (iv) Howell-Jolly body in erythrocytes (∗). Ring-neutrophil (→). Scale bar = 20 μm. (D) Representative sections from tibial bone, spleen, liver, and lung from mice characterized as WT, MPN, MDS, or myeloid leukemia. Scale bars are indicated. (i) Bone section with megakaryocytes (∗) showing an increase in diseased mice. Scale bar = 50 μm. (ii) Spleen sections showing disrupted red and white pulp structure in diseased mice. An example area of white (circle) and red (R) pulp is indicated. Scale bar = 100 μm. (iii) Liver sections showing infiltration of myeloid cells (+). Scale bar = 100 μm (inset: scale bar = 50 μm). (iv) Lung sections showing infiltration of myeloid cells (→). Scale bar = 100 μm. (E) Spleen weight (g) of aging WT and Myb+/− mice at the point of culling (n = 19 and 17, respectively). Significance was calculated using t test P = .006. Data are represented as the mean and SEM. (F) Ratio of host:donor bone marrow cells from WT (n = 4) and mice with myeloid leukemia (n = 6). Whole bone marrow was transplanted into sublethally irradiated (450 Gy) B6.SJL-Ptprca/BoyJ mice. Ratios are calculated by antibody staining of peripheral blood against CD45.1 and CD45.2 antigens at 1, 2, and 3 months after transplant (P = .043, .007, and 0.011, respectively). Data points represent the mean ratios with SEM. SEM, standard error of the mean.
Figure 2.
Figure 2.
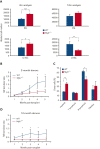
Conditional deletion of Myb at 2 or 12 months determines that the disease is HSC intrinsic. (A) Schematic depicting the Tamoxifen treatment of Myb+/+:CreERT2:mTmG (Myb+/+) and Myb+/F:CreERT2:mTmG (Myb+/F) mice at either at 2 or 12 months of age. (B) Quantitative PCR on peripheral blood genomic DNA, detecting the relative levels of Mybex5 product relative to an internal control GpIIb calculated using the ΔCT method. Values represent the mean expression plotted as 2−ΔCT with SEM (n = 10 P = .020). (C) Kaplan-Meier curve of the survival over 22 months of Myb+/+ and Myb+/F mice after Myb deletion at 2 or 12 months of age. The arrows signify the average time from Tamoxifen deletion until disease appearance. Significance was calculated using the log rank test with P = .026 and .006 for the 2– and 12–month deleted Myb, respectively. n = 10 for Myb+/+ 2- and 12-months, n = 11 for Myb+/F 2-months, n = 10 for Myb+/F 12-months. (D) Classification of myeloid disease arising in the aging cohorts of Myb-deleted mice. (E) Absolute bone marrow cell numbers based on antibody staining and total bone marrow count. n = 10 for Myb+/+ 2- and 12-months, n = 11 for Myb+/F 2-months, n = 10 for Myb+/F 2- months. Significance was calculated by t test. (i) KSL12mP = .032. (ii) MEP2mP = .052, CMP2mP =.023, CMP12mP = .014, GMP12mP = .031. (iii) Prog2mP = .052, Prog12mP = .047. (iv) Monocytes12mP = .028, (v) Granulocytes2mP = .032. CMP, common myeloid progenitor; GMP, granulocyte-monocyte progenitor; granulocytes, CD11b+Gr1+; MEP, megakaryocyte-erythroid progenitor; myeloid progenitors, Kit+ScaLin; monocytes, CD11b+Gr1; SEM, standard error of the mean.
Figure 3.
Figure 3.
Myb-deficient HSCs are compromised in their function. (A) Bone marrow absolute counts of KSL and LT-HSC (KSLCD48-CD150+) from 2- (n = 8) and 12-month-old (n = 8) WT and Myb+/− mice. KSL2mP = .0009, KSL12mP = .053, LT-HSC2mP = .013, LT-HSC12mP = .005. (B and D) Sorted KSL cells from 2- (n = 9) and 12-month-old (n = 9) WT or Myb+/− donors (carrying vWF-tdTomato transgene) plus reference bone marrow were transplanted into lethally irradiated recipients (900 Gy). Reference:donor cell ratios were calculated using flow cytometry. P2m = 0.040, 0.038 and P12m = 0.030, 0.006, 0.055. (C) Analysis of donor cell percentage in the periphery of recipient mice (n = 3) 4 months after transplant receiving 2-month-old KSL. Antibody staining gated on CD45.2 donor cells: myeloid (CD11b+), T-lymphoid (CD4+CD8a+), B-lymphoid (B220+), and platelet (vWF+). Myeloid P = .001, B-lymphoid P = .011.
Figure 4.
Figure 4.
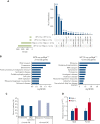
RNA-seq analysis determines key pathways that are altered by low levels of Myb. (A) UpSet plot showing the significantly (adjusted P < .10) DE genes from RNA-seq comparisons of WT and Myb+/− KSL from young (2-month) vs older (12-month) animals. Each row represents the different conditions where points to the right of the sets provide information about the intersecting sets of the different conditions. The vertical bars indicate the number of intersecting DE genes in each combination of conditions. The set size below the horizontal bars represents the number of DE genes within each set (condition). The UpSet plot was generated using Intervene (version 0.6.4). (B) KEGG pathway analysis from the comparison of 2-month-WT vs Myb+/− and 12-month-old WT and Myb+/− KSL cells. The top 10 most significant pathways are depicted based on their FDR. (C) The percentage of genes in each depicted pathway that are significantly DE in 2- and 12-month-old KSL. (D) Quantitative PCR of RNA expression in aged Myb+/+:CreERT2:mTmG and Myb+/Δ:CreERT2:mTmG sorted GFP+ KSL cells. Values represent the mean expression plotted as 2−ΔΔCT with SEM n = 3. DE, differentially expressed; FDR, false discovery rate; SEM, standard error of the mean.
Figure 5.
Figure 5.
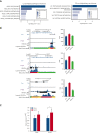
A subset of genes encoding proteostasis-associated proteins are directly regulated by Myb in both mouse HSC and a human hematopoietic progenitor line. (A) Functional enrichment of the subset of mouse Myb insufficiency–responsive genes where their human homologs are direct target genes of MYB. Results from Wikipathways (upper panel) and KEGG pathway (lower panel) are shown. (B) A subset of Myb insufficiency–responsive genes are direct target genes of MYB in K562 cells. Left panels: UCSC tracks showing MYB occupancy at the PSMB1, PSMB3, and PSMG3. In addition to the K562 ChIP-seq tracks, we incorporated H3K27Ac tracks (accession ID: ENCFF117MIF) from the MEL mouse cell line, which is described as analogous to K562 cells in the ENCODE database. To make the MEL cell line–derived H3K27Ac ChIP-seq peaks compatible with human hg19 coordinates, we used the UCSC liftOver tool before uploading it to the MYB UCSC session and visualizing the tracks using the UCSC genome browser. Right panels: expression profiles of PSMB1, PSMB3, and PSMG3, respectively, in K562 cells after small interfering RNA knockdown of MYB and rescue by the transient expression of 3✕TY1-MYB. (C) Quantitative PCR of RNA expression in Myb+/+:CreERT2:mTmG and Myb+/F:CreERT2:mTmG sorted GFP+ KSL cells 24 hours after deletion. Values represent the mean expression plotted as 2−ΔCT with SEM. n = 4 P = .047. SEM, standard error of the mean.
Figure 6.
Figure 6.
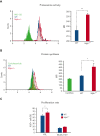
Myb deficiency affects protein production and degradation. (A) KSL cells from 2-month-old WT and Myb+/− mice were stained with Me4BodipyFL-Ahx3Leu3VS proteasome activity probe either with or without prior incubation with MG-132. MFI was calculated. n = 3, P = .007. (B) Protein synthesis was assessed in 12-month-old KSL cells from WT and Myb+/− mice, either with or without cycloheximide inhibition, using the OPP assay. MFI was calculated. n = 3, P = .016. (C) Proliferation rate of WT vs Myb+/− HSC from 2-month-old mice. Bone marrow from WT and Myb+/− mice (n = 5) were fixed and permeabilized for intracellular anti-Ki67 staining. KSL HSC and LT-HSC (KSL48-150+) cells were gated for the analysis of Ki67. Data represents the average percentage of Ki67+ cells with SEM. For KSL HSC P = .024. OPP, O-propargyl-puromycin; SEM, standard error of the mean.

Comment in

References

    1. Ermolaeva M, Neri F, Ori A, Rudolph KL. Cellular and epigenetic drivers of stem cell ageing. Nat Rev Mol Cell Biol. 2018;19(9):594–610. - PubMed
    1. Oh J, Lee YD, Wagers AJ. Stem cell aging: mechanisms, regulators and therapeutic opportunities. Nat Med. 2014;20(8):870–880. - PMC - PubMed
    1. Mead AJ, Mullally A. Myeloproliferative neoplasm stem cells. Blood. 2017;129(12):1607–1616. - PMC - PubMed
    1. Elias HK, Schinke C, Bhattacharyya S, Will B, Verma A, Steidl U. Stem cell origin of myelodysplastic syndromes. Oncogene. 2014;33(44):5139–5150. - PubMed
    1. Sudo K, Ema H, Morita Y, Nakauchi H. Age-associated characteristics of murine hematopoietic stem cells. J Exp Med. 2000;192(9):1273–1280. - PMC - PubMed

Publication types

Substances