. 2023 Feb 8;31(2):213-227.e9.
doi: 10.1016/j.chom.2022.12.009. Epub 2023 Jan 4.

Microbiota-dependent proteolysis of gluten subverts diet-mediated protection against type 1 diabetes

Affiliations

Microbiota-dependent proteolysis of gluten subverts diet-mediated protection against type 1 diabetes

Matthew C Funsten et al. Cell Host Microbe. .

Abstract

Diet and commensals can affect the development of autoimmune diseases like type 1 diabetes (T1D). However, whether dietary interventions are microbe-mediated was unclear. We found that a diet based on hydrolyzed casein (HC) as a protein source protects non-obese diabetic (NOD) mice in conventional and germ-free (GF) conditions via improvement in the physiology of insulin-producing cells to reduce autoimmune activation. The addition of gluten (a cereal protein complex associated with celiac disease) facilitates autoimmunity dependent on microbial proteolysis of gluten: T1D develops in GF animals monocolonized with Enterococcus faecalis harboring secreted gluten-digesting proteases but not in mice colonized with protease deficient bacteria. Gluten digestion by E. faecalis generates T cell-activating peptides and promotes innate immunity by enhancing macrophage reactivity to lipopolysaccharide (LPS). Gnotobiotic NOD Toll4-negative mice monocolonized with E. faecalis on an HC + gluten diet are resistant to T1D. These findings provide insights into strategies to develop dietary interventions to help protect humans against autoimmunity.

Keywords: celiac disease; diet and autoimmunity; insulin secretion regulation; microbial proteolysis of gluten; microbiota and autoimmunity; type 1 diabetes.


Conflict of interest statement

Declaration of interests The authors declare no competing interests.

Figures

Figure 1.
Figure 1.. Protection from T1D by HC diet is independent from the microbiota
(A) Type 1 diabetes (T1D) incidence in SPF female NOD mice fed regular chow, hydrolyzed casein (HC), and intact casein (IC) diets. (B) T1D in germ-free (GF) NOD mice on the same diets. (C, D) Transfer of 2x10⁷ splenocytes from pre-diabetic SPF NOD mice fed either chow or HC into NOD.scid (C) or NOD.TCRα KO (D) recipients fed regular chow (data combined from 2 experiments). (E) Transfer of 2x10⁷ splenocytes from SPF NOD mouse fed regular chow into NOD TCRα KO mice either on chow or HC diets (data combined from 2 experiments). p values in A-E were estimated using Mantel-Cox long-rank test. (F) Proliferation of CFSE-labeled BDC2.5 T cells 3 days after transfer in the pancreatic lymph nodes of recipient SPF NOD mice fed chow or HC diets (representative experiment of 3 independent experiments, three mice per group). Mean±sem. p value calculated using Student’s t test.
Figure 2.
Figure 2.. Effects of HC and HC+4%gluten diets on insulin secretion
(A, B) Intraperitoneal Glucose Tolerance Test (IPGTT) performed on 6–8-week-old NOD female mice either fed chow or HC diets shown as (A) the change of blood glucose levels after subtraction of the zero-time-point for every mouse (delta) and (B) calculation of Incremental Area Under the Curve (iAUC) for the same experiments. Combined data from 5 independent experiments, mean±sem. p values were calculated using Student’s t test. n=number of animals per group. (C, D) Test for insulin resistance – (C) blood glucose clearance in 6–8-week-old mice fed indicated diets and injected with insulin after 6 hrs fasting and (D) AUC calculated for the same experiments. Combined data from two experiments, mean±sem. p values calculated using Student’s t test. n=number of animals per group. (E, F) Distribution of relative Ins1 and Ins2 gene expression levels in β-cells from 8–10-week-old NOD.scid mice fed regular chow (blue line) or HC diet (red line). Data is based on single-cell RNA sequencing (SCS) of NOD.scid islets and is plotted as a kernel density estimation function. Dashed vertical line indicates the border between low and high expressors of insulin in islets of chow fed mice. The p values calculated by Mann-Whitney U test were 4.9x10⁻¹ and 1.4x10⁻¹⁴ for Ins 1 and Ins 2, respectively. (G) Volcano plot showing differential gene expression between Ins1-High and Ins1-Low beta cells isolated from the islets of NOD.scid mice fed regular chow. Genes indicated have adjusted p-values less than 0.05 and log2 fold change magnitude greater than 0.5. (H) Gene networks built using genes upregulated in β-cells with high insulin expression compared to β-cells with low insulin expression using STRING database . (I) Glutens from two different manufacturers were added to HC diet replacing 1/5th of hydrolyzed casein weight (or 4% of the total diet weight, thus termed ‘HC−4%gluten diet’) and T1D incidence in female NOD mice was observed in the same experiment. (J) Direct measurements of plasma insulin in NOD mice fed chow, HC, or HC+4%gluten at fasting baseline and 5 minutes after glucose challenge. Mean±sem. p values were calculated using Student’s t test. (K) Proliferation of CFSE-labeled BDC2.5 T cells in the pancreatic lymph nodes of mice on chow and HC+4%gluten diets. Mean±sem. Combined data from 2 experiments, p value was calculated using Student’s t test.
Figure 3.
Figure 3.. Gluten promotes immune activation in pancreatic islets.
(A) Uniform Manifold Approximation and Projection (UMAP) dimension reduction plots of islet cells from 15-week-old NOD mice on indicated diets (SCS analysis, pool of 3 mice per group). (B) Ratios of α-, β-, and δ-cells in the islets of HC− and HC + 4%gluten-fed NOD mice defined by SCS. (C) Gene Set Enrichment Analysis (GSEA) showing enrichment of hallmark TNFα signaling via NFκB in β-cells from HC+4%gluten fed NOD islets. FDR q value <0.05. (D) Volcano plot showing differential gene expression between myeloid cells from islets of HC and HC+4%gluten fed NOD mice. Genes indicated have adjusted p values less than 0.05 and log2 fold change magnitude greater than 0.5. (E) Quantification of CD86 expression by dendritic cells (CD45+ CD11c+ F4/80) in the islets of HC and HC+4%gluten fed NOD mice. Data combined from 6 experiments. Mean±sem. p value was calculated using Student’s t test. (F) Quantification of Ki67 expression in αβ T cells (CD45+, CD11c, F4/80, CD19+, TCRβ+) from the islets of HC and HC+4%gluten fed NOD mice. Data combined from 6 experiments. Mean±sem. p value was calculated using Student’s t test. (G) Quantification of CD103 expression in Tregs (CD45+, CD11c, F4/80, CD19, TCRβ+, CD4+, FoxP3+) from the islets of HC and HC+4%gluten fed NOD mice. Data combined from 6 experiments. Mean±sem. p value was calculated using Student’s t test. (H) Distribution of expanded CDR3α sequences and clonal sizes in islet infiltrates from mice on HC (blue background) and HC+4%Gluten (orange background) diets from single cell sequenced CD8+ cells (three mice per diet). The abscissa represents the size of expanded clonotypes and the ordinate represents the % of individual clonotype of total sequenced CD8+ cells. Individual CDR3α sequences are represented by different colors. (I) The number of expanded cells from each clonotype (≥3 cells with identical TCRs) derived from expanded CDR3α sequences from CD8+ cells in the islets of HC (blue) and HC+4%Gluten (orange) fed mice. CDR3α identical and visibly similar to NY8.3 are highlighted with a red rectangle. (J) Network of clonotype clusters derived from pairwise sequence alignment of CDR3α sequences for CD8+ cells. Each circle represents a unique CDR3α sequence and the size of the circle is proportional to the size of the clone. Dashed lines represent clusters of sequences whose distance was within a similarity score of 5 based on BLOSUM62 scoring. Clonotypes carrying CDR3α identical or similar to NY8.3 are highlighted with a red line. (K) The frequency of CD8+ T cells producing IFN-γ in response to NRPA7 mimic peptide recognized by the diabetogenic clone NY8.3 in the PLN from HC fed and HC+4%gluten fed NOD mice. Each point is an average of 3 technical replicates per mouse. Mean±sem. Data are combined from 3 experiments. p values calculated using Student’s t test.
Figure 4
Figure 4. Enhancement of autoimmunity by gluten requires the microbiota
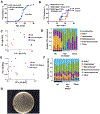
(A) Comparison of T1D incidence in GF mice fed chow or HC+4%gluten diet. n=number of animals per group. p value was estimated using Mantel-Cox long-rank test. n = number of animals per group. (B) T1D development in TGM2-deficient mice fed either chow or HC+4%gluten diets at The University of Chicago, p value was estimated using Mantel-Cox long-rank test. n = number of animals per group. (C), Principal Component Analysis of the small intestine (SI) microbiota of ex-GF mice simultaneously colonized with a single source of SPF NOD microbiota 8 weeks prior. (D) Relative abundance of the top Operational Taxonomic Units (OTUs) in the SI microbiota of ex-GF mice fed indicated diets. (E) Principal Component Analysis of the cecal microbiota of ex-GF mice simultaneously colonized with a single source of SPF NOD microbiota 8 weeks prior. (F) Relative abundance of the top Operational Taxonomic Units (OTUs) in the cecal microbiota of ex-GF mice fed indicated diets. (G) Some bacteria from the small intestine of a NOD mouse plated on brain heart infusion (BHI) agar containing gliadin secrete proteases leaving transparent halos around colonies.
Figure 5
Figure 5. Gluten proteolysis by bacteria leads to activation of adaptive and innate immunity.
(A) Gluten digest by E. faecalis activates 578_BV7_AV12 (.578) T cells specific for glia-ω2 peptide/HLA-DQ2.5 but does not activate an independent T cell TCC489.2.14 (.489) specific for gliadin alpha1 peptide/HLA-DQ8 complex. Both T cells were readily activated by their cognate peptides. Mean±sem. Representative of two experiments. (B) Digestion of gliadin by the wild-type E. faecalis strain OG1RF (left) and lack of digestion by ΔfsrB mutant TX5266 (right). (C) IL-2 production by the .578 T cells in the presence of HLA-DQ2.5+ antigen-presenting cells and gluten digests performed overnight by indicated bacteria or by cell-free supernatants (sup) from the same bacteria. Mean±sem from a representative experiment out of 5 independent experiments. (D) IL-2 production by the same T cells in the presence of APC and gluten digests produced by wild-type E. faecalis or mutant gelE-negative mutant TX5264 transformed with an empty control plasmid or a plasmid carrying gelE gene under nisin-sensitive promoter. Mean±sem from one out of 2 independent experiments. (E) Production of TNF by peritoneal macrophages stimulated for 6 hrs with 10% (v/v) gluten digests by wild-type E. faecalis or protease-negative mutants, mean±sem. p values calculated using one-way ANOVA with post-hoc Tukey test, n – number of experiments per condition. (F) IL-6 production by macrophages after overnight stimulation with gluten digests by E. faecalis or protease-negative mutants, mean±sem. p values calculated using one-way ANOVA with post-hoc Tukey test. n – number of experiments per condition. (G) Comparison of TNF-eliciting activity of gluten digests performed by the wild-type E. faecalis strain and by sprE TX5243 or gelE TX5264 mutant strains. Combined results from 5 independent digestions tested independently 2 times. For each batch, TNF levels produced by macrophage incubation with gluten digest by protease-negative JRC105Δ(gelE−sprE) mutant was subtracted to account for digestion by intracellular proteases from dead bacteria in the culture. mean±sem. p values calculated using one-way ANOVA with post-hoc Tukey test.
Figure 6
Figure 6. Digestion of gluten by bacterial proteases enhances LPS-triggered production of inflammatory cytokines by macrophages.
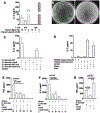
(A) Gluten digests in DMEM by E.faecalis were heated at 85°C for 30 minutes before adding to macrophages. mean±sem. p values calculated using Student’s t test. n – number of experiments per condition. (B) Same gluten digests were treated with 0.05% Trypsin overnight at 37°C. Mean±sem. p values calculated using Student’s t test, n – number of experiments per condition. (C), Gluten digests were either left untreated or treated with Polymyxin B beads overnight at 4°C. Polymyxin B activity was controlled by simultaneous treatment of LPS (at final concentration of 1 ng/ml). Mean±sem. p values calculated using Student’s t test, n – number of experiments per condition. (D) Stimulation of wild-type NOD and NOD.MyD88 KO or NOD.TLR4 KO macrophages with gluten digested by E. faecalis. mean±sem. p values calculated using one-way ANOVA with post-hoc Tukey test. Data are from a representative experiment of 4 independent experiments. (E) Suboptimal dose of LPS (representative experiment of 6 independent experiments, black line) was mixed with undigested gluten (green lines) or E. faecalis digest of gluten (red line) and added to macrophages for 6 hours stimulation. Mean±sem. (F) Bacteria from SI of NOD mouse on HC+4% gluten diet were selected based on either digestion of gliadin or growth on minimal medium with added gluten. TNF secretion by NOD WT or NOD.TLR4 KO macrophages induced with digests by indicated bacteria grown in DMEM with or without gluten. Mean±sem. Representative experiment of three independent experiments.
Figure 7
Figure 7. Gluten digestion by secreted microbial proteases is key to T1D promotion.
(A) T1D incidence in GF and gnotobiotic mice colonized with either wild-type E. faecalis or mutant bacteria incapable of making secreted proteases and fed with HC+4%gluten diet, p values were estimated using Mantel-Cox long-rank test. (B) Proportion (%) of gliadin-digesting bacteria in the small intestines of ex-GF mice monocolonized with the wild-type E. faecalis bacteria at the time of diabetes development or at 30-week endpoint if mice stayed diabetes-free, mean±sem. p value was calculated using Student’s t test. Points represent individual animals. (C) Comparison of T1D incidence in gnotobiotic wild-type NOD mice of NOD mice lacking TLR4 colonized with E. faecalis and fed with HC+4%gluten diet, p values were estimated using Mantel-Cox long-rank test.

References

    1. Bach JF (2018). The hygiene hypothesis in autoimmunity: the role of pathogens and commensals. Nat Rev Immunol 18, 105–120. 10.1038/nri.2017.111. - DOI - PubMed
    1. Norris JM, Johnson RK, and Stene LC (2020). Type 1 diabetes-early life origins and changing epidemiology. Lancet Diabetes Endocrinol 8, 226–238. 10.1016/S2213-8587(19)30412-7. - DOI - PMC - PubMed
    1. Knip M, and Siljander H (2016). The role of the intestinal microbiota in type 1 diabetes mellitus. Nat Rev Endocrinol 12, 154–167. 10.1038/nrendo.2015.218. - DOI - PubMed
    1. Lefebvre DE, Powell KL, Strom A, and Scott FW (2006). Dietary proteins as environmental modifiers of type 1 diabetes mellitus. Annu Rev Nutr 26, 175–202. 10.1146/annurev.nutr.26.061505.111206. - DOI - PubMed
    1. Scott FW (1996). Food-induced type 1 diabetes in the BB rat. Diabetes Metab Rev 12, 341–359. 10.1002/(SICI)1099-0895(199612)12:4<341::AID-DMR173>3.0.CO;2-O. - DOI - PubMed