. 2023 Feb 1;34(2):264-272.
doi: 10.1021/jasms.2c00281. Epub 2023 Jan 5.

Novel Hybrid Quadrupole-Multireflecting Time-of-Flight Mass Spectrometry System

Affiliations

Novel Hybrid Quadrupole-Multireflecting Time-of-Flight Mass Spectrometry System

Dale A Cooper-Shepherd et al. J Am Soc Mass Spectrom. .

Abstract

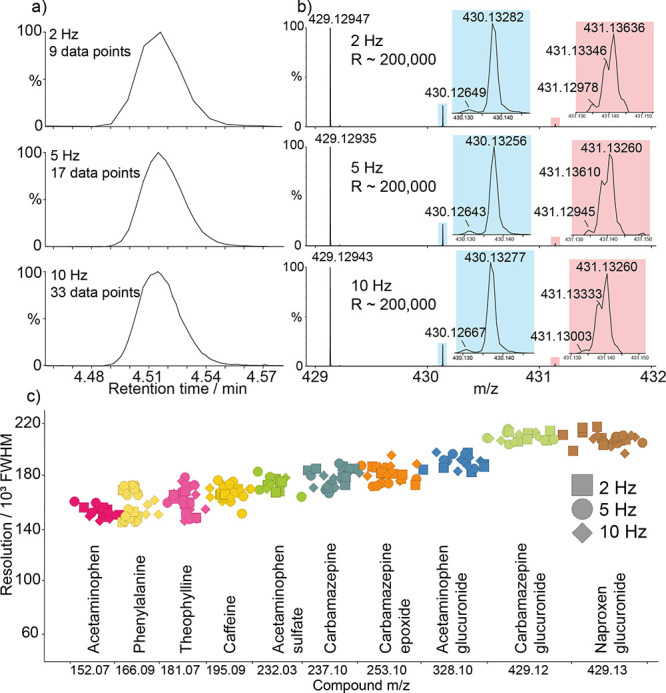
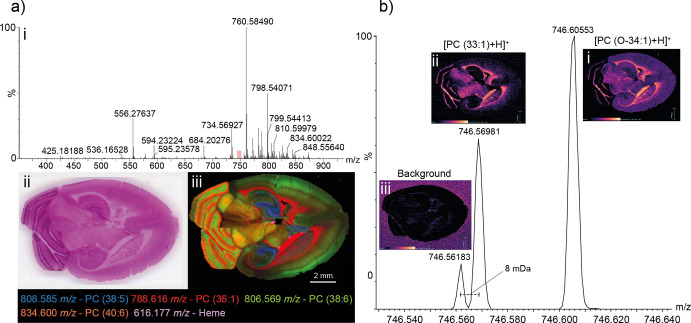
A novel mass spectrometry system is described here comprising a quadrupole-multireflecting time-of-flight design. The new multireflecting time-of-flight analyzer has an effective path length of 48 m and employs planar, gridless ion mirrors providing fourth-order energy focusing resulting in resolving power over 200 000 fwhm and sub-ppm mass accuracy. We show how these attributes are maintained with relatively fast acquisition speeds, setting the system apart from other high resolution mass spectrometers. We have integrated this new system into both liquid chromatography-mass spectrometry and mass spectrometry imaging workflows to demonstrate how the instrument characteristics are of benefit to these applications.


Conflict of interest statement

The authors declare the following competing financial interest(s): All authors except A.V. and J.B.H. are employed by Waters Corporation who manufacture and sell mass spectrometers incorporating the technology described above. A.V. is the founder of MSC-CG Ltd. who helped develop the multireflecting time-of-flight technology presented above. StepWave, UPLC, ACQUITY, BEH, HDI, High Definition Mass Spectrometry, Masslynx, MassPREP, and UNIFI are trademarks of Waters Technologies Corporation. Encoded Frequent Pushing is a trademark of LECO Corporation.

Figures

Figure 1
Figure 1
Three common TOF geometries. The “V” ion trajectory consists of four passes through mirror grids yielding optimal sensitivity-resolving power performance. In the “N” and “W” ion trajectories, resolving power is improved, but the number of grid passes (8 and 12, respectively) can affect overall sensitivity.
Figure 2
Figure 2
Schematic of the quadrupole-MRT instrument and the MRT analyzer. (a) The overall instrument design is “Q-TOF-like” with ions introduced in the source being focused onto the main axis via a StepWave ion guide and through a quadrupole followed by a segmented quadrupole collision cell. (b) Ions from the focusing optics are (1) pushed downward (−X) so that the combination of the push voltage and the ion’s +Y velocity results in a trajectory of 6° from vertical (X axis) . The mirrors are inclined in X at 3°, so the ion path is further rotated, at (2), with a retarding field in Y. This aligns the X path rotation with the center line of the mirrors. The ions are then deflected in Z, at (3), which provides the drift across the mirrors. After each reflection in X, the ions pass through a periodic lens, which compensates for beam expansion in Z. (c) The element P1 defines the ion beam angle into the mirrors, and P23 is arranged so that it reflects the ion beam back into the mirrors, which has the effect of doubling the flight length compared with positioning the detector at P23. In this arrangement, the effective flight length is ∼48 m. P1 can be operated independently to shorten the flight path (Figure S1).
Figure 3
Figure 3
Energy focusing in the MRT analyzer. (a) Fourth-order energy focusing on the MRT enables a wide energy acceptance to facilitate high resolution separations. Ions with energies of 6600 to 7040 eV have flight times over a very narrow range of 1.5 ns (blue highlights). (b) Top: The MRT mirror potentials. From the drift potential, ions are accelerated into the mirror by potential V5. Potentials V4–V2 act to reflect the ion packets back through the mirror with V1 acting to better shape the reflecting potentials near the turning point. Bottom: Both mirror potential series can be observed in the context of the entire analyzer with the central periodic lenses visible between them.
Figure 4
Figure 4
Characterizing resolving power. (a) The MRT analyzer exhibits resolving powers of greater than 200 000 (fwhm). (b) An LC-mass spectrum of sulfadimethoxine showing the fine isotope structure of the A+2 signal. (c) The MRT analyzer can distinguish the 6.3 mDa difference between the fine isotope signals of 13C and 15N up to approximately 900 m/z as shown here for clusters of arginine.
Figure 5
Figure 5
Resolving power at LC-MS speeds. (a) Extracted ion chromatograms for carbamazepine-O-glucuronide metabolite, illustrating the chromatographic integrity obtained at 2, 5, and 10 Hz. (b) Mass spectra of carbamazepine-O-glucuronide at 2, 5, and 10 Hz. Insets highlight the fine isotope structure of the A+1 (blue) signal with resolved 12C211H2114N115N116O8 and 12C2013C11H2114N216O8 and A+2 (red) signals showing partially resolved 12C2013C11H2114N115N116O8, 12C211H2114N216O718O1, 12C1913C21H2114N216O8, and 12C2013C11H202H114N216O8 (all in increasing mass order) maintained at all speeds. (c) Plot of resolving power for urinary endogenous phenylalanine and xenobiotic compounds with detected metabolites acquired at 2 Hz (squares), 5 Hz (circles), and 10 Hz (diamonds).
Figure 6
Figure 6
DESI-MSI analysis of murine brain. (a) A representative DESI mass spectrum (i) obtained as part of an MSI experiment on the murine brain. The lipid envelope is observed between 700 and 900 m/z. The murine brain section, shown as an H and E stained optical image (ii) was imaged in its entirety. A selection of identified species is shown in an overlaid molecular image (iii). Signals correspond to putative identifications of PC (38:5) (808.58542 m/z, blue, 420 ppb), PC (36:1) (788.61609 m/z, red, −370 ppb), PC (38:6) (806.56909 m/z, green, −423 ppb), PC (40:6) (834.60034 m/z, coral, 469 ppb), and Heme (616.17682 m/z, violet, 101 ppb). (b) Demonstration of the power of the high resolution MRT for imaging. A lipid signal corresponding to PC (33:1) is well-resolved from nearby lipid species but also from interfering background. On a lower resolution system, the background would interfere with the PC (33:1) signal yielding a composite image.

References

    1. Wiley W. C.; McLaren I. H. Time-of-Flight Mass Spectrometer with Improved Resolution. Rev. Sci. Instrum. 1955, 26 (12), 1150–1157. 10.1063/1.1715212. - DOI
    1. Cotter R. J.Time-of-Flight Mass Spectrometry: Instrumentation and Applications in Biological Research; American Chemical Society, 1997.
    1. Vestal M.; Li L.; Dobrinskikh E.; Shi Y.; Wang B.; Shi X.; Li S.; Vestal C.; Parker K. Rapid MALDI-TOF Molecular Imaging: Instrument Enhancements and Their Practical Consequences. Journal of Mass Spectrometry 2020, 55 (8), e442310.1002/jms.4423. - DOI - PubMed
    1. Willis P.; Jaloszynski J.; Artaev V. Improving Duty Cycle in the Folded Flight Path High-Resolution Time-of-Flight Mass Spectrometer. Int. J. Mass Spectrom. 2021, 459, 11646710.1016/j.ijms.2020.116467. - DOI
    1. Plumb R. S.; McDonald T.; Rainville P. D.; Hill J.; Gethings L. A.; Johnson K. A.; Wilson I. D. High-Throughput UHPLC/MS/MS-Based Metabolic Profiling Using a Vacuum Jacketed Column. Anal. Chem. 2021, 93 (30), 10644–10652. 10.1021/acs.analchem.1c01982. - DOI - PubMed