. 2023 Feb 8;43(6):902-917.
doi: 10.1523/JNEUROSCI.2552-21.2022. Epub 2023 Jan 5.

Muscarinic Acetylcholine Receptors Modulate HCN Channel Properties in Vestibular Ganglion Neurons

Affiliations

Muscarinic Acetylcholine Receptors Modulate HCN Channel Properties in Vestibular Ganglion Neurons

Daniel Bronson et al. J Neurosci. .

Abstract

Efferent modulation of vestibular afferent excitability is linked to muscarinic signaling cascades that close low-voltage-gated potassium channels (i.e., KCNQ). Here, we show that muscarinic signaling cascades also depolarize the activation range of hyperpolarization-activated cyclic-nucleotide gated (HCN) channels. We compared the voltage activation range and kinetics of HCN channels and induced firing patterns before and after administering the muscarinic acetylcholine receptor (mAChR) agonist oxotremorine-M (Oxo-M) in dissociated vestibular ganglion neurons (VGNs) from rats of either sex using perforated whole-cell patch-clamp methods. Oxo-M depolarized HCN channels' half-activation voltage (V 1/2) and sped up the rate of activation near resting potential twofold. HCN channels in large-diameter and/or transient firing VGN (putative cell bodies of irregular firing neuron from central epithelial zones) had relatively depolarized V 1/2 in control solution and were less sensitive to mAChR activation than those found in small-diameter VGN with sustained firing patterns (putatively belonging to regular firing afferents). The impact of mAChR on HCN channels is not a direct consequence of closing KCNQ channels since pretreating the cells with Linopirdine, a KCNQ channel blocker, did not prevent HCN channel depolarization by Oxo-M. Efferent signaling promoted ion channel configurations that were favorable to highly regular spiking in some VGN, but not others. This is consistent with previous observations that low-voltage gated potassium currents in VGN are conducted by mAChR agonist-sensitive and -insensitive channels. Connecting efferent signaling to HCN channels is significant because of the channel's impact on spike-timing regularity and nonchemical transmission between Type I hair cells and vestibular afferents.SIGNIFICANCE STATEMENT Vestibular afferents express a diverse complement of ion channels. In vitro studies identified low-voltage activated potassium channels and hyperpolarization-activated cyclic-nucleotide gated (HCN) channels as crucial for shaping the timing and sensitivity of afferent responses. Moreover, a network of acetylcholine-releasing efferent neurons controls afferent excitability by closing a subgroup of low-voltage activated potassium channels on the afferent neuron. This work shows that these efferent signaling cascades also enhance the activation of HCN channels by depolarizing their voltage activation range. The size of this effect varies depending on the endogenous properties of the HCN channel and on cell type (as determined by discharge patterns and cell size). Simultaneously controlling two ion-channel groups gives the vestibular efferent system exquisite control over afferent neuron activity.

Keywords: HCN channels; KCNQ channels; efferent neurons; modulation; muscarinic acetylcholine receptors; vestibular ganglion.


Figures

Figure 1.
Figure 1.
VGNs have HCN channels with diverse voltage-gated activation properties. A, Currents activated from voltage steps from −130 to −70 mV in a single cell. A single-exponential fit in blue is overlaid on the current response to each conditioning step (example exponential fit is shown in blue). B, IH activation measured as the magnitude of the tail current (arrowhead in A, top) as a function of the conditioning voltage step (arrowhead in A, bottom). IH activation curves were fit by Boltzmann function from Equation 1 (dotted curve). C, Current density of IH varied from 2.1 to 23.6 pA/pF. There was no relationship between current density and age of animal. D, IH activation curves fit by Boltzmann function were normalized to the maximum conductance of IH. Gray curves represent the activation curves measured in 47 cells. Bold curve represents the activation curve for cell shown in A and B. E, The half-activation voltage (V1/2) of IH varied from −109.5 to −76.4 mV. Like current density, V1/2 was not related to age. F, Current responses were fit with an exponential line (exponential fit of current response to −130 mV step is shown in blue in A). The time constant τ from the exponential fits of the cell shown in A is plotted with the voltage step on the x axis. A single-parameter exponential described in Equation 2 was used to fit the τ value/voltage relationship in this cell (dotted line). Point labeled with X was excluded from fitting since it exceeded the duration of the stimulus (1.7 s). G, Fits of the τ value/voltage relationship for each cell. Points and lines are color-coded according to the V1/2 of each individual cell, with the most depolarized V1/2 values in red and the most hyperpolarized V1/2 values in blue. H, The α parameter, which describes the steepness of the fits in IH activation rate, is shown for each cell plotted against the V1/2 of IH. I, Tail currents from a single neuron assessed at three different time points using the perforated patch technique. J, Tail currents from a different single neuron assessed at two different time points using the rupture patch technique. K, Shift in the half-activation voltage of IH (V1/2) after short (10-20 min) and long (21-40) intervals in perforated patch and rupture patch recording conditions. In rupture-patch recording conditions, V1/2 hyperpolarized over time (p = 0.0006, n = 4, Tukey–Kramer HSD).
Figure 2.
Figure 2.
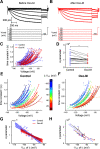
Activation of mAChRs depolarizes the voltage activation range of IH. A, Currents activated from voltage steps from −140 to −60 mV in a single before and after Oxo-M (A1,A2) and in a single cell in control, linopirdine, and linopirdine and Oxo-M conditions (B1,B2,B3). C–E, Data from the individual neuron shown in A. F–H, The neuron from B. C, IH activation curves were fit by a Boltzmann function before (light gray squares) and after Oxo-M (black triangles). D, The fractional activation of IH plotted as a function of the conditioning voltage step. E, Each point represents a single V1/2 measurement with lines connecting each cell before (square) and after Oxo-M (triangle). The average shift of all cells is drawn in bold. V1/2 in 11 of 12 neurons shifted in the depolarized direction (*p = 0.0015, paired t test). F, IH activation curves were fit by Boltzmann function in control (light gray squares), linopirdine (dark gray circles), and after Oxo-M (black triangles). G, The fractional activation of IH plotted as a function of the conditioning voltage step. H, Each point represents a single V1/2 measurement at baseline (square), after linopirdine (circle), and then after administration of both linopirdine and Oxo-M (triangle). The average shift of all cells is drawn in bold. Linopirdine had no effect on V1/2, while the cocktail containing linopirdine and Oxo-M shifted the activation range in the depolarizing direction (*p = 0.0236, Tukey's HSD).
Figure 3.
Figure 3.
mAChR agonists increase the rate of HCN channel activation. A, B, Currents activated from voltage steps from −130 to −70 mV in a single cell in control solution (A, black) and in Oxo-M (B, red). C, The time constant τ derived from fits to whole-cell currents is plotted as a function of the command voltage step (V). A single-parameter exponential described in Equation 2 was used to fit the τ(V) for each cell. τ(V) recorded in the control condition is shown in blue lines and squares. Cells from the Oxo-M condition are shown in red lines and triangles. D, α from Equation 2 is plotted for each cell before (blue squares) and after Oxo-M (red triangles). Thin lines connect individual cells. Bold line indicates the mean difference in α. Oxo-M increased the activation rate of IH as indicated by the reduction in α (*p = 0.0236). E, τ(V) in control solution. F, τ(V) in Oxo-M. Points and lines are color-coded according to V1/2, with the most depolarized V1/2 values in red and the most hyperpolarized V1/2 values in blue. G, α values plotted against the V1/2 of each cell on the x axis in control (blue squares) and Oxo-M (red triangles) conditions. Straight lines indicate linear regression, and 95% CI estimates of control and Oxo-M groups in black and red, respectively. H, α and V1/2 measurement pairs from 14 individual cells tested before (blue squares) and after (red triangles) Oxo-M administration. Arrows are drawn between two data points in each cell. Linear regressions from G are shown in dotted lines in H.
Figure 4.
Figure 4.
Vestibular ganglion neurons are heterogeneous with different firing patterns in response to depolarizing current steps. Large hyperpolarizing current steps produce a voltage sag (arrow) driven by the hyperpolarization-activated mixed cationic current (IH). Scale bars are consistent throughout all traces. Depolarizing current steps are the closest 20 pA current step to threshold in each trace. A1, Transient firing neurons fire a single action potential at the onset of suprathreshold depolarizing current steps. The amplitude of the positive current step necessary to reach threshold is shown below each trace. Dashed line indicates −60 mV. A2, Size distribution of transient firing neurons was measured from Cm. B1, Sustained-A neurons fire continuously throughout the current step. B2, Size distribution of sustained-A firing neurons. C1, Sustained-B neurons fire multiple action potentials after the onset of the depolarizing current steps and are rapidly adapting. C2, Size distribution of sustained-B firing patterns. D1, Sustained-C neurons fire a single action potential followed by voltage oscillations. D2, Size distribution of sustained-C neurons. E, Top, Firing patterns in all cells (n = 81) plotted against age in postnatal days. Transients are shown as blue triangles (n = 40), sustained-A as gray asterisks (n = 5), sustained-B as red squares (n = 26), and sustained-C as green circles. Cells aged P15 ± 1 d are represented as empty shapes, while points from all other ages are filled in. Bottom, Size distribution overlaid with two Gaussian distributions fit to each peak. The two distributions intersect at 26 pF. F1, Firing pattern of all 81 cells according to their age in postnatal days. Gray area highlights the postnatal day 15 shown in F2. F2, Size distribution of cells recorded at exactly 15 d of age.
Figure 5.
Figure 5.
Heterogeneity of IH activation properties as a function of firing pattern and cell size. A, Currents activated from voltage steps from −135 to −60 mV followed by a −100 mV tail step from four representative different neurons with different firing patterns. B, C, Data from the individual neurons shown in A. A large transient firing neuron is shown in A1, sustained-A firing neuron in A2, sustained-B firing neuron in A3, and sustained-C firing neuron in A4. The sustained-A example shown in A2 is the only cell in this group. In the same neurons, (B) tail currents and (C) IH activation curves fit by Boltzmann function and normalized to the maximum conductance of IH are shown. D, Violin plots and individual data points on a normal distribution of V1/2 of IH in each firing pattern group are shown. Cells aged 15 ± 1 d are indicated as empty shapes. V1/2 is more depolarized in transient firing neurons than sustained-B neurons (*p = 0.0213, Steel–Dwass method) and sustained-C neurons (*p = 0.0013). Cells in which the V1/2 of IH was positive of −95 mV were designated as HCN-depolarized (gold area of graph), and cells with IH activation ranges more negative than −95 mV were grouped as HCN-hyperpolarized (gray area of graph). E, Distribution of V1/2 values in all 47 cells. The two peaks of the distribution were fit with separate normal distributions. The two distributions intersect at −91.5 mV. Cells with V1/2 more hyperpolarized than −91.5 mV are colored in gray, and cells with V1/2 more depolarized than −91.5 mV are colored in gold. F, V1/2 is shown plotted against cell size (Capacitance). Firing patterns are represented by shapes shown in D. Cells above dashed line were classified as HCN-depolarized, and cells below dashed line were HCN-hyperpolarized. G, Cm distribution in transient firing (top) and sustained-A, -B, and -C firing (bottom) cells. The number of cells classified as HCN-depolarized is shown in the histogram in gold, while cells defined as HCN-hyperpolarized are shown in gray. H, A single exponential was fit to each conditioning step from −135 to −60 mV from cells in each firing pattern, and the time constant τ from each step is plotted as a function of voltage. Cells with transient firing patterns are shown in blue triangles, sustained-A in gray asterisks, sustained-B in red squares, and sustained-C in green circles. I, τ constant in all cells is shown as either HCN-depolarized (gold line and circles, n = 13, 9 of which were age P15 ± 1 d) or HCN-hyperpolarized (gray line and circles, n = 34, 21 of which were age P15 ± 1 d).
Figure 6.
Figure 6.
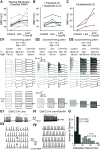
Heterogeneity in the impact of activation mAchR on firing patterns. A, RMP is plotted for each cell before, after linopirdine, and after linopirdine and Oxo-M. Thin lines connect individual cells. Bold line and data points indicate the average change RMP in each condition. B, RMP in each condition for transient (blue triangles) and sustained-C (green circles) firing cells only. C, RMP in each condition for cells with sustained-B firing patterns (red squares). D1, Large transient firing cell that saw no change in firing pattern despite a moderate positive shift in IH activation range. D2, Sustained-B with moderate effect. D3, Sustained-B with large effect. Voltage response are shown in a stacked array separated by 10 mV. Dashed horizontal line drawn at −60 mV in all three cells. Traces are shown at baseline control (light gray), after linopirdine (dark gray), and after linopirdine and Oxo-M (black). The cell in D3 was held at −59 mV in both lino and lino+oxo conditions. E1, The cell shown in D3 fired spontaneously following linopirdine administration. Cell was not spontaneously active in the control condition. Blue bars above the trace represent the period in which firing pattern regularity was assessed in E2. Although the spontaneous activity is concatenated into a single trace, there was a 1 s delay between sweeps that is represented by the blue bars. E2, The spontaneous activity shown in E1 is shown with each line indicating a separate trace. Note the presence of spike failure as indicated by the black arrows. RMP in control condition is shown as a dotted horizontal line. F1, The cell shown in D3 also fired spontaneously following administration of linopirdine and Oxo-M. The period of spontaneous activity was continuous and lacked periods of quiescence. F2, The spontaneous activity shown in F1 is shown with each line indicating a separate sweep. Note the reduction in spike failure and the increase in the regularity of spikes after Oxo-M is added to the bath. G, The spontaneous activity shown in E and F was used to construct a histogram for each interspike interval following linopirdine (light gray) as well as linopirdine and Oxo-M (dark gray). The variability of the interspike interval of the spontaneous activity was reduced following linopirdine and Oxo-M compared with linopirdine alone. This increase in regularity is reflected in the decrease in coefficient of variability (CV) from 0.33 after Lino to 0.06 after Lino+Oxo.
Figure 7.
Figure 7.
Small size and sustained firing patterns are associated with increased sensitivity to IH modulation. A, V1/2 shown plotted against cell size in control and Oxo-M conditions. Straight lines indicate linear regression, and 95% CI estimates of control and Oxo-M groups in blue and red, respectively. B, V1/2 and Cm measurement pairs from 21 individual cells tested before (blue) and after (red) Oxo-M administration. Arrows are drawn between two data points in each cell. Linear regressions from A are shown in dotted lines in B. C, Left, Line series are shown with each point representing a single V1/2 measurement at baseline and after Oxo-M was added to the bath in 21 cells. Lines and points are color-coded according to firing pattern with transients (blue lines and triangles), sustained-C (green lines and circles), and sustained-B (red lines and squares) shown. Cells at 15 ± 1 d are shown as empty shapes. Right, The size of the Oxo-M-induced shift in V1/2 is shown in transient firing cells (blue triangles), sustained-B (red squares), and sustained-C (green circles). Oxo-M shifted V1/2 more in sustained-B cells significantly more compared with both sustained-C (p = 0.0397, Tukey's HSD) and transient firing cells (p = 0.0053).

Similar articles

Cited by

References

    1. Almanza A, Luis E, Mercado F, Vega R, Soto E (2012) Molecular identity, ontogeny, and cAMP modulation of the hyperpolarization-activated current in vestibular ganglion neurons. J Neurophysiol 108:2264–2275. 10.1152/jn.00337.2012 - DOI - PubMed
    1. Altomare C, Terragni B, Brioschi C, Milanesi R, Pagliuca C, Viscomi C, Moroni A, Baruscotti M, DiFrancesco D (2003) Heteromeric HCN1–HCN4 channels: a comparison with native pacemaker channels from the rabbit sinoatrial node. J Physiol 549:347–359. 10.1113/jphysiol.2002.027698 - DOI - PMC - PubMed
    1. Barry PH (1994) JPCalc, a software package for calculating liquid junction potential corrections in patch-clamp, intracellular, epithelial and bilayer measurements and for correcting junction potential measurements. J Neurosci Methods 51:107–116. 10.1016/0165-0270(94)90031-0 - DOI - PubMed
    1. Biel M, Wahl-Schott C, Michalakis S, Zong X (2009) Hyperpolarization-activated cation channels: from genes to function. Physiol Rev 89:847–885. 10.1152/physrev.00029.2008 - DOI - PubMed
    1. Brown DA (2010) Muscarinic acetylcholine receptors (mAChRs) in the nervous system: some functions and mechanisms. J Mol Neurosci 41:340–346. 10.1007/s12031-010-9377-2 - DOI - PubMed

Publication types

MeSH terms

LinkOut - more resources