. 2023 Jan 5;14(1):5.
doi: 10.1038/s41419-022-05538-6.

Targeting tumor-stroma communication by blocking endothelin-1 receptors sensitizes high-grade serous ovarian cancer to PARP inhibition

Affiliations

Targeting tumor-stroma communication by blocking endothelin-1 receptors sensitizes high-grade serous ovarian cancer to PARP inhibition

Piera Tocci et al. Cell Death Dis. .

Abstract

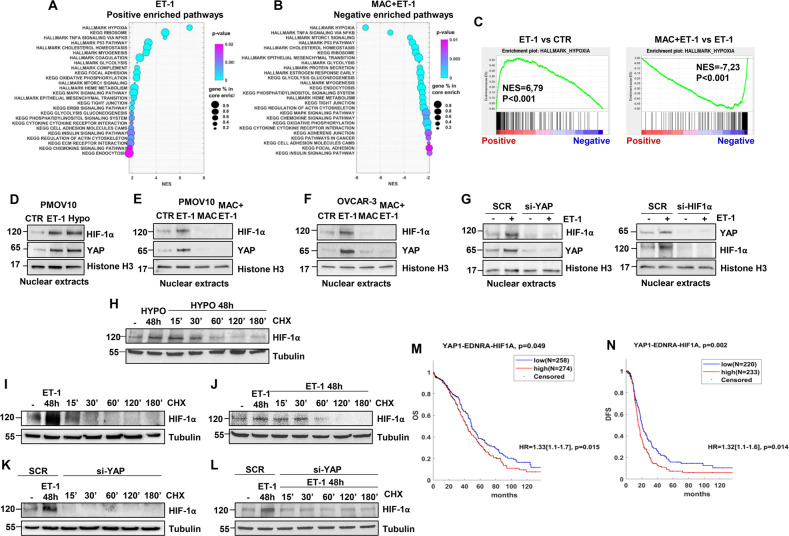
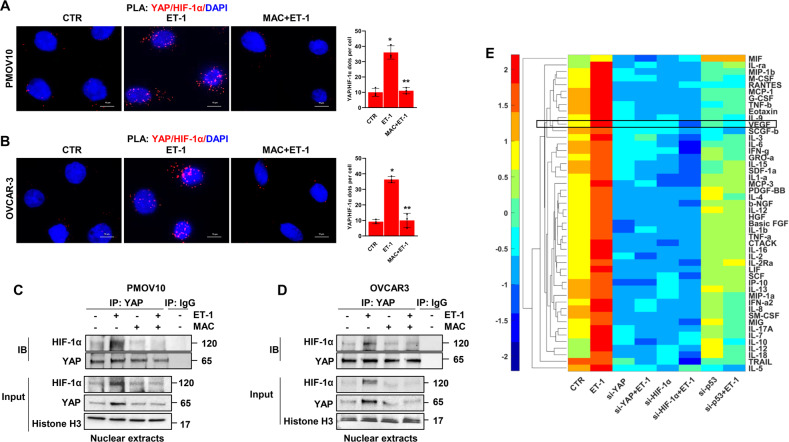
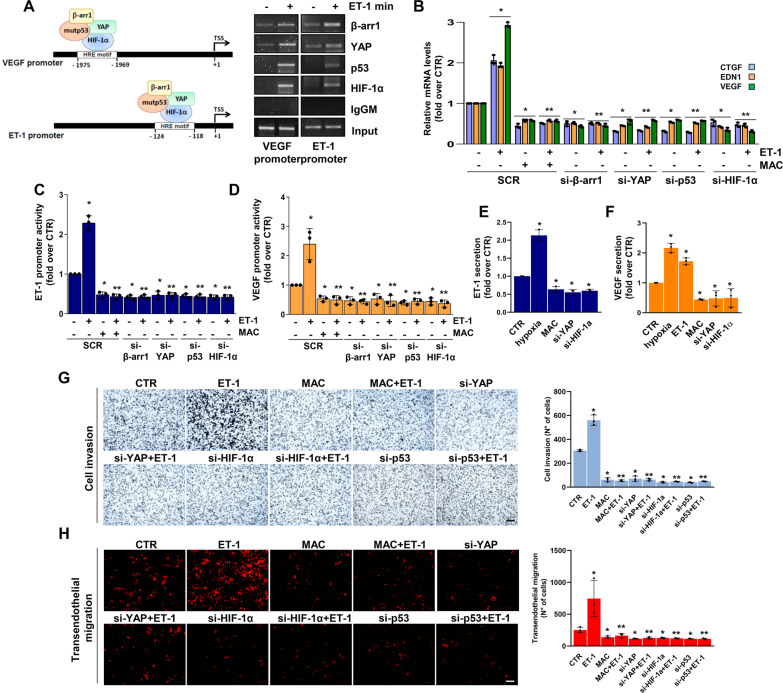
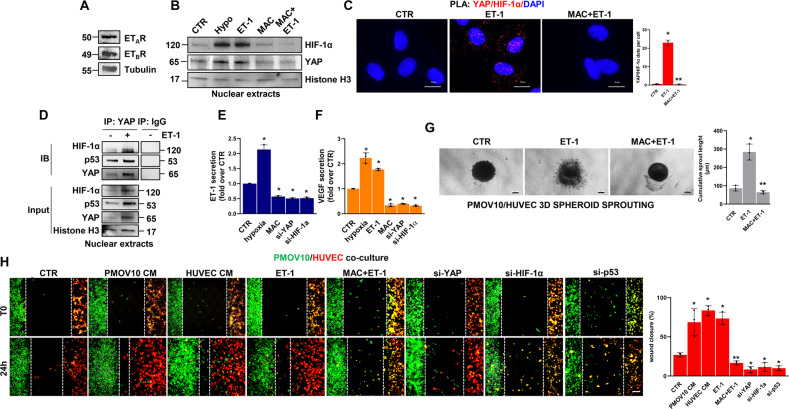
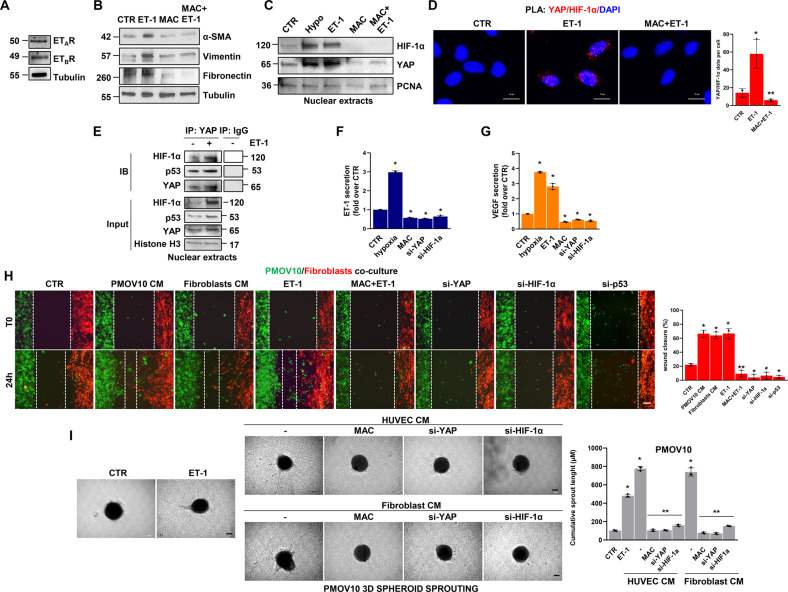
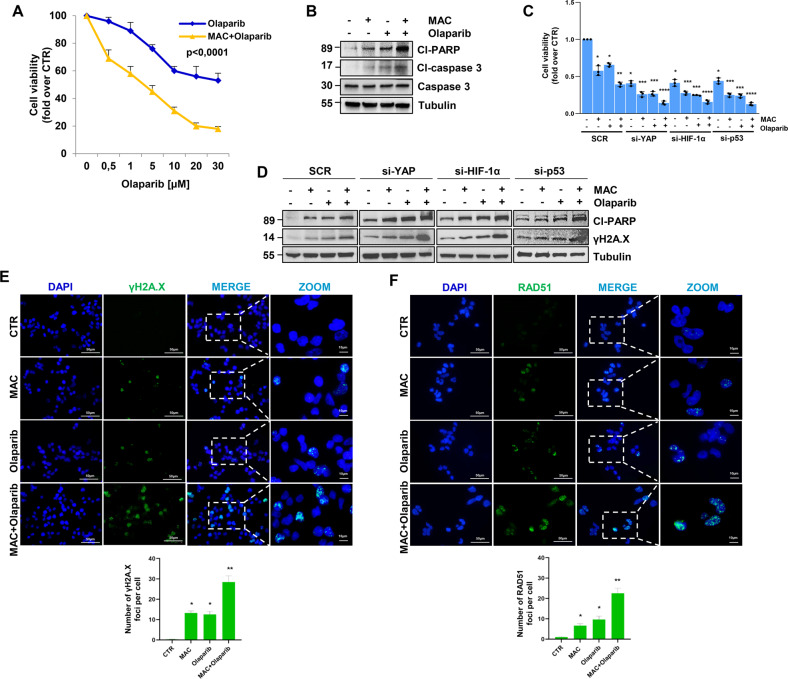
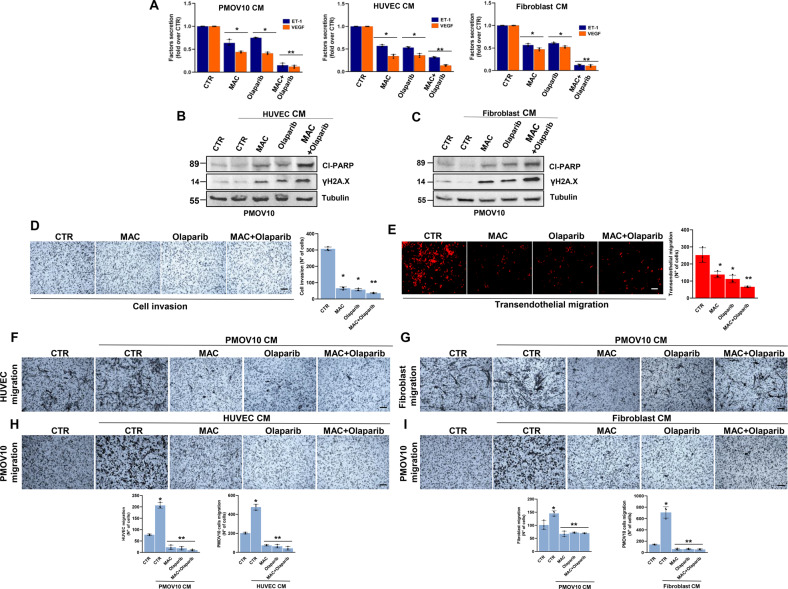
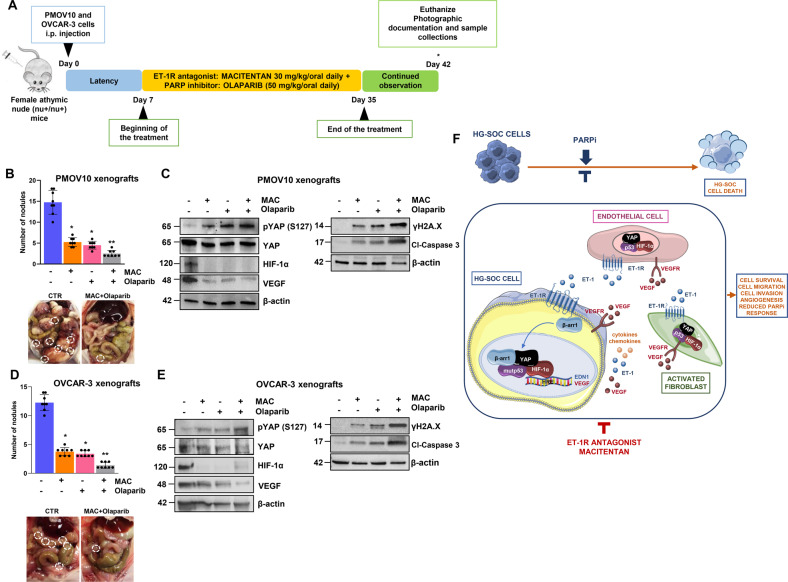
PARP inhibitors (PARPi) have changed the treatment paradigm of high-grade serous ovarian cancer (HG-SOC). However, the impact of this class of inhibitors in HG-SOC patients with a high rate of TP53 mutations is limited, highlighting the need to develop combinatorial therapeutic strategies to improve responses to PARPi. Here, we unveil how the endothelin-1/ET-1 receptor (ET-1/ET-1R) axis, which is overexpressed in human HG-SOC and associated with poor prognosis, instructs HG-SOC/tumor microenvironment (TME) communication via key pro-malignant factors and restricts the DNA damage response induced by the PARPi olaparib. Mechanistically, the ET-1 axis promotes the p53/YAP/hypoxia inducible factor-1α (HIF-1α) transcription hub connecting HG-SOC cells, endothelial cells and activated fibroblasts, hence fueling persistent DNA damage signal escape. The ET-1R antagonist macitentan, which dismantles the ET-1R-mediated p53/YAP/HIF-1α network, interferes with HG-SOC/stroma interactions that blunt PARPi efficacy. Pharmacological ET-1R inhibition by macitentan in orthotopic HG-SOC patient-derived xenografts synergizes with olaparib to suppress metastatic progression, enhancing PARPi survival benefit. These findings reveal ET-1R as a mechanistic determinant in the regulation of HG-SOC/TME crosstalk and DNA damage response, indicating the use of macitentan in combinatorial treatments with PARPi as a promising and emerging therapy.


Conflict of interest statement

The authors declare no competing interests

Figures

Fig. 1
Fig. 1. ET-1 drives HIF-1α and YAP nuclear accumulation, and the YAP1/EDNRA/HIF1A signature is correlated with poor prognosis in HG-SOC patients.
A, B Bubble charts of the top 26 hallmark and KEGG gene sets enriched in HG-SOC patient-derived (PD) primary cultures of HG-SOC cells (PMOV10) upon ET-1 (100 nM) stimulation for 24 h in comparison to untreated cells (CTR) (A) or downregulated upon macitentan (MAC, 1 µM) plus ET-1 treatment for 24 h in comparison to ET-1-treated cells (B). C ET-1 enriches the hypoxia gene signature in PMOV10 cells. GSEA in cells stimulated with ET-1 or treated with MAC plus ET-1 with the normalized enrichment score (NES). D–F Immunoblotting (IB) analysis for HIF-1α and YAP in nuclear extracts of PMOV10 (D, E) and OVCAR-3 (F) cells stimulated with ET-1 for 2 h (D–F) or treated with MAC (E, F). Histone H3 represents the loading control. G IB analyses of HIF-1α and YAP protein expression in nuclear extracts of PMOV10 cells stimulated with ET-1 for 2 h and transfected for 72 h with a siRNA control (SCR) or siRNA specific for YAP (si-YAP; left) or HIF-1α (si-HIF-1α, right). H-J PMOV10 cell extracts stimulated with ET-1 (I, J) or hypoxia (H) for 48 h were treated with cycloheximide (CHX: 100 µM) for the indicated times. Tubulin represents the loading control. K, L PMOV10 cell extracts silenced for YAP and stimulated (L) or not stimulated (K) with ET-1 for 48 h were treated with CHX for the indicated times. Tubulin represents the loading control. Representative images of blots of 3 independent experiments are shown in D-L. M, N Overall survival (OS) and disease-free survival (DFS) analysis of HG-SOC patients with high and low combined gene expression levels of YAP1, EDNRA and HIF1A (OS (M): p = 0.049; DFS (N): p = 0.002). The combined expression was obtained considering the average values of the genes. High and low expression were then evaluated in consideration of positive and negative z scores, respectively. Differences between curves were assessed by the log-rank test. A Cox hazard regression model was also included with hazard risk (HR), confidence interval at 95% and a p value as an estimate of the significance of this interval. A p value less than 0.05 (<0.05) was considered significant (OS HR: p = 0.015; DFS HR: p = 0.014).
Fig. 2
Fig. 2. ET-1 triggers the formation of YAP and HIF-1α nuclear complex, which regulates proinvasive and angiogenic factor secretion.
A, B Representative images of proximity ligation assay (PLA) detection of YAP and HIF-1α protein complexes (red signals) in ET-1-stimulated PMOV10 (A) and OVCAR-3 (B) cells and/or treated with MAC for 2 h. DAPI nuclear staining (blue). Scale bar, 10 µm. The right graphs show the PLA quantification. Bars are means ± SD (*p < 0.001 vs. CTR; **p < 0.0009 vs. ET-1; n = 3). C, D Nuclear extracts of PMOV10 (C) or OVCAR-3 (D) cells stimulated with ET-1 and/or MAC for 2 h were immunoprecipitated (IP) for YAP using anti-YAP or anti-IgG and IB using anti-YAP and anti-HIF-1α. Histone H3 represents the loading control. Representative images of blots of 3 independent experiments are shown. E Hierarchical clustering of the mean standardized fluorescence intensity of 48 cytokines in PMOV10 cell conditioned media (CM) stimulated or not with ET-1 for 24 h or silenced for YAP, HIF-1α or p53 for 72 h. Factors were clustered based on Euclidean distance.
Fig. 3
Fig. 3. mutp53/YAP engages HIF-1α to mediate the ET-1-induced transcriptional cooperation that promotes HG-SOC cell invasion and transendothelial migration.
A The recruitment of β-arr1, YAP and p53 on the HIF-1α binding motif (HRE motif) in the VEGF and ET-1 promoters of PMOV10 cells stimulated with ET-1 for 2 h was measured by chromatin immunoprecipitation (ChIP) followed by PCR. Anti-IgG mouse Ab (IgGM) was used as a control for all ChIP reactions. B qRT-PCR analysis of YAP/HIF-1α mRNA target genes in PMOV10 cells stimulated with ET-1 and treated with MAC for 24 h or silenced for β-arr1, YAP, p53 and HIF-1α for 72 h. Bars are means ± SD (*p < 0.0007 vs. CTR; **p < 0.0002 vs. ET-1; n = 3). C, D ET-1 (C) and VEGF (D) promoter activity in PMOV10 cells silenced as in B, cotransfected with ET-1 or VEGF promoter-luc constructs, and treated with ET-1 and/or MAC for 24 h. Bars are means ± SD (*p < 0.02 vs. CTR; **p < 0.004 vs. ET-1; n = 3). E, F ELISA for ET-1 (E) and VEGF (F) released by PMOV10 cells with or without YAP or HIF-1α silencing for 72 h and stimulated with ET-1 or hypoxia or treated with MAC for 24 h. Bars are means ± SD (*p < 0.05 vs. CTR; n = 3). G Invasion assay of PMOV10 cells stimulated or not with ET-1, treated with MAC for 24 h, or transfected with SCR, si-YAP, si-HIF-1α or si-p53 for 72 h. Representative images of invading cells were photographed (scale bar: 100 µm, magnification 20X) (left panels) or counted (right graph). Bars are means ± SD (*p < 0.0007 vs. CTR; **p < 0.0002 vs. ET-1; n = 3). H Transendothelial migration assay of PMOV10 cells silenced or not for YAP, HIF-1α or p53 for 72 h and stimulated with ET-1 and/or MAC for 24 h. Representative images of transmigrated cells were photographed (scale bar: 100 µm, magnification 20X) (left panels) or counted (right graph). Bars are means ± SD (*p < 0.05 vs. CTR; **p < 0.03 vs. ET-1; n = 3).
Fig. 4
Fig. 4. The ET-1-triggered p53/YAP/HIF-1α network enhances HG-SOC/endothelial cell cross-talk.
A IB analysis of ETAR and ETBR protein expression in total HUVEC extracts. Tubulin represents the loading control. B IB analysis of YAP and HIF-1α protein expression in nuclear extracts of HUVEC stimulated with ET-1 and/or MAC or hypoxia for 2 h. Histone H3 represents the loading control. C Representative images of PLA detection of YAP and HIF-1α protein complexes (red signals) in HUVEC stimulated with ET-1 and/or MAC for 2 h. Nuclei are stained blue (DAPI). (Scale bar: 10 µm, magnification 64X). The right graph shows the PLA quantification. Bars are means ± SD (*p < 0.0002 vs. CTR; **p < 0.0002 vs. ET-1; n = 3). D Nuclear extracts of HUVEC stimulated with ET-1 for 2 h were IP for YAP, using anti-YAP, or anti-IgG and IB, using anti-YAP, anti-p53 and anti-HIF-1α. Histone H3 represents the loading control. Representative images of blots of 3 independent experiments are shown. E, F ELISA for ET-1 (E) and VEGF (F) released by HUVEC silenced or not for YAP or HIF-1α for 72 h and stimulated with ET-1 or hypoxia, or treated with MAC for 24 h. Bars are means ± SD (*p < 0.04 vs. CTR; n = 3). G Representative images of 3D hybrid PMOV10/EC spheroids sprouting into the surrounding matrix upon stimulation with exogenous ET-1 and/or MAC for 48 h (scale bar: 100 µm, magnification 10X). Right graph, quantification of cumulative sprout length (µM). Bars are means ±SD (*p < 0.002 vs. CTR; **p < 0.002 vs. ET-1 treated cells; n = 3). H Cocultured cells with or without YAP, HIF-1α or p53 silencing were stained green (PMOV10) and red (HUVEC) and then treated with ET-1 and/or macitentan or with PMOV10 CM or HUVEC CM for 24 h. Representative images of cells were photographed both at T0 and upon treatment for 24 h (scale bar: 100 µm, magnification 20X). The right graph indicates the percentage of gap closure. Bars are means ± SD (*p < 0.02 vs. CTR; **p < 0.0004 vs. ET-1; n = 3).
Fig. 5
Fig. 5. The ET-1-triggered p53/YAP/HIF-1α circuit mediates HG-SOC/activated fibroblast interplay.
A IB analysis for ETAR and ETBR protein expression in total extracts of human fibroblasts. Tubulin is used as a loading control. B IB analysis for α-SMA, vimentin and fibronectin in total extracts of fibroblasts stimulated with ET-1 and/or MAC for 24 h. Tubulin is used as a loading control. C IB analysis of YAP and HIF-1α protein expression in nuclear extracts of fibroblasts stimulated with ET-1 and/or MAC or hypoxia for 2 h. PCNA was used as a loading control. D Representative images of PLA detection of protein complexes containing YAP and HIF-1α (red signals) in ET-1-stimulated fibroblasts and/or treated with MAC for 2 h. Nuclei are stained in blue (DAPI). (scale bar: 10 µm, magnification 64X). The right graph shows the PLA quantification. Bars are means ± SD (*p < 0.02 vs. CTR; **p < 0.006 vs. ET-1; n = 3). E Nuclear extracts of fibroblasts stimulated with ET-1 for 2 h were IP for YAP using anti-YAP or anti-IgG and IB using anti-YAP, anti-p53 and anti-HIF-1α. Histone H3 represents the loading control. Representative images of blots of 3 independent experiments are shown in A-C, and E. F, G ELISA for ET-1 (F) and VEGF (G) released by fibroblasts silenced or not silenced for YAP or HIF-1α and stimulated with ET-1 or hypoxia or treated with MAC for 24 h. Bars are means ± SD (*p < 0.0006 vs. CTR; n = 3). H Cocultured cells with or without YAP, HIF-1α or p53 silencing for 72 h were stained green (PMOV10) and red (fibroblasts) and then treated with ET-1 and/or macitentan or with PMOV10 CM or fibroblast CM for 24 h. Representative images of cells were photographed at T0 and upon treatment for 24 h (scale bar: 100 µm, magnification 20X). The right graph indicates the percentage of gap closure. Bars are means ± SD (*p < 0.0007 vs. CTR; **p < 0.0004 vs. ET-1; n = 3). I Representative images of 3D PMOV10 spheroids sprouting into the surrounding matrix upon stimulation with exogenous ET-1, HUVEC CM or fibroblast CM for 48 h, or upon stimulation with CM from fibroblasts or HUVEC treated with macitentan or silenced for YAP or HIF-1α (scale bar: 100 µm, magnification 10X). Right graph, quantification of cumulative sprout length (µM). Bars are means ±SD (*p < 0.0002 vs. CTR; **p < 0.0002 vs. HUVEC CM- or fibroblast CM-treated cells; n = 3).
Fig. 6
Fig. 6. ET-1R blockade by macitentan, hampering the mutp53/YAP/HIF-1α axis, enhances HG-SOC cell sensitivity to olaparib, promoting DNA damage and apoptosis.
A Effect of different concentrations of olaparib, alone or in combination with MAC (1 µM) for 48 h, on PMOV10 cell vitality. Data points are means ± SD (*p < 0.0001 vs. olaparib; n = 3). B IB analysis of cleaved-PARP (cl-PARP), caspase 3 and cleaved-caspase 3 (cl-caspase 3) expression in PMOV10 cells treated with MAC and/or olaparib (1 µM). Tubulin represents the loading control. C Effect of treatment with MAC and/or olaparib, alone or in combination for 48 h, on the vitality of PMOV10 cells transfected with SCR, si-YAP, si-HIF-1α or si-p53 for 72 h. Bars are the means ± SD (*p < 0.0005 vs. SCR CTR; **p < 0.002 vs. SCR olaparib; ***p < 0.002 vs. SCR olaparib or SCR MAC; ****p < 0.0006 vs. SCR MAC + olaparib; n = 3). D IB analysis of cleaved-PARP and phospho-Histone H2A.X (S139; γH2A.X) expression in PMOV10 cells treated as in C. Tubulin represents the loading control. Representative images of blots of 3 independent experiments are shown in B and D. E, F Representative images of γH2A.X (E) and RAD51 (F) foci (green) evaluated by IF in PMOV10 cells stimulated with MAC and/or olaparib for 24 h (scale bar: 50 µm, magnification 64X). Nuclei are stained blue (DAPI). Images are magnified to show the γH2A.X (E) and RAD51 (F) foci. The bottom graphs represent the quantification of the number of γH2A.X and RAD51 foci. Bars are means ± SD (*p < 0.005 vs. CTR; **p < 0.005 vs. olaparib; n = 3).
Fig. 7
Fig. 7. The combination of macitentan and olaparib, impairing the p53/YAP/HIF-1α-mediated release of ET-1 and VEGF, interferes with tumor/stroma signal reciprocity and the pro-invasive behavior of HG-SOC cells.
A ELISA for ET-1 and VEGF released by PMOV10 cells, HUVEC and fibroblasts treated with macitentan or olaparib, alone or in combination for 24 h. Bars are the means ± SD (*p < 0,002 vs. CTR; **p < 0,0006 vs. olaparib; n = 3). B, C IB analysis of cl-PARP and γH2A.X expression in PMOV10 cells treated with CM from HUVEC (B) or fibroblasts (C) prestimulated with MAC or olaparib, alone or in combination for 24 h. Tubulin represents the loading control. Representative images of blots of 3 independent experiments are shown. D Invasion assay of PMOV10 cells treated with MAC or olaparib, alone or in combination for 24 h. Representative images of the invading cells were photographed (scale bar: 100 µm, magnification 20X) (left panels) or counted (right graph). Bars are the means ± SD (*p < 0.0002 vs. CTR; **p < 0.02 vs. olaparib-treated cells; n = 3). E Transendothelial migration assay of PMOV10 cells treated with MAC or olaparib, alone or in combination for 24 h. Representative images of the transmigrated cells were photographed (scale bar: 100 µm, magnification 20X) (left panels) or counted (right graph). Bars are means ± SD (*p < 0.0002 vs. CTR; **p < 0.0003 vs. olaparib-treated cells; n = 3). F, G Migration assay of HUVEC (F) or fibroblasts (G) treated with CM from PMOV10 cells prestimulated with MAC or olaparib, alone or in combination for 24 h. Representative images of migrating cells were photographed (scale bar: 100 µm, magnification 20X) (upper panels) or counted (bottom graphs). Bars are means ± SD (*p < 0.02 vs. CTR; **p < 0.0008 vs. PMOV10 CM treated cells; n = 3). H, I Migration assay of PMOV10 cells treated with CM from HUVEC (H) or fibroblasts (I) prestimulated with MAC or olaparib, alone or in combination for 24 h. Representative images of migrating cells were photographed (scale bar: 100 µm, magnification 20X) (upper panels) or counted (bottom graphs). Bars are means ± SD (*p < 0.0007 vs. CTR; **p < 0.0005 vs. HUVEC or fibroblast CM-treated cells; n = 3).
Fig. 8
Fig. 8. Macitentan reduces HG-SOC metastatic potential and sensitizes to olaparib in vivo.
A Treatment schedule of patient-derived HG-SOC xenografts (PDX) and OVCAR-3 xenografts. B, D The number of tumor nodules examined at the end of the treatment. Bars are the means ± SD (*p < 0.0002 vs. vehicle-treated mice (CTR); **p < 0.0004 vs. olaparib-treated mice; n = 2). Right panels, Representative i.p. The metastatic nodules are indicated by white dotted-line circles. C, E pYAP (S127), YAP, HIF-1α, VEGF, γH2A.X and cl-caspase 3 protein expression in total cell lysates of i.p. nodules was evaluated by IB analysis. β-actin represents the loading control. Representative images of blots of 2 independent experiments are shown. F Working model illustrating how under the guidance of the ET-1/ET-1R axis, mutp53 anchors YAP and HIF-1α to DNA, turning on a cooperative transcriptional program in HG-SOC cells, endothelial cells and activated fibroblasts that culminates with the release of soluble mediators, such as ET-1, and how the amplification of a self-feeding circuit blunts the effect of PARPi. ET-1R blockade, dismantling the cross-talk between HG-SOC, EC, and activated fibroblasts, empowers olaparib efficacy, representing a valid companion for PARPi-based therapy.

References

    1. Siegel RL, Miller KD, Fuchs HE, Jemal A. Cancer Statistics. CA Cancer J Clin. 2022;72:7–33. doi: 10.3322/caac.21708. - DOI - PubMed
    1. Moore K, Colombo N, Scambia G, Kim BG, Oaknin A, Friedlander M, et al. Maintenance olaparib in patients with newly diagnosed advanced ovarian cancer. N. Engl J Med. 2018;379:2495–505. doi: 10.1056/NEJMoa1810858. - DOI - PubMed
    1. Kim DS, Camacho CV, Kraus WL. Alternate therapeutic pathways for PARP inhibitors and potential mechanisms of resistance. Exp Mol Med. 2021;53:42–51. doi: 10.1038/s12276-021-00557-3. - DOI - PMC - PubMed
    1. Bristow RG, Hill RP. Hypoxia and metabolism. Hypoxia, DNA repair and genetic instability. Nat Rev Cancer. 2008;8:180–92. doi: 10.1038/nrc2344. - DOI - PubMed
    1. Ghoneum A, Afify H, Salih Z, Kelly M, Said N. Role of tumor microenvironment in the pathobiology of ovarian cancer: insights and therapeutic opportunities. Cancer Med. 2018;7:5047–56. doi: 10.1002/cam4.1741. - DOI - PMC - PubMed

Publication types

MeSH terms