. 2023 Jan 5;14(1):80.
doi: 10.1038/s41467-022-35524-7.

Adipose tissue is a source of regenerative cells that augment the repair of skeletal muscle after injury

Affiliations

Adipose tissue is a source of regenerative cells that augment the repair of skeletal muscle after injury

Quentin Sastourné-Arrey et al. Nat Commun. .

Abstract

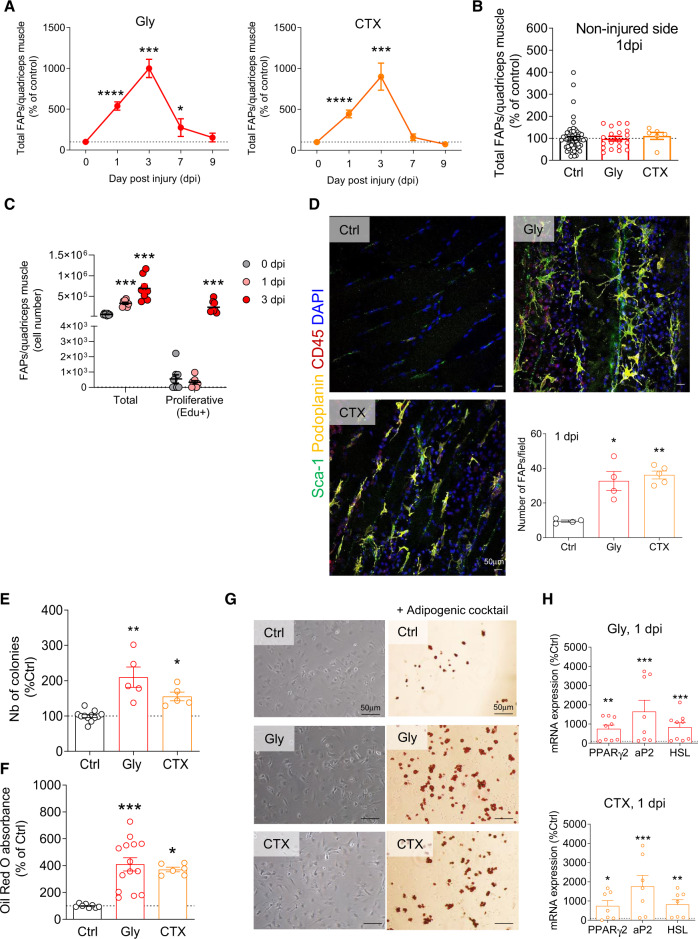
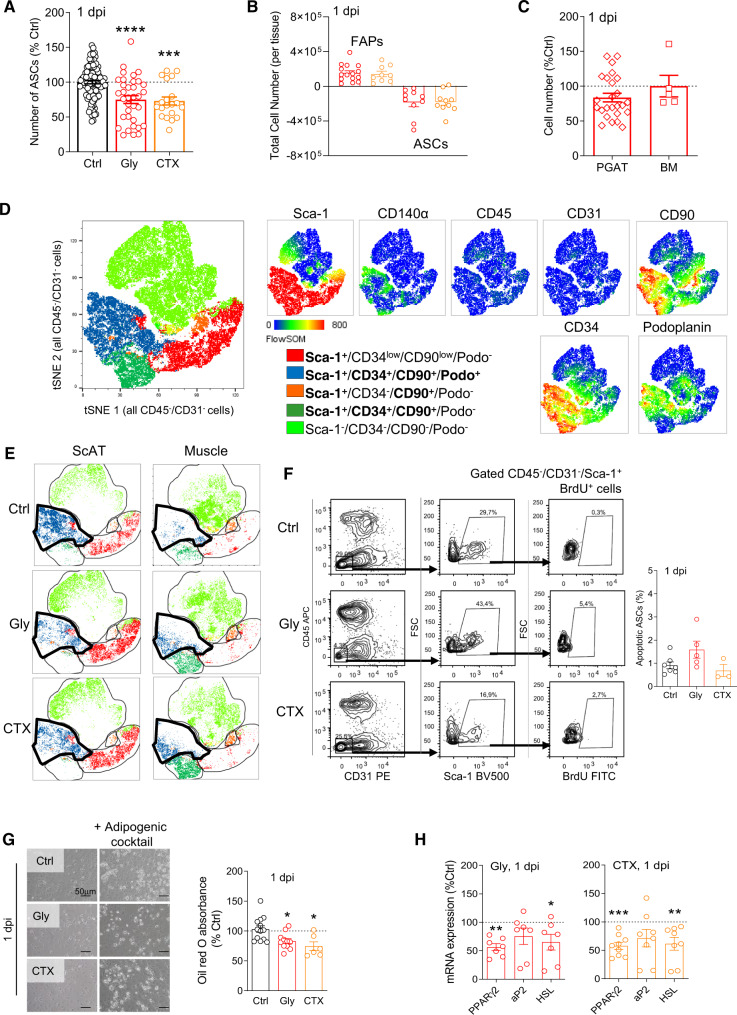
Fibro-adipogenic progenitors (FAPs) play a crucial role in skeletal muscle regeneration, as they generate a favorable niche that allows satellite cells to perform efficient muscle regeneration. After muscle injury, FAP content increases rapidly within the injured muscle, the origin of which has been attributed to their proliferation within the muscle itself. However, recent single-cell RNAseq approaches have revealed phenotype and functional heterogeneity in FAPs, raising the question of how this differentiation of regenerative subtypes occurs. Here we report that FAP-like cells residing in subcutaneous adipose tissue (ScAT), the adipose stromal cells (ASCs), are rapidly released from ScAT in response to muscle injury. Additionally, we find that released ASCs infiltrate the damaged muscle, via a platelet-dependent mechanism and thus contribute to the FAP heterogeneity. Moreover, we show that either blocking ASCs infiltration or removing ASCs tissue source impair muscle regeneration. Collectively, our data reveal that ScAT is an unsuspected physiological reservoir of regenerative cells that support skeletal muscle regeneration, underlining a beneficial relationship between muscle and fat.


Conflict of interest statement

The authors declare no competing interests.

Figures

Fig. 1
Fig. 1. Muscle injured derived FAPs resemble ASCs from ScAT.
A Principal-component analysis (PCA, PC2 vs PC3) of RNAseq expression values of FAPs and ASCs isolated from injured (1 dpi) and control animals. B Venn diagram showing overlap of differentially expressed genes in ASCs from ScAT (SCAT) and FAPs from injured muscle (FAPInj) as compared with FAPs in non-injured animals (FAP). LOG2FC > 0.58 and p value<0.05. C Expression heatmap of K-mean clustering of differentially expressed genes (expressed in Z score) in FAPs groups (control and injured) compared with ASCs and corresponding Gene Ontology terms. D Table list of the top upregulated genes in ASCs compared with FAPs ranked by adjusted p value. Significance was obtained using DESeq2 package set to default parameters which uses the Wald test to calculate p values. E Violin plots of Sca-1 and Podoplanin (pdpn) of single-cell RNAseq expression of FAPs isolated from injured (0.5, 2, and 3.5 dpi) and control animals using datasets from Oprescu et al..
Fig. 2
Fig. 2. FAPs content increases within 24 h after muscle injury.
A, B Myofiber damage was induced by intramuscular injection of glycerol (Gly) or cardiotoxin (CTX) into the quadriceps. FAP number was quantified in quadriceps-derived SVF by flow cytometry (with the markers CD31, CD45, Sca-1, CD34, CD140α, and podoplanin) from 1 to 9 dpi and compared between control (uninjured, Ctrl), Gly or CTX injected animals (A, B) as well as in contralateral non-injured quadriceps (B) For A, n = 62 (Ctrl) animals over nine independent experiments at 0 dpi, n = 28 (Gly) and 7 (CTX) animals over four independent experiments at 1 dpi, n = 3 (Gly and CTX) animals over three independent experiments at 3, 7 and 9 dpi. For B, n = 62 (Ctrl), 19 (Gly), 6 (CTX) animals over 9, 3, and 3 independent experiments, respectively. C Detection of in vivo Edu incorporation detected by flow cytometry in FAPs of control and injured animals (Gly, 1 dpi). n = 8 animals at all time points over three independent experiments. D Representative confocal images and immunohistological analysis of injured (Gly and CTX) quadriceps at 1 dpi and quantification of Sca-1+/Podoplanin+/CD45 cells in situ. n = 4 (Ctrl and Gly) and 5 (CTX) animals over three independent experiments. Bar scale 50 μm. E, F Clonogenic (E) and adipogenic (F) assays were performed on total SVF isolated from control or injured (Gly and CTX) muscle at 1 dpi. For E, n = 12 (Ctrl) and 5 (Gly and CTX) animals over three independent experiments. F n = 8 (Ctrl) and 14 (Gly), and 6 (CTX) animals over four independent experiments. G Representative phase contrast images of Ctrl, Gly, or CTX muscle-derived SVF cells under adipogenic culture conditions. Cells were fixed at day 4 and stained with Oil red O. Bar scale 50 μm. H mRNA expression of adipogenic markers measured on total SVF isolated from control or injured (Gly and CTX) muscle at 1 dpi. n = 7 (Gly and CTX) animals over four independent experiments. Results are expressed as a percentage of non-injured control animals with mean ± SEM; *p < 0.05, **p < 0.01, ***p < 0.001, ****p < 0.0001 vs Ctrl.
Fig. 3
Fig. 3. ASC content diminishes in ScAT within 24 hours after muscle injury.
A Flow cytometry analyses of CD31, CD45, Sca-1, CD34, and podoplanin expression in ScAT-derived SVF of control and injured (Gly and CTX) animals at 1 dpi. n = 106 (Ctrl), 34 (Gly), and 19 (CTX) animals over 15, 15, and 9 independent experiments respectively. B Relative cell numbers in injured muscle and ScAT at 1 dpi. n = 15 (Gly) and 9 (CTX) animals for muscle and 10 (Gly) and 10 (CTX) animals for ScAT over three independent experiments. C ASCs and MSCs content in perigonadic adipose tissue (PGAT) and bone marrow (BM), respectively, using flow cytometry at 1 dpi in Gly-injured animals. n = 25 (PGAT) and 5 (BM) animals over three independent experiments. D ASCs and FAPs phenotypic analysis by flow cytometry. Merged tSNE plot for all control and Gly-injured CD45/CD31 cell among ScAT and muscle SVF-derived cells. The identity of each cluster according to the combinatory expression level of multiple markers is color-coded in the tSNE plot. Cytometry marker expression level plots are presented on the right-hand side. E Comparison of ScAT and muscle tSNE plot in control and injured (Gly and CTX) conditions at 1 dpi; clusters identified in D are black circled. F TUNEL staining of ScAT-derived SVF from Gly- or CTX-injured, or non-injured animals (Ctrl) at 1 dpi. n = 7 (Ctrl), 5 (Gly), and 3 (CTX) animals over three independent experiments. G Phase contrast images of adipogenic challenged ScAT-derived SVF from Ctrl, Gly, and CTX-injured animals. Cells were fixed at day 4 of differentiation and stained with oil red O. Bar scale 50 μm. n = 13 (Ctrl), 11 (Gly), and 9 (CTX) animals over four independent experiments. H mRNA expression of adipogenic genes in ScAT-derived SVF from Ctrl, Gly, and CTX-injured animals at 1 dpi. n = 7 (Ctrl), 7 (Gly), and 7 (CTX) animals over three independent experiments. Results are expressed as percentage of non-injured control animals with mean ± SEM; *p < 0.05, **p < 0.01,***p < 0.001 vs Ctrl.
Fig. 4
Fig. 4. ASCs leave the ScAT and infiltrate injured muscle.
A Time course evaluation of murine in vitro ASC chemotaxis in response to plasma isolated from Ctrl, CTX- and Gly-injured animals at 1 dpi. n = 5 (Ctrl), 3 (Gly) and 4 (CTX) animals over three independent experiments. B In vitro human ASCs (of three individuals) chemotaxis in response to serum of six individuals collected 1 hour after an acute bout of continuous exercise (60% VO2 max). C Correlation of human ASC chemotaxis with 1h-post exercise GDF-15 blood levels. n = 6 serums tested on 1 or 2 sets of ASC over three independent experiments. D Model of ScAT grafting from CD34-GFP mouse into WT C57Bl/6 mice (left panel), the figure was partly generated using Servier Medical Art, provided by Servier, licensed under a Creative Commons Attribution 3.0 unported license. Immunohistofluorescence image of the ScAT depot 7 days post-graft surgery (right panel, bar scale 200 μm). E Flow cytometry analysis of the SVF from Gly-injured muscle of the grafted mice (1 dpi), GFP+/CD45/CD31 are scated on an histogram for Sca-1 intensity. FH Immunohistological analysis of Gly-injured (1 dpi) quadriceps in grafted mice with KikGR ScAT in situ (green arrowheads point KikGR+/CD140α+/CD45 (F), KikGR+/ Podoplanin+/CD31 cells (G) or KikGR+/CD140α+/Sca-1+ (H)). Bar scale 10 μm. Results are expressed as mean ± SEM; *p < 0.05.
Fig. 5
Fig. 5. The interaction of blood platelets with ASCs determines their infiltration into the damaged muscle.
A Cell surface podoplanin expression of ScAT-derived ASCs of injured (Gly and CTX) or control animals by flow cytometry at 1 dpi. n = 5 (Ctrl), 5 (Gly), and 4 (CTX) animals over three independent experiments. B Representative phase contrast and fluorescent images of PKH26-stained platelets (yellow) co-incubated with ScAT-ASCs in the presence or not of blocking podoplanin antibody, bar scale 200 μm. C Quantification of PKH26-stained platelets with ASCs. n = 12 (Ctrl), 6 (Gly), and 3 (Gly + αPodo) animals over three independent experiments. D Model of platelet depletion, the figure was partly generated using Servier Medical Art, provided by Servier, licensed under a Creative Commons Attribution 3.0 unported license. E Platelet numeration 1 day post platelet depletion. n = 4 (Ctrl), 4 (Gly), and 4 (CTX) animals over two independent experiments. F FAPs content by flow cytometry in injured muscle from control (+IgG) or platelet-depleted animals (+αPLA). n = 7 (Gly+IgG) and 9 (Gly + αPLA) animals over two independent experiments. G FAPs content by flow cytometry in injured muscle from control (+IgG) or antipodoplanin treated animals (+αPodo). n = 7 (Gly+IgG) and 5 (Gly + αPodo) animals over three independent experiments. Results are expressed as percentage of non-injured control animals with mean ± SEM; *p < 0.05, **p < 0.01, ***p < 0.001.
Fig. 6
Fig. 6. The interaction of blood platelets with ASCs is crucial for effective muscle regeneration.
A Model of platelet depletion and ASCs injection. The figure was partly generated using Servier Medical Art, provided by Servier, licensed under a Creative Commons Attribution 3.0 unported license. B Platelet numeration time course in control and Gly-injured animals from 1 to 14 dpi. n = 15 (Ctrl) and three animals for each other time point over two independent experiments. C Time course of mRNA expression of myogenic genes in quadriceps muscle from control and Gly-injured animals with and without platelet depletion. n = 12–16 (Ctrl) and 5–8 at 3 dpi, 6–8 at 7 dpi, and 6–9 at 14 dpi animals over four independent experiments. D Immunohistological confocal images of quadriceps muscles at 7 dpi (Gly +/− platelet depletion). Bar scales 500 (left) and 50 (right) μm. E Immunohistological-based quantification of regenerative (WGA centronucleated fibers) muscle fibers at 7 dpi. n = 5 (Gly), 5 (Gly + αPLA) and 4 (Gly + αPLA + ASCs) animals over four independent experiments. F Size distribution of regenerating muscle fibers in Gly-injured (red), platelet-depleted (gray), and ASCs supplemented (green) animals at 14 dpi. n = 4 (Gly), 6 (Gly + αPLA), and 5 (Gly + αPLA + ASCs) animals over four independent experiments. G Time course of mRNA expression of intramuscular connective tissue (IMCT) genes in quadriceps muscle from control and Gly-injured animals with and without platelet depletion. n = 5 (Ctrl) and, 5–7 at 3 dpi, 3–4 at 7 dpi, 4 at 14 dpi animals over three independent experiments. H Immunohistological-based quantification of IMCT deposition in quadriceps muscle from control and CTX-injured animals with and without platelet depletion at 14 dpi. n = 27 (Ctrl), 10 (CTX), 28 (CTX + αPLA), and 30 (CTX + αPLA + ASCs) pictures of 4, 3, 4, and 4 animals in each group, respectively, over three independent experiments. Results are expressed as a percentage of control animals with mean ± SEM; *p < 0.05, **p < 0.01, ***p < 0.001.
Fig. 7
Fig. 7. The origin of the ASCs reservoir determines muscle regeneration outcome.
A Model of bilateral lipectomy and ASC injection. The figure was partly generated using Servier Medical Art, provided by Servier, licensed under a Creative Commons Attribution 3.0 unported license. B Time course of mRNA expression of myogenic genes in quadriceps muscle from control and Gly-injured animals with and without lipectomy. n = 4 (Ctrl) and 3–4 at 3 dpi, 3–4 at 7 dpi, 3–4 at 14 dpi animals over three independent experiments. C Immunohistological confocal images of quadriceps muscles at 7 dpi (Gly +/− platelet depletion). Bar scales 500 (top) and 50 (bottom) μm. D Immunohistological-based quantification of regenerative (WGA centronucleated fibers) muscle fibers at 7 dpi.n = 4 (Ctrl), 6 (Gly), and 9 (Gly-ScAT) animals over three independent experiments. E FAP number quantification in Gly-injured or control muscle with or without ScAT lipectomy. n = 17 (Gly), 13 (Ctrl-ScAT), and 11 (Gly-ScAT) animals over five independent experiments. F ASC number quantification in Gly-injured or control PGAT with or without ScAT lipectomy. n = 6 (Ctrl), 8 (Gly), 8 (Ctrl-ScAT), and 8 (Gly-ScAT) animals over four independent experiments. G Immunohistological confocal images of quadriceps Gly-injured and control muscles at 7 dpi with or without lipectomy. Bar scales 500 (top) and 50 (bottom) μm. H Immunohistological-based quantification of regenerative (WGA centronucleated fibers) muscle fibers at 7 dpi. n = 6 (Gly), 9 (Gly-ScAT), 6 (Gly-ScAT+ASC(ScAT)), and 5 (Gly-ScAT+ASC(PGAT)) animals over five independent experiments. I Go term analysis between ScAT and PGAT-derived ASCs. Results are expressed as percentage of control animals with mean ± SEM; *p < 0.05, **p < 0.01, ***p < 0.001, ****p < 0.0001 vs Ctrl.

Comment in

References

    1. Chargé SBP, Rudnicki MA. Cellular and molecular regulation of muscle regeneration. Physiol. Rev. 2004;84:209–238. doi: 10.1152/physrev.00019.2003. - DOI - PubMed
    1. Hawke TJ, Garry DJ. Myogenic satellite cells: physiology to molecular biology. J. Appl Physiol. 2001;91:534–551. doi: 10.1152/jappl.2001.91.2.534. - DOI - PubMed
    1. Mauro A. Satellite cell of skeletal muscle fibers. J. Biophys. Biochem. Cytol. 1961;9:493–495. doi: 10.1083/jcb.9.2.493. - DOI - PMC - PubMed
    1. Joe AWB, et al. Muscle injury activates resident fibro/adipogenic progenitors that facilitate myogenesis. Nat. Cell Biol. 2010;12:153–163. doi: 10.1038/ncb2015. - DOI - PMC - PubMed
    1. Uezumi A, Fukada S, Yamamoto N, Takeda S, Tsuchida K. Mesenchymal progenitors distinct from satellite cells contribute to ectopic fat cell formation in skeletal muscle. Nat. Cell Biol. 2010;12:143–152. doi: 10.1038/ncb2014. - DOI - PubMed

Publication types