. 2023 Jan 5;13(1):238.
doi: 10.1038/s41598-022-27188-6.

Third-order motifs are sufficient to fully and uniquely characterize spatiotemporal neural network activity

Affiliations

Third-order motifs are sufficient to fully and uniquely characterize spatiotemporal neural network activity

Sarita S Deshpande et al. Sci Rep. .

Abstract

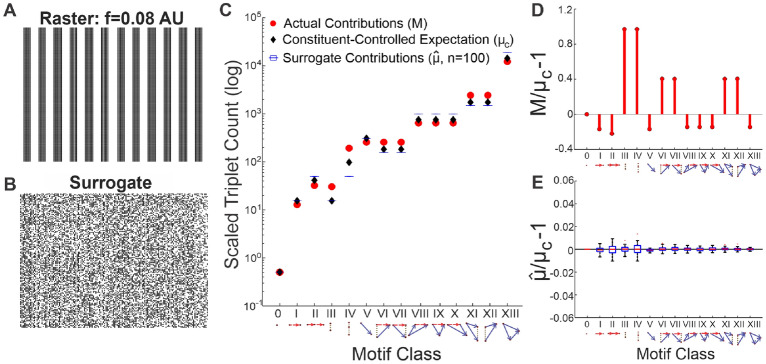
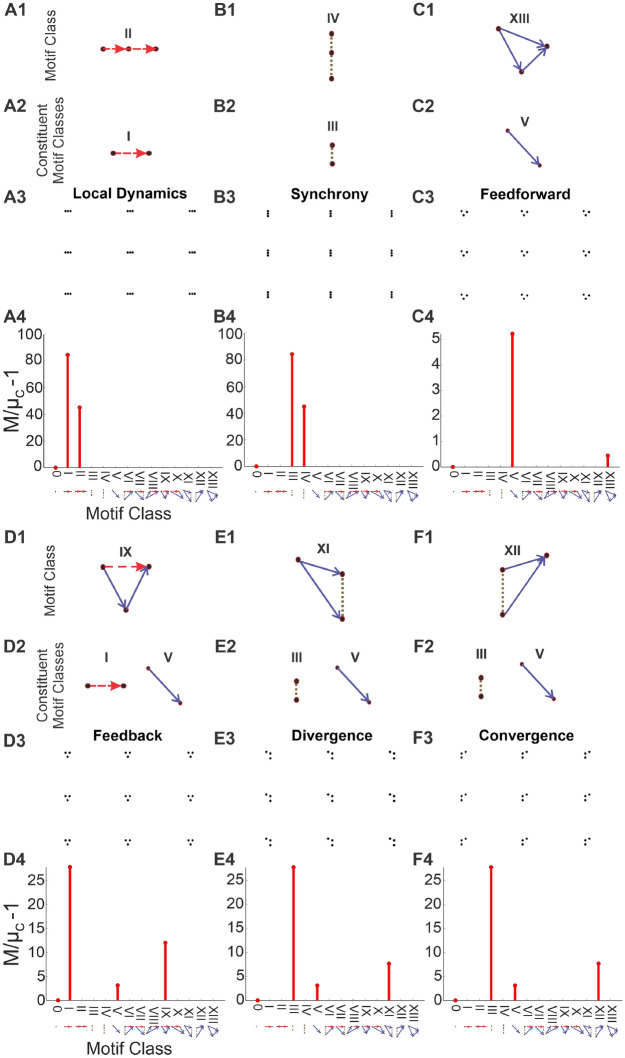
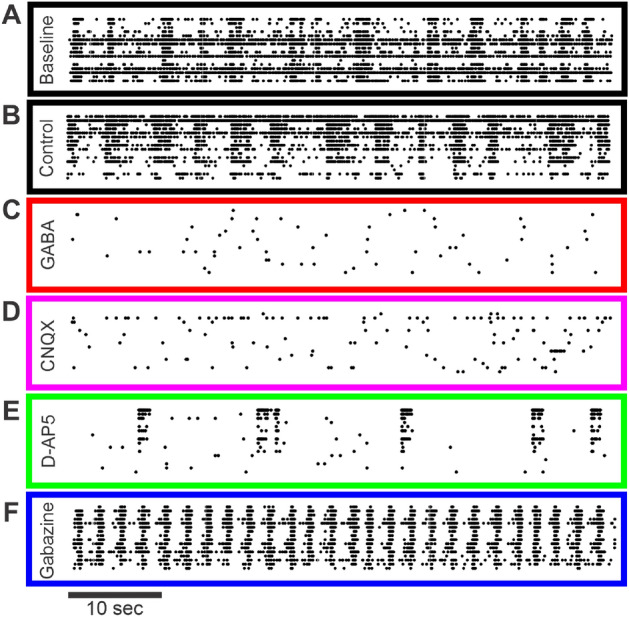
Neuroscientific analyses balance between capturing the brain's complexity and expressing that complexity in meaningful and understandable ways. Here we present a novel approach that fully characterizes neural network activity and does so by uniquely transforming raw signals into easily interpretable and biologically relevant metrics of network behavior. We first prove that third-order (triple) correlation describes network activity in its entirety using the triple correlation uniqueness theorem. Triple correlation quantifies the relationships among three events separated by spatial and temporal lags, which are triplet motifs. Classifying these motifs by their event sequencing leads to fourteen qualitatively distinct motif classes that embody well-studied network behaviors including synchrony, feedback, feedforward, convergence, and divergence. Within these motif classes, the summed triple correlations provide novel metrics of network behavior, as well as being inclusive of commonly used analyses. We demonstrate the power of this approach on a range of networks with increasingly obscured signals, from ideal noiseless simulations to noisy experimental data. This approach can be easily applied to any recording modality, so existing neural datasets are ripe for reanalysis. Triple correlation is an accessible signal processing tool with a solid theoretical foundation capable of revealing previously elusive information within recordings of neural networks.


Conflict of interest statement

The authors declare no competing interests.

Figures

Figure 1
Figure 1
Application of the fourteen motif classes to spike rasters. For a given raster (Panel A), second-order correlations can relate activity within a neuron (auto-correlation, AC; Panel B) or between neurons (cross-correlation, CC; Panel B). Triple correlation (TC; Panel B) relates three bins, separated by up to two temporal and two spatial lags. Three particular spike bins constitute a triplet motif (e.g. as shown in Panel B). We classify these motifs into fourteen motif classes by the motif’s spike sequence (Panel C; see Online Methods for a complete derivation). Dot: a single spike bin. Horizontal red dashed arrow: intraneuronal spike bins, i.e. space lag =0, e.g. I and II. Vertical stippled line: synchronous spike bins, i.e. time lag =0, e.g. III and IV. Solid blue arrow: interneuronal spike bins (e.g. V). These 14 motif classes can also embody well-known neuronal processing properties (such as synchrony, feedback, convergence, divergence, and feedforward) in both the time (listed adjacent to the motif class) and frequency domains (listed within parentheses). First- (0) and second-order (I, III, and V) motif classes are highlighted in green and yellow, respectively. The second-order motif classes I, III, and V are constituent motif classes that comprise the third-order motifs. The remaining ones are third-order motif classes.
Figure 2
Figure 2
Motif-class contributions to the raster’s triple correlation. (A) A 150×150 spike raster generated by thresholding an 0.08 AU frequency sine wave. (B) Surrogate raster generated by randomly shuffling the periodic raster in (panel A). (C) Various motif-class summary metrics calculated from a triple correlation using lags up to 20 bins in time and space: the actual contributions per motif class (M, red circles); the constituent-controlled theoretically expected contributions (μc, black diamond) conditioning on spike rate and controlling for the observed contributions of lower-order motifs; surrogate contributions (μ^c, blue boxplots visible as horizontal lines due to relatively small variance) the average motif-class contributions across n=100 shuffled surrogate rasters. (D) The constituent-controlled ratios (M/μc-1) per motif class. M/μc-1 for purely synchronous motif classes III and IV are highest; motif classes VI, VII, XI, and XII (which all consist an element of synchrony) also show positive M/μc-1 values. Note that motif class 0 always has zero signal because motif class 0 is the spike rate, which is controlled for by both N and T. (E) The estimated-to-constituent-controlled ratios (μ^/μc-1) for 100 noise simulations fluctuate around 0 for all motif classes and are shown as box-and-whisker plots. The centerline is the median, the bottom and top edges of the box are the first and third quartiles, and the whiskers extend to the minimum and maximum values.
Figure 3
Figure 3
Detecting synchrony amidst increasing noise. (A) The 150×150 spike raster plot generated by thresholding a 0.12 AU frequency sine wave with added noise. The noise consists of uniform noise scaled to give the desired signal-to-noise ratio (SNR = 0 dB). (B) The motif-class contributions (M) of the above raster relative to chance (M/μc-1). These were calculated from a triple correlation using lags up to 14 bins in time and space. These values show increased contributions of motif classes with synchronous elements, as expected. (C) The periodic signal is embedded in more noise (SNR = -9 dB), albeit still visible from the raster. (D) Same as panel B with lower magnitude signals. (E) The synchronous structure is embedded in more noise (SNR = − 17 dB), but now not overtly apparent to the naked eye. (F) Same as panels (B) and (D) with lower magnitude signals. All motif-class contributions are closer to 0, but motif classes with synchronous elements are still detected. (G) The synchronous structure is now embedded in extreme noise (SNR = − 40 dB). (H) Same as panels (B, D, and F), but now other motif-class signals are also detected (and not just those with synchronous elements) due to chance. All motif classes have even lower magnitude signals, approaching pure noise.
Figure 4
Figure 4
Detecting motif classes in individual patterns. We simulated 150×150 rasters, each consisting of a single repeated triplet. Row 1: the motif class of the repeated triplet. Row 2: the motif class’ constituent motif classes. Row 3: the simulated raster. Row 4: the motif-class contributions (M/μc-1) calculated from the row 3 raster’s triple correlation, using lags of up to 14 bins (which is less than the separation between motifs in the raster). In all cases, the highest-order motif with a non-zero contribution is the motif class, and the remaining non-zero contributions are the constituent motif classes. Note the changing y-axis scale: motif classes I and III are far less likely to occur from chance than motif class V.
Figure 5
Figure 5
Representative 1-min epochs of rat cortical spike rasters per each experimental condition at 22 days in vitro Rat cortical cultures from microelectrode array well plates were exposed to the following pharmacological agents: baseline (A; black), control (B; black), GABA (C; red), CNQX (D; magenta), D-AP5 (E; green), and gabazine (F; blue). Note that we present the raster in two dimensions here while in our analysis for Fig. 6 we used the two spatial dimensions of the MEA and one temporal dimension.
Figure 6
Figure 6
Application of the triple correlation approach to experimental data. We determined motif-class contributions in an open-source dataset of rat cortical cultures. Networks (n=70 wells; n=35 baseline and n=35 treated) were cultured on microelectrode array (MEA) well plates—each well configured with 4x4 electrodes. The treated wells were exposed to the following experimental conditions (n=7 wells per condition): control (black), GABA (red), gabazine (blue), CNQX (magenta), and D-AP5 (green). Each treatment well was matched to an untreated baseline well. For each motif class, we depict the distribution of ratios between the treatment and baseline wells. In these box-and-whisker plots, the centerline is the median, the bottom and top edges of the box are the first and third quartiles, and the whiskers extend to the minimum and maximum values. (A) The normalized spike counts relative to baseline (contributions of motif class 0) are shown for each experimental condition. The table shows the effect of each of the experimental conditions. (B) M/μc-1 values are shown for control-, GABA-, and gabazine-treated cultures. Note that some motif classes (IV, VI, VII, XI, XII) do not show values for GABA treatment due to lack of spiking. (C) Results for control- and CNQX-treated cultures. (D) The motif-class spectra for control and D-AP5-treated cultures indicate increased network structure for the latter, while its level of activity was reduced (Panel A).

Similar articles

Cited by

References

    1. Abeles M, Gerstein GL. Detecting spatiotemporal firing patterns among simultaneously recorded single neurons. J. Neurophysiol. 1988;60:909–924. doi: 10.1152/jn.1988.60.3.909. - DOI - PubMed
    1. Dechery JB, MacLean JN. Functional triplet motifs underlie accurate predictions of single-trial responses in populations of tuned and untuned V1 neurons. PLoS Comput. Biol. 2018;14:e1006153. doi: 10.1371/journal.pcbi.1006153. - DOI - PMC - PubMed
    1. Schneidman E, Berry MJ, Segev R, Bialek W. Weak pairwise correlations imply strongly correlated network states in a neural population. Nature. 2006;440:1007–1012. doi: 10.1038/nature04701. - DOI - PMC - PubMed
    1. Jiang M, Gao X, An H, Li H, Sun B. Reconstructing complex network for characterizing the time-varying causality evolution behavior of multivariate time series. Sci. Rep. 2017;7:10486. doi: 10.1038/s41598-017-10759-3. - DOI - PMC - PubMed
    1. Sporns O, Kötter R. Motifs in brain networks. PLoS Biol. 2004;2:e369. doi: 10.1371/journal.pbio.0020369. - DOI - PMC - PubMed

Publication types

MeSH terms