. 2023 Jan 5;13(1):222.
doi: 10.1038/s41598-023-27420-x.

Single-cell-led drug repurposing for Alzheimer's disease

Affiliations

Single-cell-led drug repurposing for Alzheimer's disease

Silvia Parolo et al. Sci Rep. .

Abstract

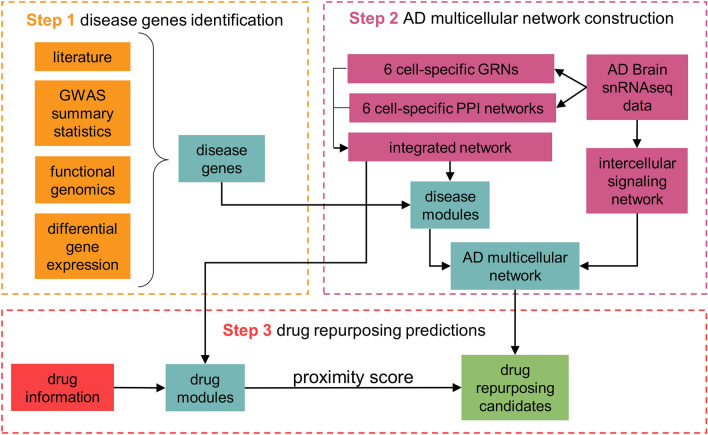
Alzheimer's disease is the most common form of dementia. Notwithstanding the huge investments in drug development, only one disease-modifying treatment has been recently approved. Here we present a single-cell-led systems biology pipeline for the identification of drug repurposing candidates. Using single-cell RNA sequencing data of brain tissues from patients with Alzheimer's disease, genome-wide association study results, and multiple gene annotation resources, we built a multi-cellular Alzheimer's disease molecular network that we leveraged for gaining cell-specific insights into Alzheimer's disease pathophysiology and for the identification of drug repurposing candidates. Our computational approach pointed out 54 candidate drugs, mainly targeting MAPK and IGF1R signaling pathways, which could be further evaluated for their potential as Alzheimer's disease therapy.


Conflict of interest statement

The authors declare no competing interests.

Figures

Figure 1
Figure 1
Outline of the computational pipeline. Each dashed line box corresponds to a main step of the pipeline. Step 1 takes as input different data sources and merge them to define six lists of cell-specific disease genes; step 2 builds the AD multicellular network starting from TF-gene interaction and protein–protein interactions; step 3 takes as input the results of step 1 and 2 to identify drug repurposing candidates by means of network analysis.
Figure 2
Figure 2
Functional enrichment of the AD genes in Disease Ontology and Human Phenotype Ontology terms. For each cell-specific list of disease genes, the 10 most enriched DO (a) and HPO (b) terms are shown. On the y-axis the terms are sorted from the top to the bottom according to the number of cells in which they are enriched. The color code indicates the significance of the enrichment, ranging from blue (more significant) to yellow (less significant).
Figure 3
Figure 3
AD multi-cellular network. (a) Visualization of the multi-cellular network. Each node corresponds to a cell-specific AD module except for the nodes labeled as “other” which indicate genes not included in any significant AD module but interacting with them thanks to ligand receptor interactions. The edges between the nodes indicate ligand-receptor interactions. The color of the nodes indicates the cell type. (b) The significance of the disease gene enrichment for each AD module (x-axis) is plotted versus the network centrality of the corresponding node (y-axis). In the upper right corner are reported the AD modules with the highest significance and a high level of centrality in the network.
Figure 4
Figure 4
Functional analysis of the core AD modules. Network visualization of the Reactome pathway enrichment analysis results. In each network, the nodes are the pathways and the connections between them reflect the ontology structure of Reactome database with parent–child relationships. Each color corresponds to one ancestor pathway, as shown in the network in the upper left corner where the names of the ancestor pathways are shown. In the other networks the size of the nodes is proportional to the significance of the pathway enrichment test. The complete results are reported in Supplementary Table 3.
Figure 5
Figure 5
Selected ligand/receptor pairs connecting the modules of the AD multi-cellular network. The genes indicated in light blue encode ligands, those in dark blue encode receptors and the blue line connecting them indicates a significant-ligand receptor interaction inferred from the single cell transcriptomics data. The red lines indicate the cells producing ligands and receptors and its thickness is proportional to the cell specificity of the gene encoding the ligand/receptor.
Figure 6
Figure 6
Characterization of the drug targets identified by the drug repurposing pipeline. (a) Results of Reactome pathway enrichment analysis. Each node corresponds to one pathway and its size is proportional to the significance of the enrichment. The connections between pathways reflect the ontology structure of Reactome database with parent–child relationships. The small light green circles correspond to pathways not significantly enriched but needed to keep the network connected. The two ancestor pathways of the significantly enriched pathways are Signal Transduction (on the left) and Disease (on the right). (b) Detailed visualization of the genes belonging to MAPK-related Reactome pathways. (c) Chart showing the cell networks in which the targets belonging to the MAPK pathways were identified as significantly proximal to AD modules. The corresponding AD module is indicated in parenthesis next to the cell name. (d) Cell specificity of the targets belonging to the MAPK pathways. (e) Average expression in each cell of the targets belonging to the MAPK pathways.

Similar articles

Cited by

References

    1. Masters CL, et al. Alzheimer’s disease. Nat. Rev. Dis. Prim. 2015;1:15056. doi: 10.1038/nrdp.2015.56. - DOI - PubMed
    1. Sims R, Hill M, Williams J. The multiplex model of the genetics of Alzheimer’s disease. Nat. Neurosci. 2020;23:311–322. doi: 10.1038/s41593-020-0599-5. - DOI - PubMed
    1. Liu CC, Kanekiyo T, Xu H, Bu G. Apolipoprotein e and Alzheimer disease: Risk, mechanisms and therapy. Nat. Rev. Neurol. 2013;9:106–118. doi: 10.1038/nrneurol.2012.263. - DOI - PMC - PubMed
    1. Zhang Q, et al. Risk prediction of late-onset Alzheimer’s disease implies an oligogenic architecture. Nat. Commun. 2020;11:4799. doi: 10.1038/s41467-020-18534-1. - DOI - PMC - PubMed
    1. Andrews SJ, Fulton-Howard B, Goate A. Interpretation of risk loci from genome-wide association studies of Alzheimer’s disease. Lancet Neurol. 2020;19:326–335. doi: 10.1016/S1474-4422(19)30435-1. - DOI - PMC - PubMed

Publication types