. 2023 Jan;8(1):162-173.
doi: 10.1038/s41564-022-01275-w. Epub 2023 Jan 5.

Metavirome of 31 tick species provides a compendium of 1,801 RNA virus genomes

Affiliations

Metavirome of 31 tick species provides a compendium of 1,801 RNA virus genomes

Xue-Bing Ni et al. Nat Microbiol. 2023 Jan.

Abstract

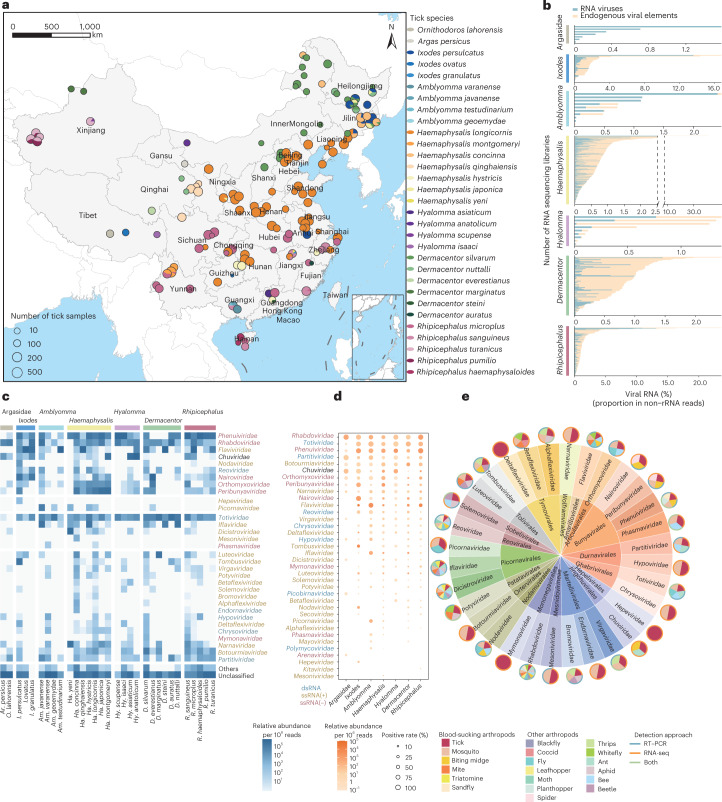
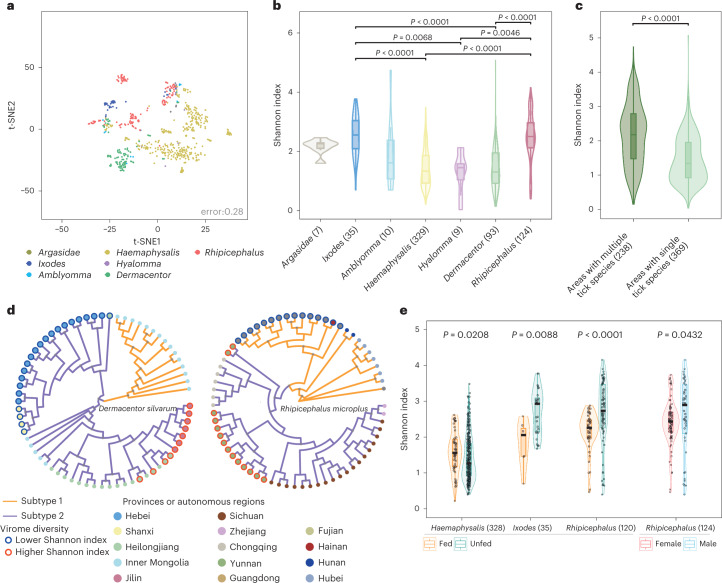
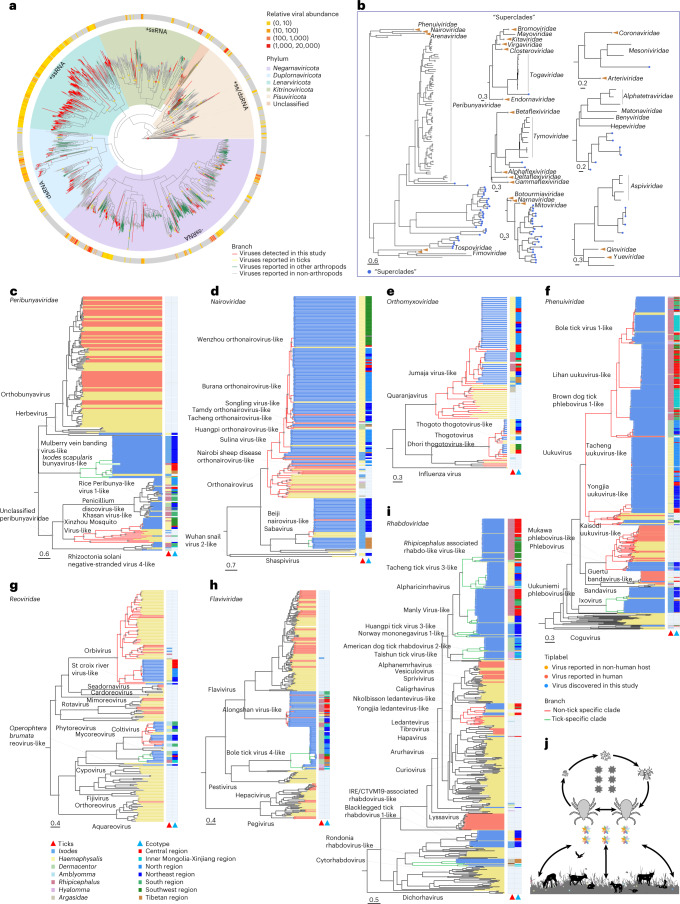
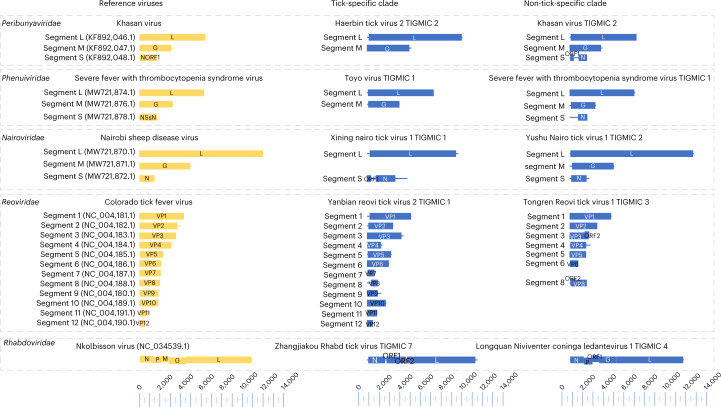
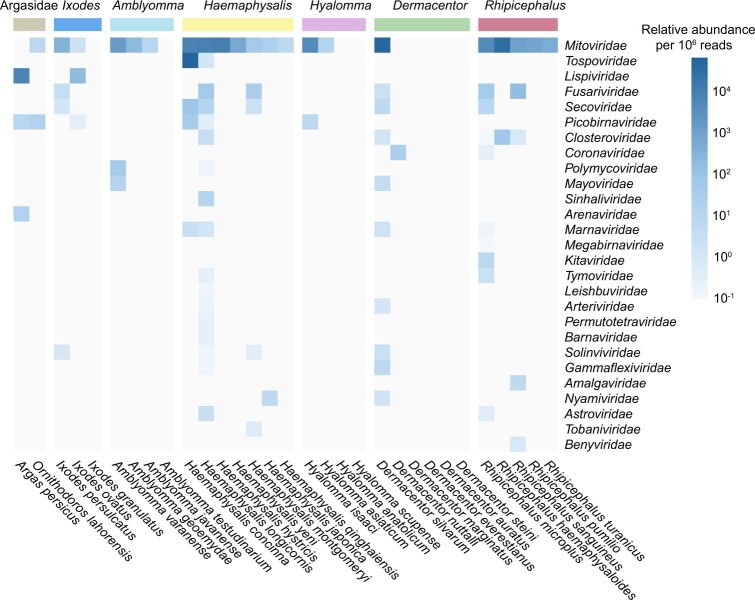
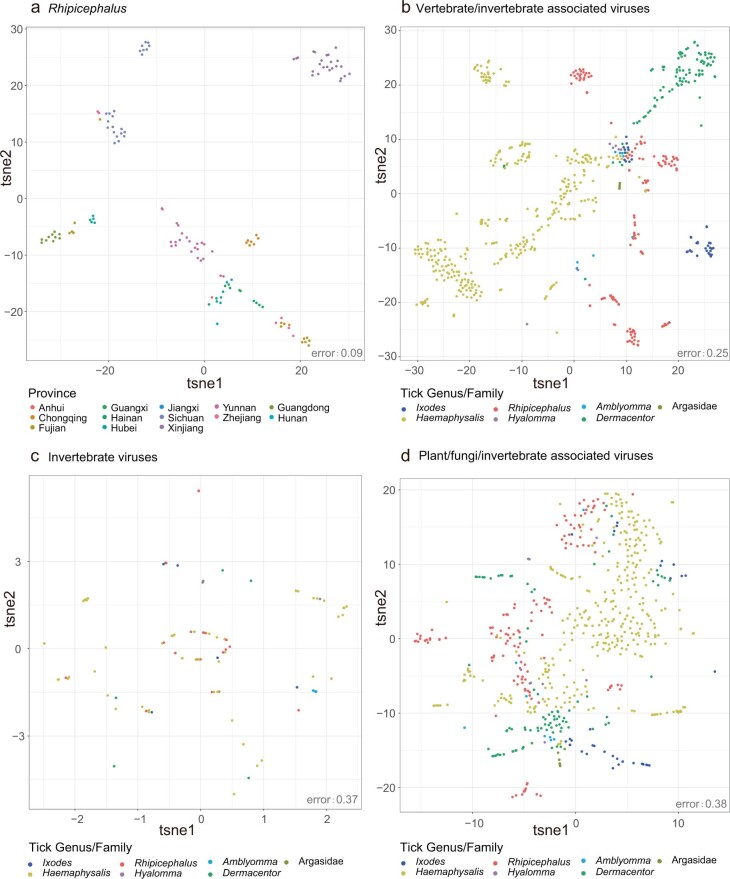
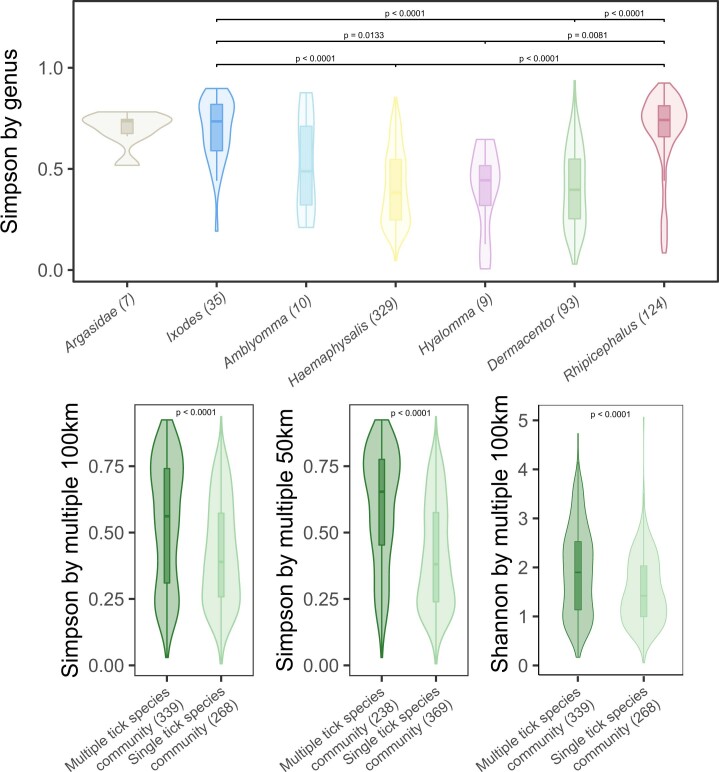
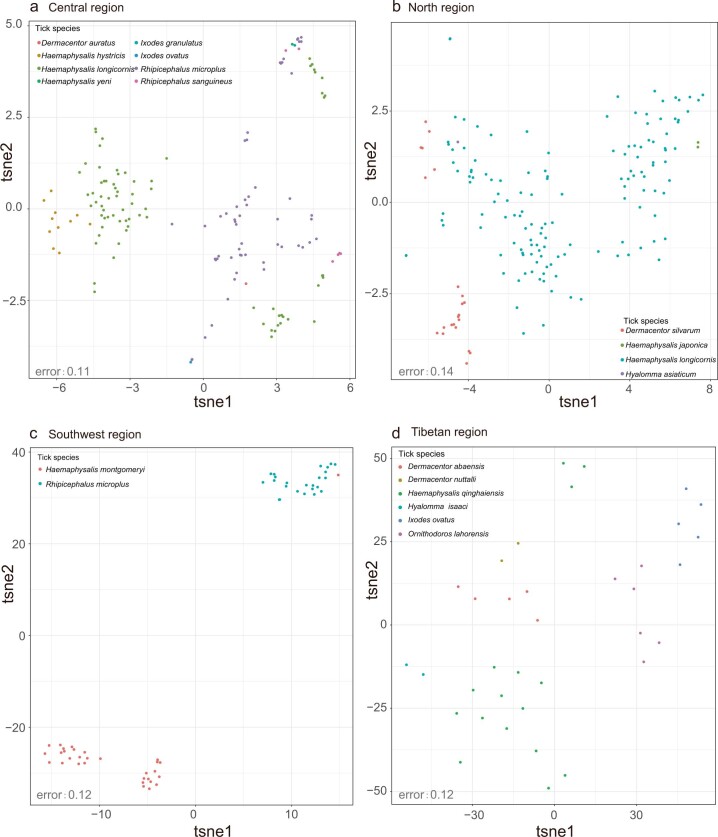
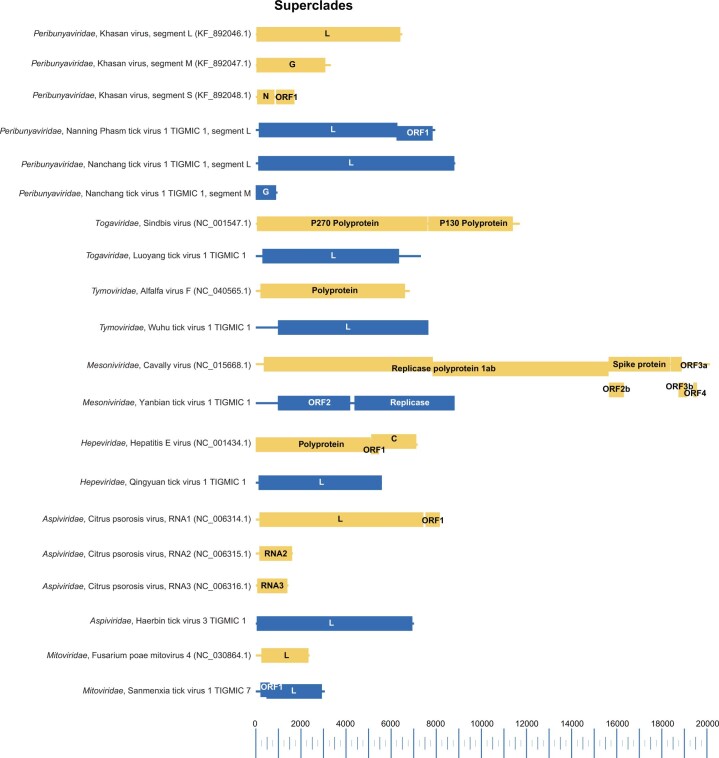
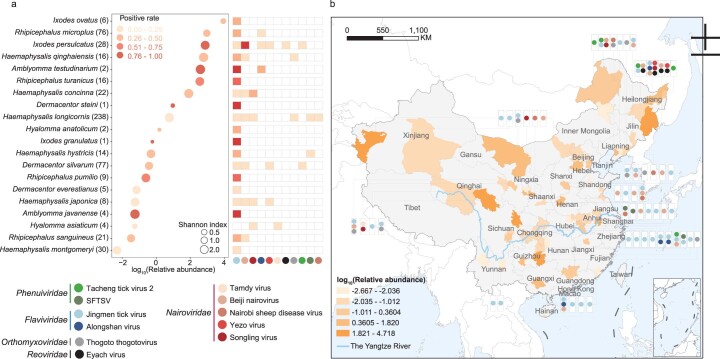
The increasing prevalence and expanding distribution of tick-borne viruses globally have raised health concerns, but the full repertoire of the tick virome has not been assessed. We sequenced the meta-transcriptomes of 31 different tick species in the Ixodidae and Argasidae families from across mainland China, and identified 724 RNA viruses with distinctive virome compositions among genera. A total of 1,801 assembled and complete or nearly complete viral genomes revealed an extensive diversity of genome architectures of tick-associated viruses, highlighting ticks as a reservoir of RNA viruses. We examined the phylogenies of different virus families to investigate virome evolution and found that the most diverse tick-associated viruses are positive-strand RNA virus families that demonstrate more ancient divergence than other arboviruses. Tick-specific viruses are often associated with only a few tick species, whereas virus clades that can infect vertebrates are found in a wider range of tick species. We hypothesize that tick viruses can exhibit both 'specialist' and 'generalist' evolutionary trends. We hope that our virome dataset will enable much-needed research on vertebrate-pathogenic tick-associated viruses.


Conflict of interest statement

The authors declare no competing interests.

Figures

Fig. 1
Fig. 1. Overview of the tick virome.
a, Geographic map of sample collections. The size of the circle represents the number of tick samples collected in the area. Each sampling site was geo-referenced to the Chinese map on the basis of its latitude and longitude. b, The proportion of viral RNA reads in non-ribosome reads among ticks in family Argasidae and six genera of the family Ixodidae. c, The relative abundance of the top 32 viral families (>1 per ten thousand viral reads in any tick species) detected in each tick species. d, The relative virus abundances (viral read counts per million non-rRNA reads in each library) and positive rates of the top 20 viral families among ticks in the family Argasidae and six genera of the family Ixodidae. e, Comparison between viral families detected in our ticks and those previously reported in other arthropods. The detection approaches for viral families in other arthropods include RT–PCR, RNA-seq or both.
Fig. 2
Fig. 2. Factors shaping the tick virome.
a, Between-group clustering of viromes among ticks in the family Argasidae and six genera of the family Ixodidae by t-SNE analysis. b, Shannon indexes of α diversity of tick viromes. Statistical significance was determined by two-sided Kruskal–Wallis test for multiple comparison, with P values adjusted by the Bonferroni method. c, Shannon indexes of tick viromes were compared between areas with two or more tick species and those with single tick species within a radius of 50 km. The P value was determined by two-sided Mann–Whitney U test. d, Maximum-likelihood phylogeny of genetic populations for Dermacentor silvarum and Rhipicephalus microplus. Lineages of each tick species were classified on the basis of nuclear single-nucleotide polymorphisms from the transcriptome data. Bootstrap values above 0.8 are indicated by grey asterisks. The outer colour of dots represents virome diversity: red, higher Shannon index; blue, lower Shannon index. The inner colour of dots indicates the location of the tick collection. e, Shannon indexes of tick viromes were compared between fed and unfed ticks of Haemaphysalis, Ixodes and Rhipicephalus genera. The indexes were compared between female and male ticks of the genus Rhipicephalus. The P value was determined by two-sided Mann–Whitney U test. Sample numbers are marked in brackets. Boxplot elements: centre line, median; box limits, upper and lower quartiles; whiskers (error bars), the highest and lowest points within 1.5× interquartile range of the upper and lower quartiles. Source data
Fig. 3
Fig. 3. Phylogenetic analysis of tick-associated viruses.
a, The maximum-likelihood phylogeny of RNA viruses of five phyla. The outside circle represents the relative abundance estimated by read counts per million non-rRNA reads. Parental nodes of viral families are marked with yellow asterisks, while families in which tick viruses possessed a more ancestral position than other arthropod viruses are marked with red asterisks . b, Order-level phylogenic trees of seven RNA virus ‘superclades’ distinct from the defined viral families. ci, Family-level phylogenic trees of seven arboviral families. Scale bar, amino acid substitutions per site. Bootstrap values above 0.8 are shown with grey asterisks. The phylogenetic clades of viruses only found in ticks (‘tick-specific clades’) are coloured green, while those of viruses whose host range includes vertebrates and ticks (‘non-tick-specific clades’) are highlighted in red. j, The ecosystem of the tick’s life cycle and transmission of tick-associated viruses. The grey viruses inside the tick life cycle represent tick-specific viruses. The multicolour viruses between tick and animal hosts or living in the environment indicate non-tick-specific clades of viruses.
Fig. 4
Fig. 4. Genome structure of tick-associated viruses.
The genomes are drawn to a unified length scale. Reference viruses and viruses discovered in this study are highlighted in yellow and blue, respectively. The bottom scale indicates the length of nucleotides. L, RNA-dependent RNA polymerase; G, glycoprotein; M, matrix protein; N, nucleoprotein; VP, viral protein; P, phosphoprotein.
Extended Data Fig. 1
The heatmap of relative abundance for the remaining viral families.
Extended Data Fig. 2
tsne analysis of (a) Rhipicephalus; (b) vertebrate/invertebrate associated viruses, invertebrate specific viruses, and plant/fungi/invertebrate associated viruses.
Extended Data Fig. 3
Alpha diversity of tick virome among different genera and multiple/single communities. a, Statistical significance was determined by two-sided Kruskal–Wallis test for multiple comparison with p values adjusted by the Bonferroni method. b, The p value was determined by two-sided Mann–Whitney U test. Boxplot elements: centre line, median; box limits, upper and lower quartiles; whiskers (error bars), the highest and lowest points within 1.5 interquartile range of the upper and lower quartiles. Source data
Extended Data Fig. 4
tsne analysis of tick virome of same ecogeographical regions.
Extended Data Fig. 5
Alpha diversity of tick virome of each genus by gender and feeding status. The p value was determined by two-sided Mann–Whitney U test. Boxplot elements: centre line, median; box limits, upper and lower quartiles; whiskers (error bars), the highest and lowest points within 1.5 interquartile range of the upper and lower quartiles. Source data
Extended Data Fig. 6
Genome structure of ‘non-tick-specific clades viruses’ and ‘tick-specific viruses’ detected in this study. The genomes are drawn to a unified length scale. Reference viruses and viruses discovered in this study are highlighted with yellow and blue respectively. The bottom scale indicates the length of nucleotides. L: RNA-dependent RNA polymerase; G: glycoprotein; M: matrix protein; N: nucleoprotein; VP, viral protein; P: phosphoprotein; C: coat/capsid protein.
Extended Data Fig. 7
Genome structure of representative viruses for viral families detected in this study. The genomes are drawn to a unified length scale. Reference viruses and viruses discovered in this study are highlighted with yellow and blue respectively. The bottom scale indicates the length of nucleotides. L: RNA-dependent RNA polymerase; G: glycoprotein; M: matrix protein; N: nucleoprotein; VP: viral protein; P: phosphoprotein; C: coat/capsid protein.
Extended Data Fig. 8
Genome structure of representative viruses for viral families detected in this study. The genomes are drawn to a unified length scale. Reference viruses and viruses discovered in this study are highlighted with yellow and blue respectively. The bottom scale indicates the length of nucleotides. L: RNA-dependent RNA polymerase; G: glycoprotein; M: matrix protein; N: nucleoprotein; VP: viral protein; P: phosphoprotein; C: coat/capsid protein.
Extended Data Fig. 9
Genome structure of viruses classified into superclades detected in this study. The genomes are drawn to a unified length scale. Reference viruses and viruses discovered in this study are highlighted with yellow and blue respectively. The bottom scale indicates the length of nucleotides. L: RNA-dependent RNA polymerase; G: glycoprotein; M: matrix protein; N: nucleoprotein; VP: viral protein; P: phosphoprotein; C: coat/capsid protein.
Extended Data Fig. 10
Epidemiology and human infection potential of tick-associated viruses. a, The abundances and positive rates of 11 known tick-borne RNA viral pathogens in different tick species collected in this study. The tick species are sorted by the relative abundance of detected known viral pathogens, which were estimated by read counts per million non-rRNA reads. The color of circles indicates the overall positive rate of 11 known tick-borne viral pathogens, while the color of square indicates the positive rate of each virus detected in tick species respectively. The size of circles represents the Shannon index of 9 detected viral families (Flaviviridae, Nairoviridae, Phenuiviridae, Rhabdoviridae, Peribunyaviridae, Reoviridae, Orthomyxoviridae, Chuviridae and Nodaviridae). b, Geographic distribution of 11 known tick-borne viral pathogens in China.

References

    1. Babayan SA, Orton RJ, Streicker DG. Predicting reservoir hosts and arthropod vectors from evolutionary signatures in RNA virus genomes. Science. 2018;362:577–580. doi: 10.1126/science.aap9072. - DOI - PMC - PubMed
    1. Sonenshine, D. E. & Roe, M. R. Biology of Ticks Vol. 2 (Oxford Univ. Press, 2014).
    1. Paules CI, Marston HD, Bloom ME, Fauci AS. Tickborne diseases - confronting a growing threat. N. Engl. J. Med. 2018;379:701–703. doi: 10.1056/NEJMp1807870. - DOI - PubMed
    1. Zhao L, et al. Distribution of Haemaphysalis longicornis and associated pathogens: analysis of pooled data from a China field survey and global published data. Lancet Planet. Health. 2020;4:e320–e329. doi: 10.1016/S2542-5196(20)30145-5. - DOI - PubMed
    1. Xu L, et al. Tick virome diversity in Hubei Province, China, and the influence of host ecology. Virus Evol. 2021;7:veab089. doi: 10.1093/ve/veab089. - DOI - PMC - PubMed

Publication types