. 2023 Jan;29(1):170-179.
doi: 10.1038/s41591-022-02112-7. Epub 2023 Jan 5.

Pharmacotypes across the genomic landscape of pediatric acute lymphoblastic leukemia and impact on treatment response

Affiliations

Pharmacotypes across the genomic landscape of pediatric acute lymphoblastic leukemia and impact on treatment response

Shawn H R Lee et al. Nat Med. 2023 Jan.

Abstract

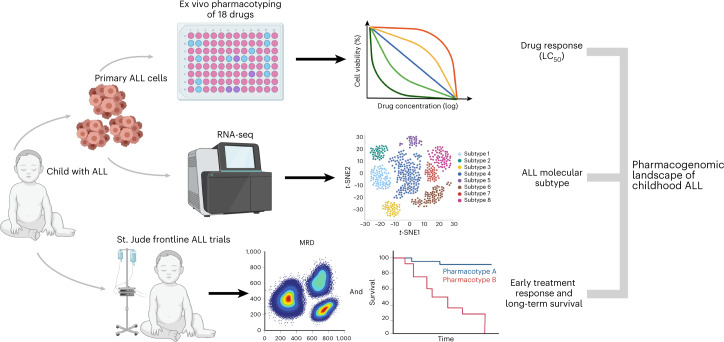
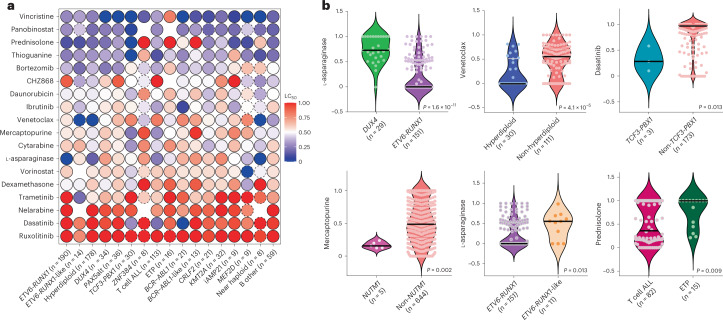
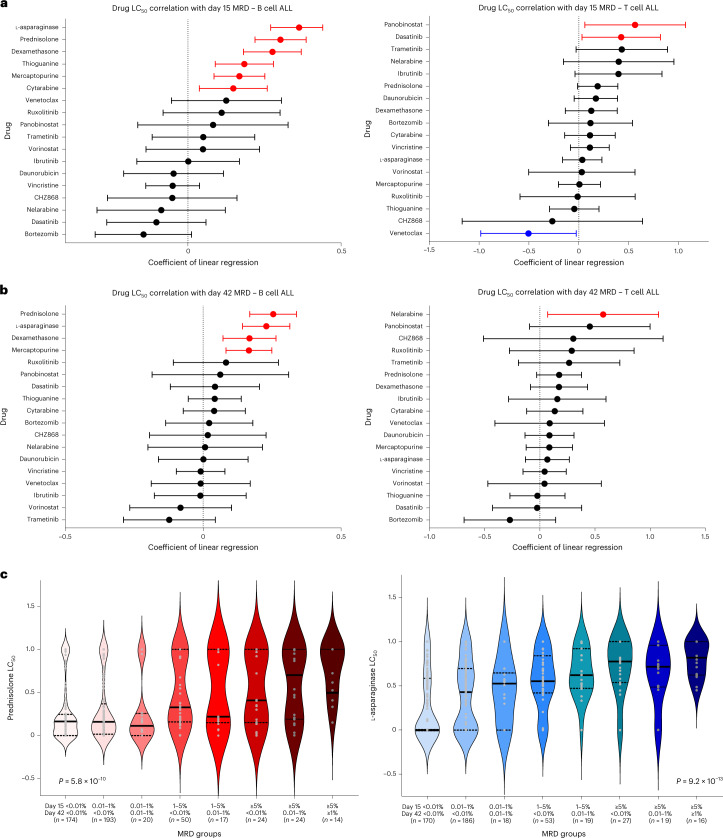
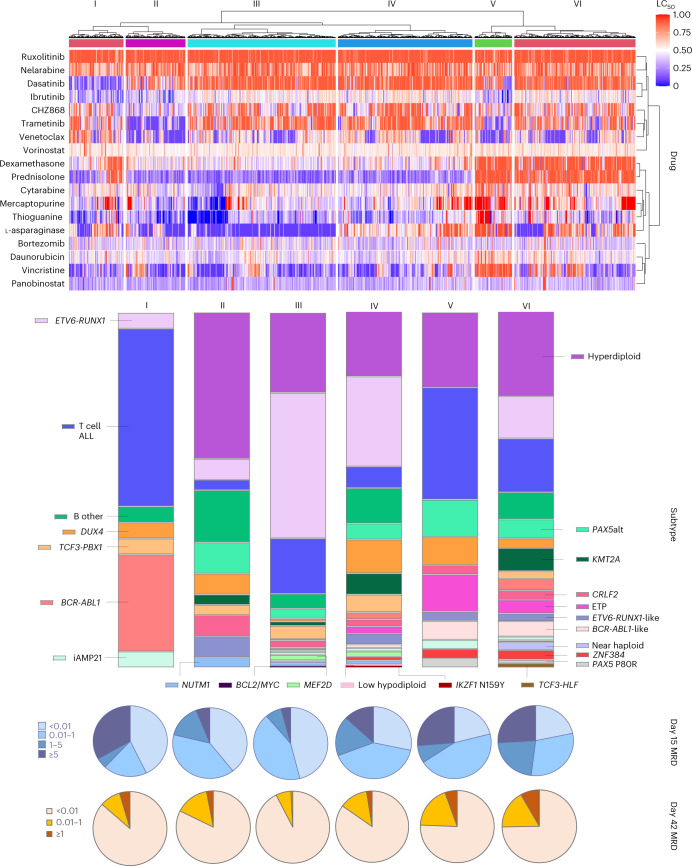
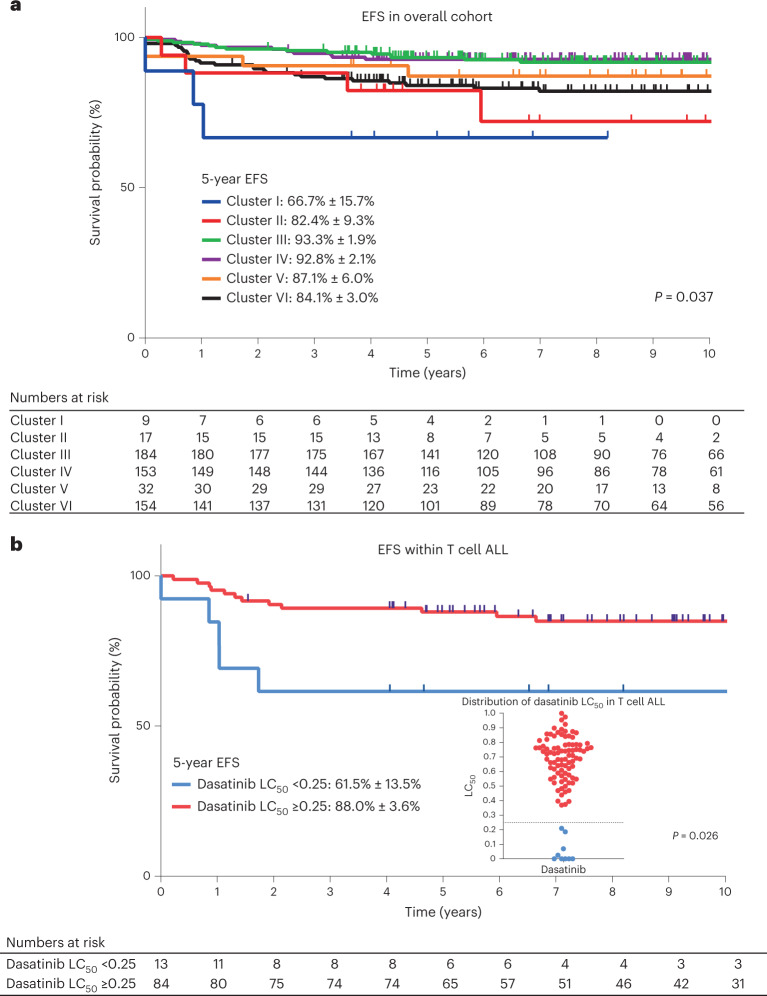
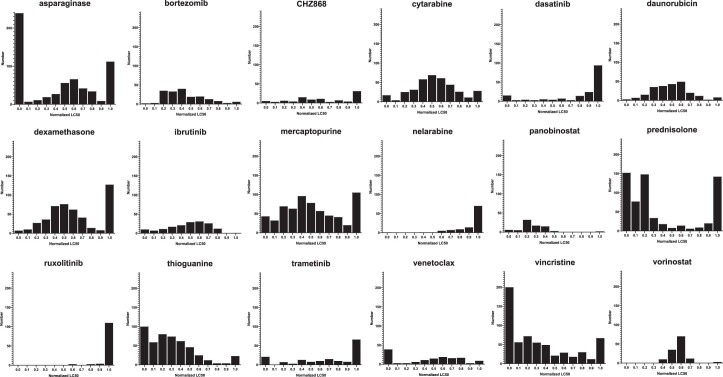
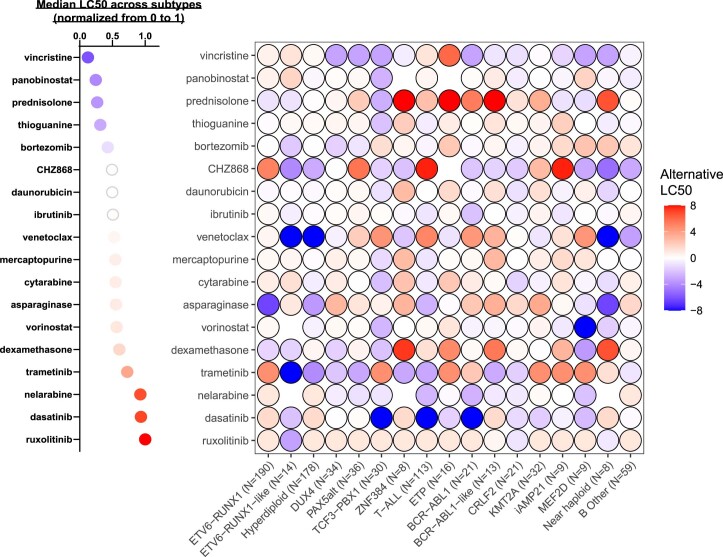
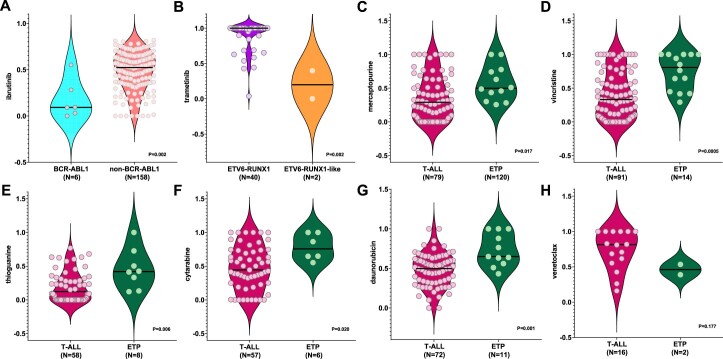
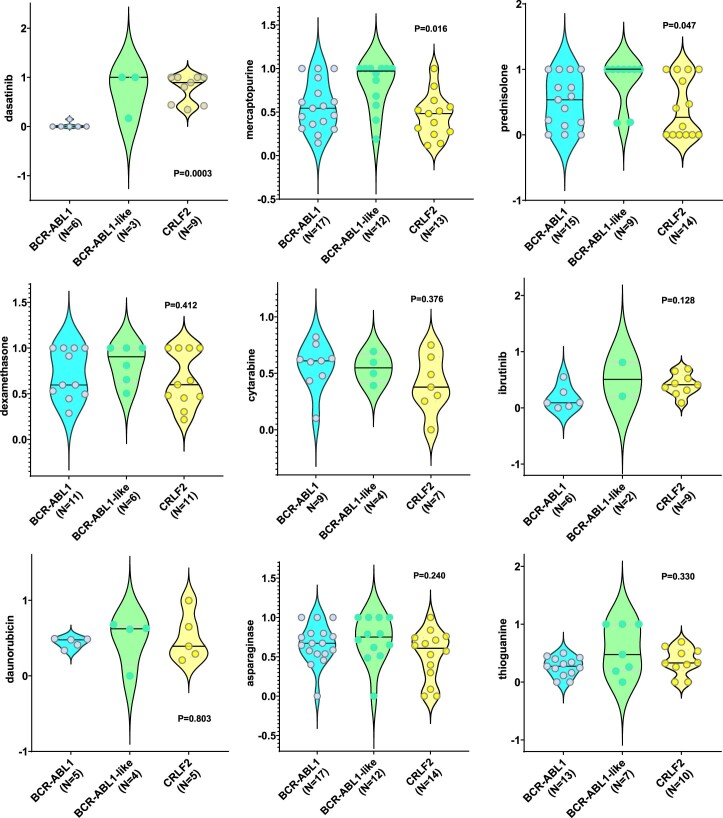
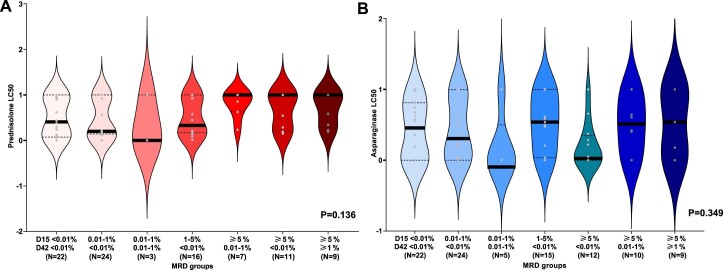
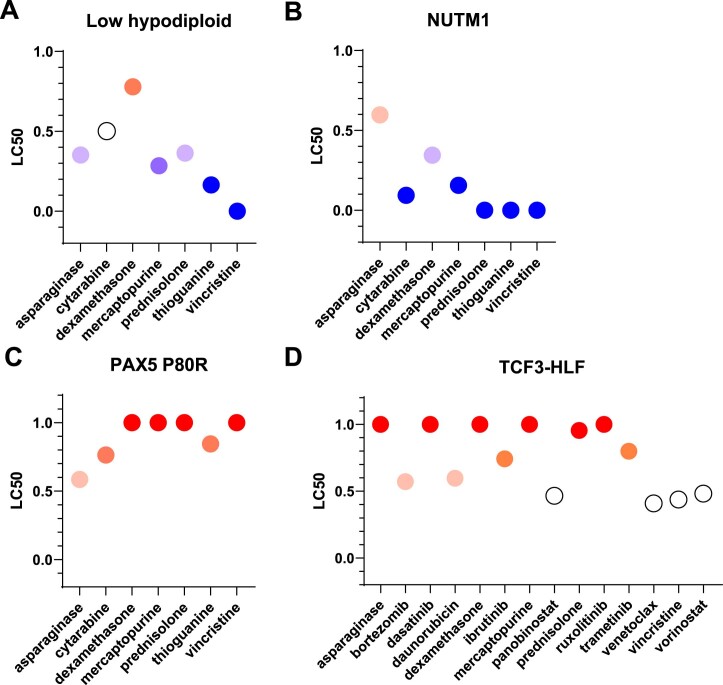
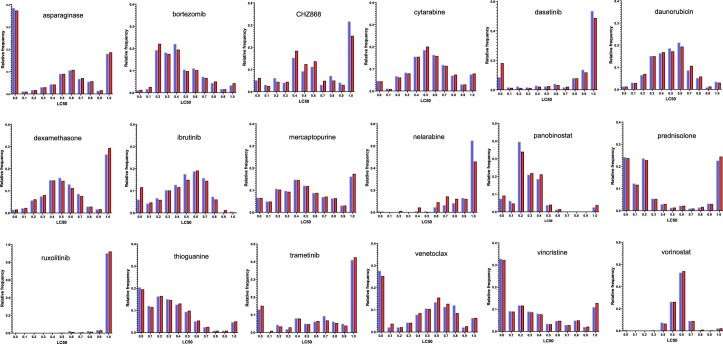
Contemporary chemotherapy for childhood acute lymphoblastic leukemia (ALL) is risk-adapted based on clinical features, leukemia genomics and minimal residual disease (MRD); however, the pharmacological basis of these prognostic variables remains unclear. Analyzing samples from 805 children with newly diagnosed ALL from three consecutive clinical trials, we determined the ex vivo sensitivity of primary leukemia cells to 18 therapeutic agents across 23 molecular subtypes defined by leukemia genomics. There was wide variability in drug response, with favorable ALL subtypes exhibiting the greatest sensitivity to L-asparaginase and glucocorticoids. Leukemia sensitivity to these two agents was highly associated with MRD although with distinct patterns and only in B cell ALL. We identified six patient clusters based on ALL pharmacotypes, which were associated with event-free survival, even after adjusting for MRD. Pharmacotyping identified a T cell ALL subset with a poor prognosis that was sensitive to targeted agents, pointing to alternative therapeutic strategies. Our study comprehensively described the pharmacological heterogeneity of ALL, highlighting opportunities for further individualizing therapy for this most common childhood cancer.


Conflict of interest statement

W.E.E. reports serving as a member of the scientific advisory board for Princess Maxima Centre for Childhood Cancer and serving as a board member for BioSkryb Genomics, neither of which pertain to the submitted work. C.G.M. reports receiving grants from Pfizer and AbbVie and personal fees from Amgen and Illumina outside the submitted work. J.J.Y. reports receiving research funding from Takeda Pharmaceutical Company outside the submitted work and having a patent pending for Methods for Determining Benefit of Chemotherapy. The other authors declare no competing interests.

Figures

Fig. 1
Fig. 1. Schematic overview of ALL pharmacotyping, molecular subtyping and evaluation of treatment response.
To comprehensively characterize the relationship between drug sensitivity profiles and in vivo treatment response, we performed ex vivo pharmacotyping of 18 drugs on primary ALL cells from 805 patients treated on the St. Jude Total Therapy XV, XVI and XVII trials. Drug profiling was performed via MTT assay or MSC co-culture with flow cytometry, where we evaluated the LC50 of each drug (dose required to kill 50% of leukemia cells). We also performed RNA-seq for each patient to determine the molecular subtype. Additionally, as part of each therapeutic trial, every patient had mid-induction (day 15) or post-induction (day 42) MRD determined as a measure of in vivo treatment response to chemotherapy. We then performed integrated analyses of drug sensitivities, somatic genomics, MRD and long-term survival outcomes to characterize the pharmacogenomic landscape of childhood ALL. This figure was created using BioRender.com.
Fig. 2
Fig. 2. Leukemia drug sensitivities across ALL molecular subtypes.
a, The median LC50 of 18 leukemia drugs are shown for each individual molecular subtype. Low LC50 values (that is, higher drug sensitivity) are shown in blue and high LC50 values (that is, higher drug resistance) are shown in red. Circles with a dashed line indicate that only a single case with that subtype was tested for that drug. Missing/untested drugs are indicated as empty circles. With the exception of panobinostat, ruxolitinib, bortezomib and daunorubicin, the remaining 14 drugs demonstrated significant inter-subtype variability (P < 0.05 nominally and also after Benjamini–Hochberg correction). b, Drug LC50 distribution is shown in violin plots comparing between selected subtypes. The median LC50 for each subtype is shown as a bold black line. The number of patients in each category is indicated in parenthesis and represents biologically independent samples. Nominal P values comparing LC50 values are as shown and were determined by two-sided Mann–Whitney U-test. Source data
Fig. 3
Fig. 3. Correlation of ALL drug sensitivities with MRD during induction therapy.
a,b, Forest plots depict drug LC50 correlation with day 15 MRD (B cell ALL, n = 671 patients; T cell ALL, n = 105 patients, representing biologically independent samples) (a) and day 42 MRD (B cell ALL, n = 669; T cell ALL, n = 105, representing biologically independent samples) (b). Left, Correlations with B cell ALL. Right, Correlations with T cell ALL. The coefficient of linear regression between each drug and MRD at each time point is shown as solid dots, with the 95% CIs indicated by the horizontal bars. Each unit change in coefficient represents a unit change of MRD (log10-transformed), that is, a coefficient of 1.0 represents a tenfold increase in MRD. Significant positive correlations are shown in red, negative correlations are shown in blue and those not reaching statistical significance are shown in black. c, Association of longitudinal MRD with B cell ALL sensitivity to prednisolone and L-asparaginase. LC50 of prednisolone (left, shades of pink/red) and L-asparaginase (right, shades of blue/teal) are plotted for 8 groups with different combinations of day 15 and day 42 MRD. The median LC50 of each group is shown as a bold horizontal black line for each violin plot, with the number of patients (biologically independent samples) in each category shown in parenthesis. In this study, the LC50 of both drugs increase progressively across MRD groups with rising MRD levels (P = 5.8 × 10−10 for prednisolone and P = 9.2 × 10−13 for L-asparaginase, determined by two-sided Kruskal–Wallis test). Additionally, the pattern of influence appears to differ between both drugs. Prednisolone LC50 was strikingly higher in MRD groups comprising high levels of MRD positivity but was relatively equal for MRD groups with low or no MRD. By contrast, L-asparaginase LC50 was strikingly lower only at complete day 15 and day 42 MRD negativity but was relatively equal for MRD groups with any degree of MRD positivity. Source data
Fig. 4
Fig. 4. Drug sensitivity profile defines distinct ALL patient clusters.
Hierarchical clustering revealed six taxonomic groups with distinct patterns of drug sensitivity, as shown on the heatmap. Hierarchical clustering of patients was performed based on all imputed LC50 values using Manhattan distance measure. Each patient received a cluster assignment for each round of imputation. Patients were assigned to a final cluster if that cluster assignment appeared in the same cluster for at least five of ten rounds of imputation. Each vertical block of the heatmap corresponds to a cluster, numbered I to VI. The heatmap depicts higher drug sensitivity in blue and higher drug resistance in red. The distribution of subtypes within each cluster is shown as bar graphs. MRD at days 15 and 42 of each cluster are indicated by the pie charts below the heatmap. Source data
Fig. 5
Fig. 5. Association of drug sensitivity profiles with EFS.
a, EFS across 6 drug sensitivity clusters in the entire cohort (n = 549) (a) and EFS across 2 dasatinib sensitivity groups in T cell ALL (n = 97) (b). Kaplan–Meier curves were plotted for each drug sensitivity group and the 5-year EFS with s.e. are shown in the figure. The numbers of patients at risk are shown beneath each graph. Each cluster is represented by a different color. b, The dasatinib-resistant group (LC50 ≥ 0.25) is indicated in red and the dasatinib-sensitive group (LC50 < 0.25) is indicated in blue. The dot plot in b demonstrates the distribution of dasatinib LC50 in patients with T cell ALL, with the horizontal dotted line shown at 0.25. P values were determined by two-sided Cox proportional-hazards regression test and adjusted for treatment arm.
Extended Data Fig. 1
Extended Data Fig. 1. Overall patterns of drug LC50s.
Drug sensitivities for each drug were normalized into a range from 0.0 to 1.0 as described in Methods. For each drug, the distribution of frequencies for each interval of 0.1 is plotted in a histogram. Overall, there is a wide range of distribution patterns in this patient cohort. Source data
Extended Data Fig. 2
Extended Data Fig. 2. Leukemia drug sensitivities across ALL molecular subtypes by alternative normalization method.
To take into account the different concentration ranges measured for different drugs and the difference in their dose-dependent cytotoxicity, an alternative normalization method calculated by log2(fold-change from the median) is plotted as shown in the heatmap on the right. The dot plot on the left shows the corresponding median LC50s for each drug as calculated by the original method of normalization (as shown in main Fig. 2a). Source data
Extended Data Fig. 3
Extended Data Fig. 3. Drug LC50s comparing between ALL subtypes.
(a) Ibrutinib in BCR-ABL1 vs non-BCR-ABL1 (b) Trametinib in ETV6-RUNX1 vs ETV6-RUNX1-like (c) Mercaptopurine in T-ALL vs ETP-ALL (d) Vincristine in T-ALL vs ETP-ALL (e) Thioguanine in T-ALL vs ETP-ALL (f) Cytarabine in T-ALL vs ETP-ALL (g) Daunorubicin in T-ALL vs ETP-ALL (h) Venetoclax in T-ALL vs ETP-ALL Drug LC50s are plotted in a violin plot for selected subtypes. The median LC50 for each subtype is shown as a bold black line. The number of patients in each category is indicated in parenthesis and represents biologically independent samples. Nominal P values comparing LC50s are as shown and determined by the 2-sided Mann-Whitney test. Source data
Extended Data Fig. 4
Extended Data Fig. 4. Drug LC50s comparing BCR-ABL1, BCR-ABL1-like, and CRLF2-r ALL.
Drug LC50s are plotted in violin plots for these three subtypes. The median LC50 for each subtype is shown as a bold black line. The number of patients in each category is indicated in parenthesis and represents biologically independent samples. Amongst the 3 BCR-ABL1-like cases tested for dasatinib, 2 harbored ABL class fusions (one with PDGFRB, and one with CSFR1). Nominal P-values are as shown and determined by 2-sided Kruskal-Wallis test. Source data
Extended Data Fig. 5
Extended Data Fig. 5. Association of longitudinal minimal residual disease with T-ALL sensitivity to prednisolone and asparaginase.
LC50s of each drug are plotted in the violin plots for each combination of D15 and D42 MRD categories. Median LC50s of each group is shown as a bold horizontal black line for each violin plot, with the number of patients (biologically independent samples) in each category indicated. Prednisolone is shown in panel A in shades of pink/red, while asparaginase is shown in panel B in shades of blue. Unlike B-ALL, prednisolone and asparaginase are not correlated with MRD. P-values are nominal and determined by the 2-sided Kruskal-Wallis test. Source data
Extended Data Fig. 6
Extended Data Fig. 6. Drug LC50s of rare subtypes.
(a) Low hypodiploid (b) NUTM1 (c) PAX5 P80R (d) TCF3-HLF LC50 of these four subtypes are plotted for drugs tested. Higher sensitivity is indicated in blue and higher resistance is indicated in red. Source data
Extended Data Fig. 7
Extended Data Fig. 7. Distribution of measured vs. imputed drug LC50s.
Histogram plots of LC50 distributions of measured (blue) vs imputed (red) values are shown for each drug. There are no statistically significant differences between distribution of both datasets (2-sided Chi-square test with Benjamini-Hochberg correction). Source data

References

    1. Gu Z, et al. PAX5-driven subtypes of B-progenitor acute lymphoblastic leukemia. Nat. Genet. 2019;51:296–307. doi: 10.1038/s41588-018-0315-5. - DOI - PMC - PubMed
    1. O’Connor D, et al. Genotype-specific minimal residual disease interpretation improves stratification in pediatric acute lymphoblastic leukemia. J. Clin. Oncol. 2018;36:34–43. doi: 10.1200/JCO.2017.74.0449. - DOI - PMC - PubMed
    1. Hunger SP, Mullighan CG. Acute lymphoblastic leukemia in children. N. Engl. J. Med. 2015;373:1541–1552. doi: 10.1056/NEJMra1400972. - DOI - PubMed
    1. Jeha S, et al. Clinical significance of novel subtypes of acute lymphoblastic leukemia in the context of minimal residual disease-directed therapy. Blood Cancer Discov. 2021;2:326–337. doi: 10.1158/2643-3230.BCD-20-0229. - DOI - PMC - PubMed
    1. Pui C-H, et al. Clinical utility of sequential minimal residual disease measurements in the context of risk-based therapy in childhood acute lymphoblastic leukaemia: a prospective study. Lancet Oncol. 2015;16:465–474. doi: 10.1016/S1470-2045(15)70082-3. - DOI - PMC - PubMed

Publication types

MeSH terms