. 2023 Jan;29(1):258-269.
doi: 10.1038/s41591-022-02110-9. Epub 2023 Jan 5.

T cell receptor repertoires associated with control and disease progression following Mycobacterium tuberculosis infection

Collaborators, Affiliations

T cell receptor repertoires associated with control and disease progression following Mycobacterium tuberculosis infection

Munyaradzi Musvosvi et al. Nat Med. 2023 Jan.

Abstract

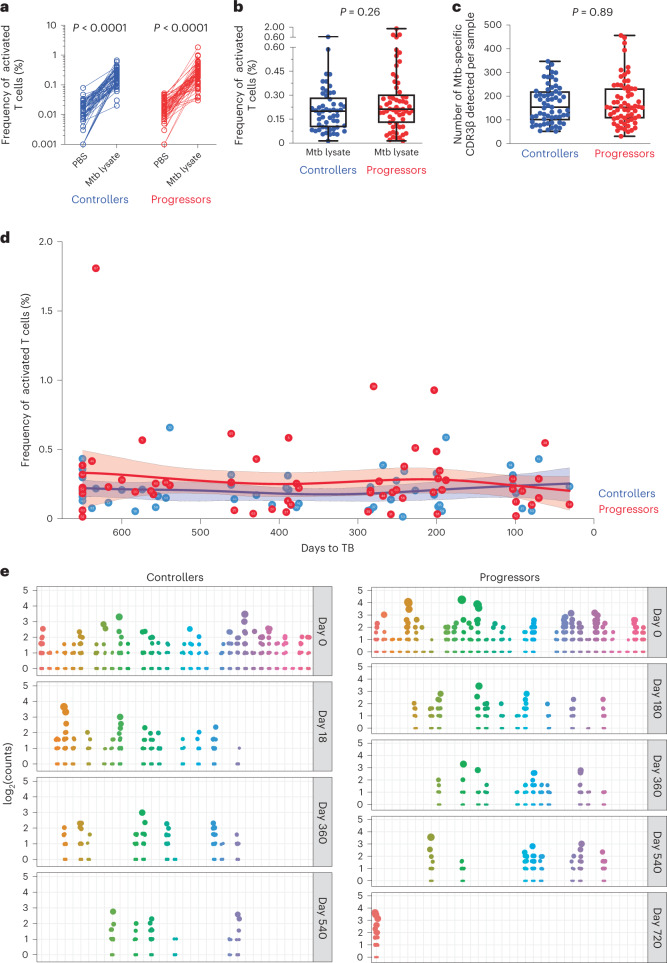
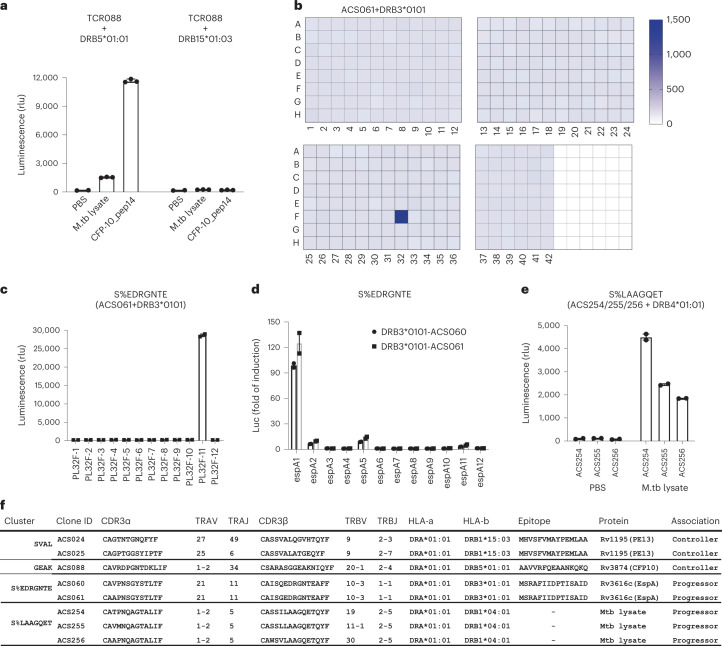
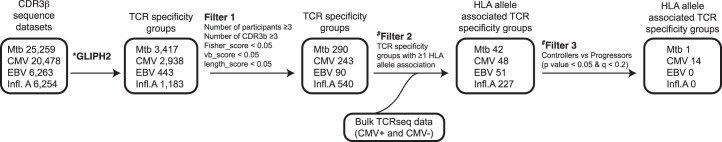
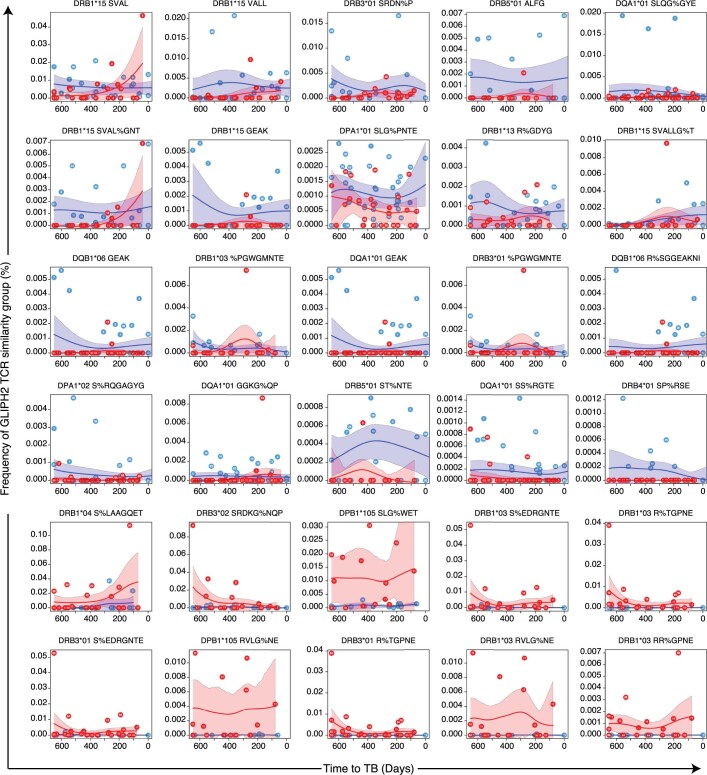
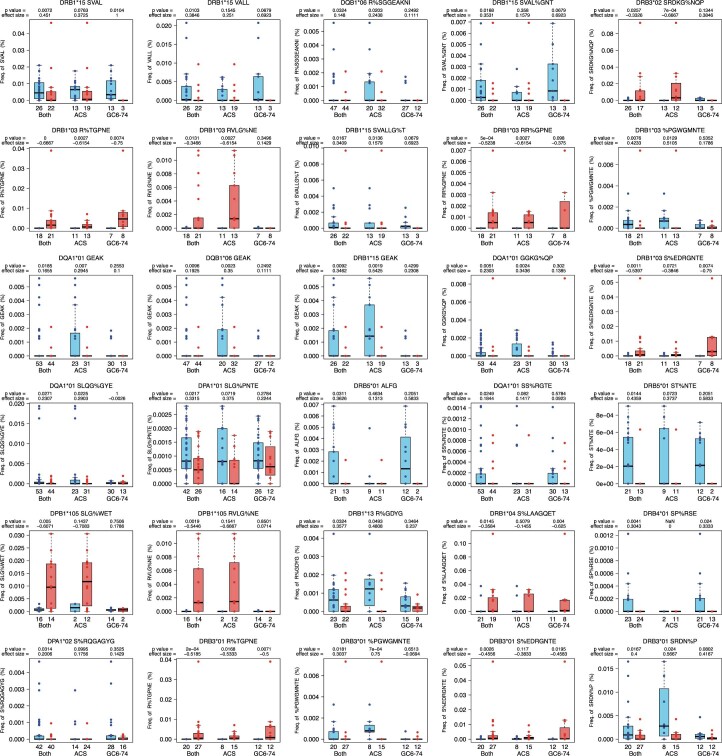
Antigen-specific, MHC-restricted αβ T cells are necessary for protective immunity against Mycobacterium tuberculosis, but the ability to broadly study these responses has been limited. In the present study, we used single-cell and bulk T cell receptor (TCR) sequencing and the GLIPH2 algorithm to analyze M. tuberculosis-specific sequences in two longitudinal cohorts, comprising 166 individuals with M. tuberculosis infection who progressed to either tuberculosis (n = 48) or controlled infection (n = 118). We found 24 T cell groups with similar TCR-β sequences, predicted by GLIPH2 to have common TCR specificities, which were associated with control of infection (n = 17), and others that were associated with progression to disease (n = 7). Using a genome-wide M. tuberculosis antigen screen, we identified peptides targeted by T cell similarity groups enriched either in controllers or in progressors. We propose that antigens recognized by T cell similarity groups associated with control of infection can be considered as high-priority targets for future vaccine development.


Conflict of interest statement

The authors declare no competing interests.

Figures

Fig. 1
Fig. 1. Identification of TCR sequences and antigens recognized by M. tuberculosis lysate-responsive T cells in controllers and progressors.
a,b, Plots depicting longitudinal study timepoints (dots) at which PBMC samples were analyzed for each individual controller (blue) or progressor (red, synchronized to TB diagnosis) in the ACS (a) or the GC6-74 cohort (b). Each horizontal line or symbol represents an individual. c, Experimental workflow and analysis approach used to identify mycobacteria-reactive CDR3αβ sequences and determine their frequencies. First, scTCR-seq was performed on sorted mycobacteria-reactive T cells expressing the activation markers CD69 and CD154 or CD137 after in vitro M. tuberculosis (M.tb) lysate stimulation. GLIPH2 analysis clustered TCR sequences expressed by mycobacteria-reactive T cells into TCR similarity groups. In parallel, bulk TCR-seq was performed on PMBCs (unstimulated) to profile the repertoire and determine the frequencies of CDR3β sequences in each sample. The total frequencies of CDR3β sequences within a GLIPH2 TCR similarity group were determined for each controller and progressor sample using the bulk TCR-seq data. For controllers and progressors with samples collected at multiple study timepoints, the total frequencies of CDR3β sequences within a TCR similarity group were determined for each timepoint. The total frequencies of CDR3β sequences within a TCR similarity group were compared in controllers and progressors. To identify antigens recognized by these antigen-specific T cells, transduced NFAT, reporter stable J76-NFATRE-luc T cell line cells expressing representative TCR-αβ chains from TCR similarity groups found to be differentially abundant in controllers and progressors were coincubated with aAPCs to screen the M. tuberculosis proteome. QFT, QuantiFERON-TB Gold.
Fig. 2
Fig. 2. Similar frequencies and counts of M. tuberculosis lysate-reactive T cells in controllers and progressors.
a, Plot showing the frequencies of T cells coexpressing CD69 and CD154 or CD69 and CD137 (activated T cells), measured by flow cytometry after PBS (negative control) or M. tuberculosis (Mtb) lysate stimulation. Each dot represents an individual sample (controllers, n = 61; progressors, n = 64). b, A plot depicting the background subtracted frequencies of activated T cells. The horizontal lines represent medians, the bounds of the boxes indicate the 25th and 75th percentiles and the whiskers represent the minima and maxima. Each dot represents an individual sample (controllers, n = 53; progressors, n = 61). The P value was calculated using the Mann–Whitney U-test (two sided). Note that some samples are from the same participant collected at different study timepoints. c, A plot depicting the numbers of detected CDR3β sequences from sorted, M. tuberculosis-specific T cells identified by TCR-seq in PBMCs from controllers and progressors in the ACS cohort. Each dot represents an individual sample (controllers, n = 61; progressors, n = 64). The horizontal lines represent medians, the bounds of the boxes indicate the 25th and 75th percentiles and the whiskers represent the minima and maxima. The P value was calculated using the Mann–Whitney U-test (two sided). Some samples are from the same participants collected at different study timepoints. d, Plot depicting the kinetics (background subtracted) of M. tuberculosis lysate-reactive T cells, measured by flow cytometry, after PBMC stimulation with M. tuberculosis lysate in controllers and progressors from the ACS cohort. Progressor samples were synchronized according to their time to TB diagnosis and controller samples were synchronized to their matched progressors. The solid lines indicate the modeled nonlinear splines and the shaded bands represent 95% CIs. e, Plots depicting clonal expansions of M. tuberculosis lysate-reactive T cells in samples from controllers and progressors at different timepoints (in days) after enrollment. Each dot represents a unique CDR3β sequence observed in a sample. The size of the dot is relative to the number of times the sequence was detected. Plots have been aligned by participant on the horizontal axis.
Fig. 3
Fig. 3. CDR3β sequences expressed on M. tuberculosis lysate-reactive T cells are enriched in lungs of patients with TB.
Frequencies of M. tuberculosis- (M.tb-), CMV-, EBV- or influenza A-specific T cell clones, measured as CDR3β sequences in matched blood (PBMCs) and resected lung samples collected from people with severe active TB disease (n = 11). The P value was computed using Wilcoxon’s signed-rank test (two sided).
Fig. 4
Fig. 4. Mycobacteria-reactive TCR similarity groups overlap considerably between controllers and progressors.
a, Heatmap depicting mycobacteria-reactive GLIPH2 TCR similarity groups (columns) identified in scTCR-seq in controllers and progressors (rows) from the ACS. The color represents the presence (blue) or absence (white) of sequences that belong to each TCR similarity group observed after M. tuberculosis lysate stimulation. Similarity groups are ranked according to their detected prevalence in progressors (right) or controllers (left). The barplot below depicts the number of donors possessing CDR3β sequences that belong to the indicated similarity group. The amino acid motif that is shared by TCR sequences clustered together is used to denote the cluster. In some instances GLIPH2 allows for a wildcard (that is, any amino acid) at a specific location within the shared motif; this is indicated by ‘%’. b, Box and whisker plots depicting the number of mycobacteria-reactive TCR similarity groups detected by scTCR-seq per 100 mycobacteria-reactive CDR3β sequences in ACS controllers and progressors. A higher value denotes greater diversity among mycobacteria-reactive CDR3β sequences. Note that not all mycobacteria-reactive CDR3β sequences fall into a similarity group. The midline represents the median, the box the interquartile range and the whiskers the 95% CI. Two-tailed Student’s t-test: P values are shown above the plot. The number of samples from controllers and progressors are indicated below each plot. c, Bar plots depicting the number of ACS controllers and progressors with or without the indicated HLA-allele. Fisher’s exact test (two sided) P values are listed above each bar.
Fig. 5
Fig. 5. Differentially abundant mycobacteria-reactive TCR similarity groups in controllers and progressors.
a, Analysis workflow used to measure the frequencies of mycobacteria-reactive- (Mtb-) or CMV-, EBV- or influenza A (Infl.A)-specific GLIPH2 TCR groups in controllers and progressors. GLIPH2 analysis was performed and the resulting GLIPH2 similarity groups were filtered initially using the criteria listed under Filter 1. TCR similarity groups with significant HLA-allele associations in the progressor/controller cohort were then selected (Filter 2). Similarity groups that were differentially abundant in controllers and progressors bearing the associated HLA-allele were identified (Filter 3). b,c, Box and whisker plots depicting frequencies of mycobacteria-reactive TCRs belonging to the indicated HLA-allele-associated TCR similarity groups that were significantly more abundant in controllers (b) or progressors (c) bearing the indicated HLA-allele. The horizontal lines represent medians, the boxes the interquartile range and the whiskers the range. The number of samples from controllers and progressors is indicated below each plot. Only clusters with a P value <0.05 (Mann–Whitney U-test, two sided) and q < 0.2 (Benjamini–Hochberg FDR) are shown. d, Frequencies of CMV- (3 of 69), EBV- (0 of 39), influenza A- (Flu-) (10 of 246) or M. tuberculosis (M.tb)-specific (30 of 175) TCR specificity group:HLA combinations that are associated with clinical outcome (significantly more abundant in either controllers or progressors), expressed as a percentage of all TCR specificity group:HLA combinations for that pathogen. The P value was calculated using Fisher’s exact test (two sided). e, Relative frequency plot of the numbers of TCR specificity group:HLA combinations found to be significantly different between the two groups. We performed permutation analyses with 1,000 iterations using randomized disease outcome labels. The vertical line represents the actual number of M. tuberculosis-specific TCR specificity group:HLA combinations found to be significantly different between controllers and progressors (30) with correct disease outcome labels. f, Frequencies of CMV- (14 of 48), EBV- (0 of 51), influenza A- (0 of 227) or M. tuberculosis (1 of 42)-specific TCR specificity group:HLA combinations that are associated with CMV infection status in a previously published cohort, expressed as a percentage of all TCR specificity group:HLA combinations for that pathogen. The P value was calculated using Fisher’s exact test (two sided).
Fig. 6
Fig. 6. Antigen discovery for mycobacteria-reactive TCR similarity groups.
a, Barplot showing the median relative luminescence signal after an 8-h PBS, M. tuberculosis (M.tb) lysate or AAVVRFQEAANKQKQ (CFP-10_p14) stimulation of TCR-ACS088 (TCR008) in the context of DRB5*01:01 or DRB1*15:03. The mean ± s.d. (n = 3 biological replicates) is shown. b, Antigen recognition screening of the whole M. tuberculosis proteome (321 subpools displayed in 3.5 plates) by TCR-transfected clone TCR-ACS061, bearing a TCR in similarity group S%EDRGNTE. The color scale indicates the relative luminescence signal after an 8-h stimulation of the clone. c, Barplot showing the deconvolution of recognition of the individual proteins from the positive subpool (PL32F), expressed separately and screened against clone TCR-ACS061. The clone was activated by PL32-F11 (Rv3616c), indicating TCR-mediated recognition. The mean (n = 2 biological replicates) is shown. rlu, relative luminescence units. d, Barplot showing resolution of the Rv3616c epitope using overlapping peptides spanning Rv3616c to identify the epitope recognized by TCR-ACS061. The mean (n = 2 biological replicates) is shown. e, Barplot depicting M. tuberculosis lysate recognition by clones TCR-ACS0254/255/256. The bar represents the median and each closed circle represents a replicate. The mean (n = 2 biological replicates) is shown. f, Table listing mycobacteria-reactive TCR similarity groups associated with controller or progressor status and their epitope targets.
Extended Data Fig. 1
Extended Data Fig. 1. CD4 T cells are the predominant responding T cell subset to M.tb lysate stimulation.
(a) Representative flow cytometry plots depicting the gating strategy used to identify and sort activated M.tb lysate-reactive T cells in PBMC stimulated with M.tb lysate. M.tb-specific T cells were defined as live CD3+, TCRαβ+ CD4+ or CD8+ T cells that co-express CD69 and CD154 or CD69 and CD137. Note the value in each plot is the percentage of parent (red) or grandparent (black). Plots depict data from M.tb lysate stimulation, PBS (negative control) and SEB (positive control) stimulations. (b) Pie chart depicting the proportions of sorted single T cells that responded to M.tb lysate stimulation by co-expressing CD69 and CD154 or CD69 and CD137, by CD4, CD8 or MAIT cell subset. (MAIT cells were defined as expressing canonical MAIT CDR3α sequences, determined using MAIT Match50). (c) Expression levels of CD26, measured as median fluorescent intensity (MFI), on sorted CD4, CD8 or MAIT cells from ACS controllers and progressors. The horizontal lines represent medians, the bounds of the boxes indicate the 25% and 75% percentile and the whiskers represent the minima and maxima. Each dot represents an individual sample and only samples with ≥10 cells were included. (d) Proportions of CD4, CD8 or MAIT cells that express the indicated mRNA transcripts in sorted T cells from ACS controllers and progressors. The horizontal lines represent medians, the bounds of the boxes indicate the 25% and 75% percentile and the whiskers represent the minima and maxima. Each dot represents an individual sample and only samples with ≥10 cells were included. A threshold of ≥5 transcript reads per cell was used to classify a cell as positive for the indicated transcript. P-value were calculated with the Mann-Whitney U test (two-sided).
Extended Data Fig. 2
Extended Data Fig. 2. The majority of M.tb TCR specificity groups contain TCRβ sequences observed in two independent single cell TCR sorting experiments.
Pie chart depicting the proportions of 3,417 M.tb TCR specificity groups, which contain TCR sequences identified by single cell TCR sequencing in both the present study and the previously published single cell TCR datasets by Glanville et al. & Huang et al. (black), or those identified only in the present study (dark grey), or reported only in the Glanville et al. & Huang et al. single cell TCR datasets (light grey).
Extended Data Fig. 3
Extended Data Fig. 3. HLA allele distributions in controllers and progressors are not different.
Bar plots depicting the number of controllers and progressors in the (a) ACS (n = 88) and (b) GC6 (n = 38) cohorts with or without the indicated HLA-allele. The Fisher’s exact test (two-sided) was used to compare proportions of HLA alleles between controllers or progressors. Some HLA loci have less participants because a few participants did not have complete HLA typing results at all class I and II loci.
Extended Data Fig. 4
Extended Data Fig. 4. Differentially abundant CMV-specific TCR similarity groups in CMV+ persons compared to CMV- persons.
Analysis workflow used to measure the frequencies of GLIPH2 TCR similarity groupings from mycobacteria-reactive (Mtb) or CMV, EBV or Influenza-A (Infl.A)-specific CDR3β sequences in CMV+ and CMV- persons. GLIPH2 analysis was performed and the resulting GLIPH2 similarity groups were filtered initially using the criteria listed under Filter 1. We then selected TCR similarity groups with significant HLA allele associations in the CMV+/CMV- cohort (Filter 2). Finally, we identified similarity groups that were differentially abundant in CMV+ and CMV- participants bearing the associated HLA allele (Filter 3).
Extended Data Fig. 5
Extended Data Fig. 5. Number of TCR clusters that pass a nominal p-value threshold in permutation analysis when disease outcome label is randomized.
Histogram showing the distribution of the number of TCR clusters identified at a nominal p value < 0.05 when controller and progressors status was randomized in permutation analyses with 1000 iterations. The vertical line on the right indicates the number of TCR clusters observed when the correct controller or progressor classification was used (33). 44 (4.4%) of the 1000 iterations exceeded 33.
Extended Data Fig. 6
Extended Data Fig. 6. Longitudinal kinetics of differentially abundant TCR similarity clusters.
Non-linear spline plots depicting the longitudinal kinetics of differentially abundant TCR similarity clusters in controllers and progressors expressing the indicated HLA allele. Samples were aligned to time to TB for progressors. For controllers, the ‘time to TB’ of their respective age-matched progressor was used. The solid lines indicate the modeled non-linear splines and the shaded bands represent 95%CI.
Extended Data Fig. 7
Extended Data Fig. 7. Frequencies of mycobacteria-reactive HLA-allele-associated TCR similarity groups in each of the the ACS and GC6-74 cohorts.
Box and whisker plots depicting frequencies of mycobacteria-reactive TCRs belonging to the indicated HLA-allele-associated TCR similarity groups that were significantly more abundant in controllers or progressors bearing the indicated HLA-allele when data from ACS and GC6-74 participants was combined, or when ACS and GC6-74 samples were assessed separately. The horizontal lines represent medians, the boxes the interquartile range and the whiskers are the range. The number of samples from controllers and progressors are indicated below each plot. The p-value (Mann-Whitney U test, two-sided) and the effect size (Cliff’s Delta) are indicated above each plot.
Extended Data Fig. 8
Extended Data Fig. 8. Considerable overlap between GLIPH2-identified TCR similarity clusters and TCRdist3-identified metaclone clusters found to be differentially abundant between controllers and progressors.
(a) Pie chart showing the proportions of differentially abundant GLIPH2 similarity clusters that shared at least one CDR3β sequence with a differentially abundant TCRdist3 metaclone cluster. (b) Histogram showing the distribution of overlap in TCR clusters with significant association with outcome obtained from GLIPH2 or tcrdist3 when the controller and progressor status was randomized 1000 times. The vertical line on the right indicates the proportion of overlap observed when the correct classification was used (34.8%), which falls at the 94.8th percentile of the 1000 permutations.
Extended Data Fig. 9
Extended Data Fig. 9. S%LAAGQET antigen discovery screen.
Barplot showing the relative luminescence signal after an 8-hour PBS or M.tb lysate stimulation of TCR-ACS254, ACS255, or ACS256 in the context of (a) DRA*01:01/DRB3*01:01, (b) DQA1*01:02/DQB1*06:02 or (c) DRA*01:01/DRB1*03:01. The mean and range (n = 2 biological replicates) is shown (d) Barplot showing the relative luminescence signal after an 8-hour PBS or Mtb300 megapool stimulation of TCR-ACS254, ACS255, or ACS256 in the context DRA*01:01/DRB4*01:01. The mean and SEM (n = 4 biological replicates) is shown (e) Antigen screening of the whole M.tb proteome (321 subpools displayed in 3.5 plates) by TCR-transfected clone TCR-ACS254. Color scale indicates the relative luminescence signal after 8-hour stimulation of the clone.
Extended Data Fig. 10
Extended Data Fig. 10. Frequencies of donor unrestricted T (DURT) cells in controllers and progressors.
Box and whisker plot showing frequencies of (a) mucosal associated invariant T (MAIT) cells, (b) γδ T cells, (c), germline-encoded mycolyl lipid-reactive (GEM) T cells, and (d) invariant natural killer T (iNKT) cells, estimated from canonical TCR CDR3α sequences in PBMC samples collected from controllers (n = 77) and progressors (n = 61). Mucosal associated invariant T cells (MAIT), gammadelta, iNKT, and germline-encoded, mycolyl lipid reactive (GEM) T cells were defined as MAIT match score >=0.95, TCRDJ gene, TCRAV10;TCRAJ18 CVVSDRGSTLGRLYF, and TCRAV01-02;TCRAJ09 CAV[RL].TGGFKTIF, respectively, with ‘[]’ containing the permitted amino acid and ‘.’ denoting any amino acid. The horizontal lines represent medians, the bounds of the boxes indicate the 25% and 75% percentile and the whiskers represent the minima and maxima. Each dot represents an individual sample (controllers, n = 77; progressors, n = 61). The Mann-Whitney U test (two-sided) was used to compare frequencies between groups. P-values have not been corrected for multiple comparisons.

Comment in

References

    1. O’Garra A, et al. The immune response in tuberculosis. Annu. Rev. Immunol. 2013;31:475–527. doi: 10.1146/annurev-immunol-032712-095939. - DOI - PubMed
    1. Scriba, T. J., Coussens, A. K. & Fletcher, H. A. Human immunology of tuberculosis. Microbiol. Spectr. 10.1128/microbiolspec.TBTB2-0016-2016 (2017). - PubMed
    1. Cadena AM, et al. Concurrent infection with Mycobacterium tuberculosis confers robust protection against secondary infection in macaques. PLoS Pathog. 2018;14:e1007305. doi: 10.1371/journal.ppat.1007305. - DOI - PMC - PubMed
    1. Darrah PA, et al. Prevention of tuberculosis in macaques after intravenous BCG immunization. Nature. 2020;577:95–102. doi: 10.1038/s41586-019-1817-8. - DOI - PMC - PubMed
    1. Gideon HP, et al. Variability in tuberculosis granuloma T cell responses exists, but a balance of pro- and anti-inflammatory cytokines is associated with sterilization. PLoS Pathog. 2015;11:e1004603. doi: 10.1371/journal.ppat.1004603. - DOI - PMC - PubMed

Publication types