. 2023 Feb;24(2):239-254.
doi: 10.1038/s41590-022-01388-8. Epub 2023 Jan 5.

Inducing trained immunity in pro-metastatic macrophages to control tumor metastasis

Affiliations

Inducing trained immunity in pro-metastatic macrophages to control tumor metastasis

Chuanlin Ding et al. Nat Immunol. 2023 Feb.

Abstract

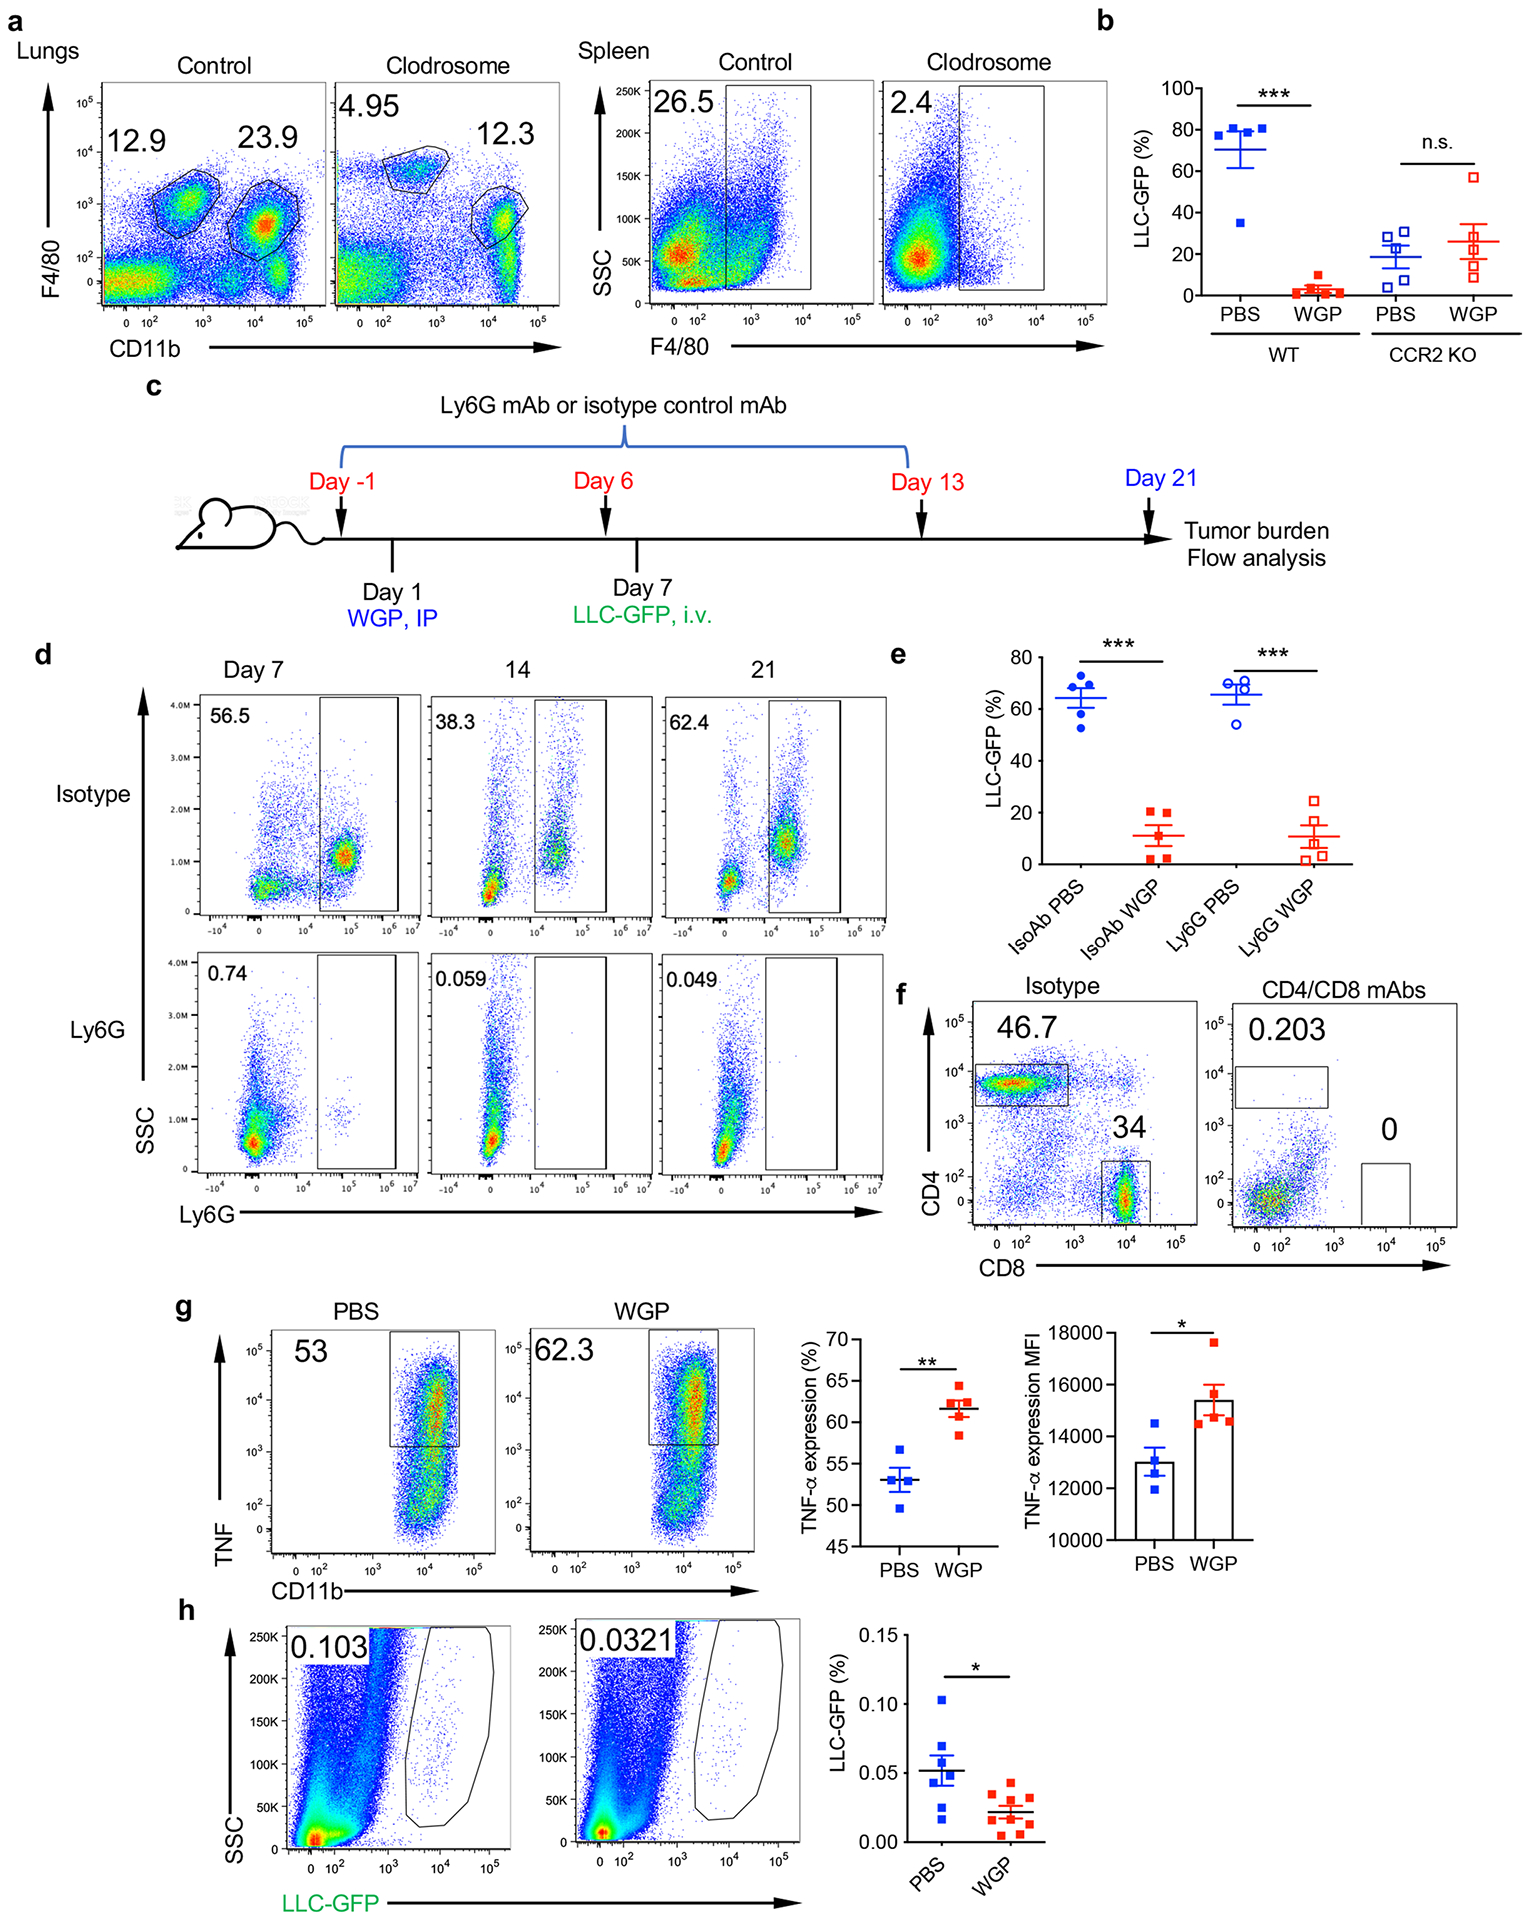
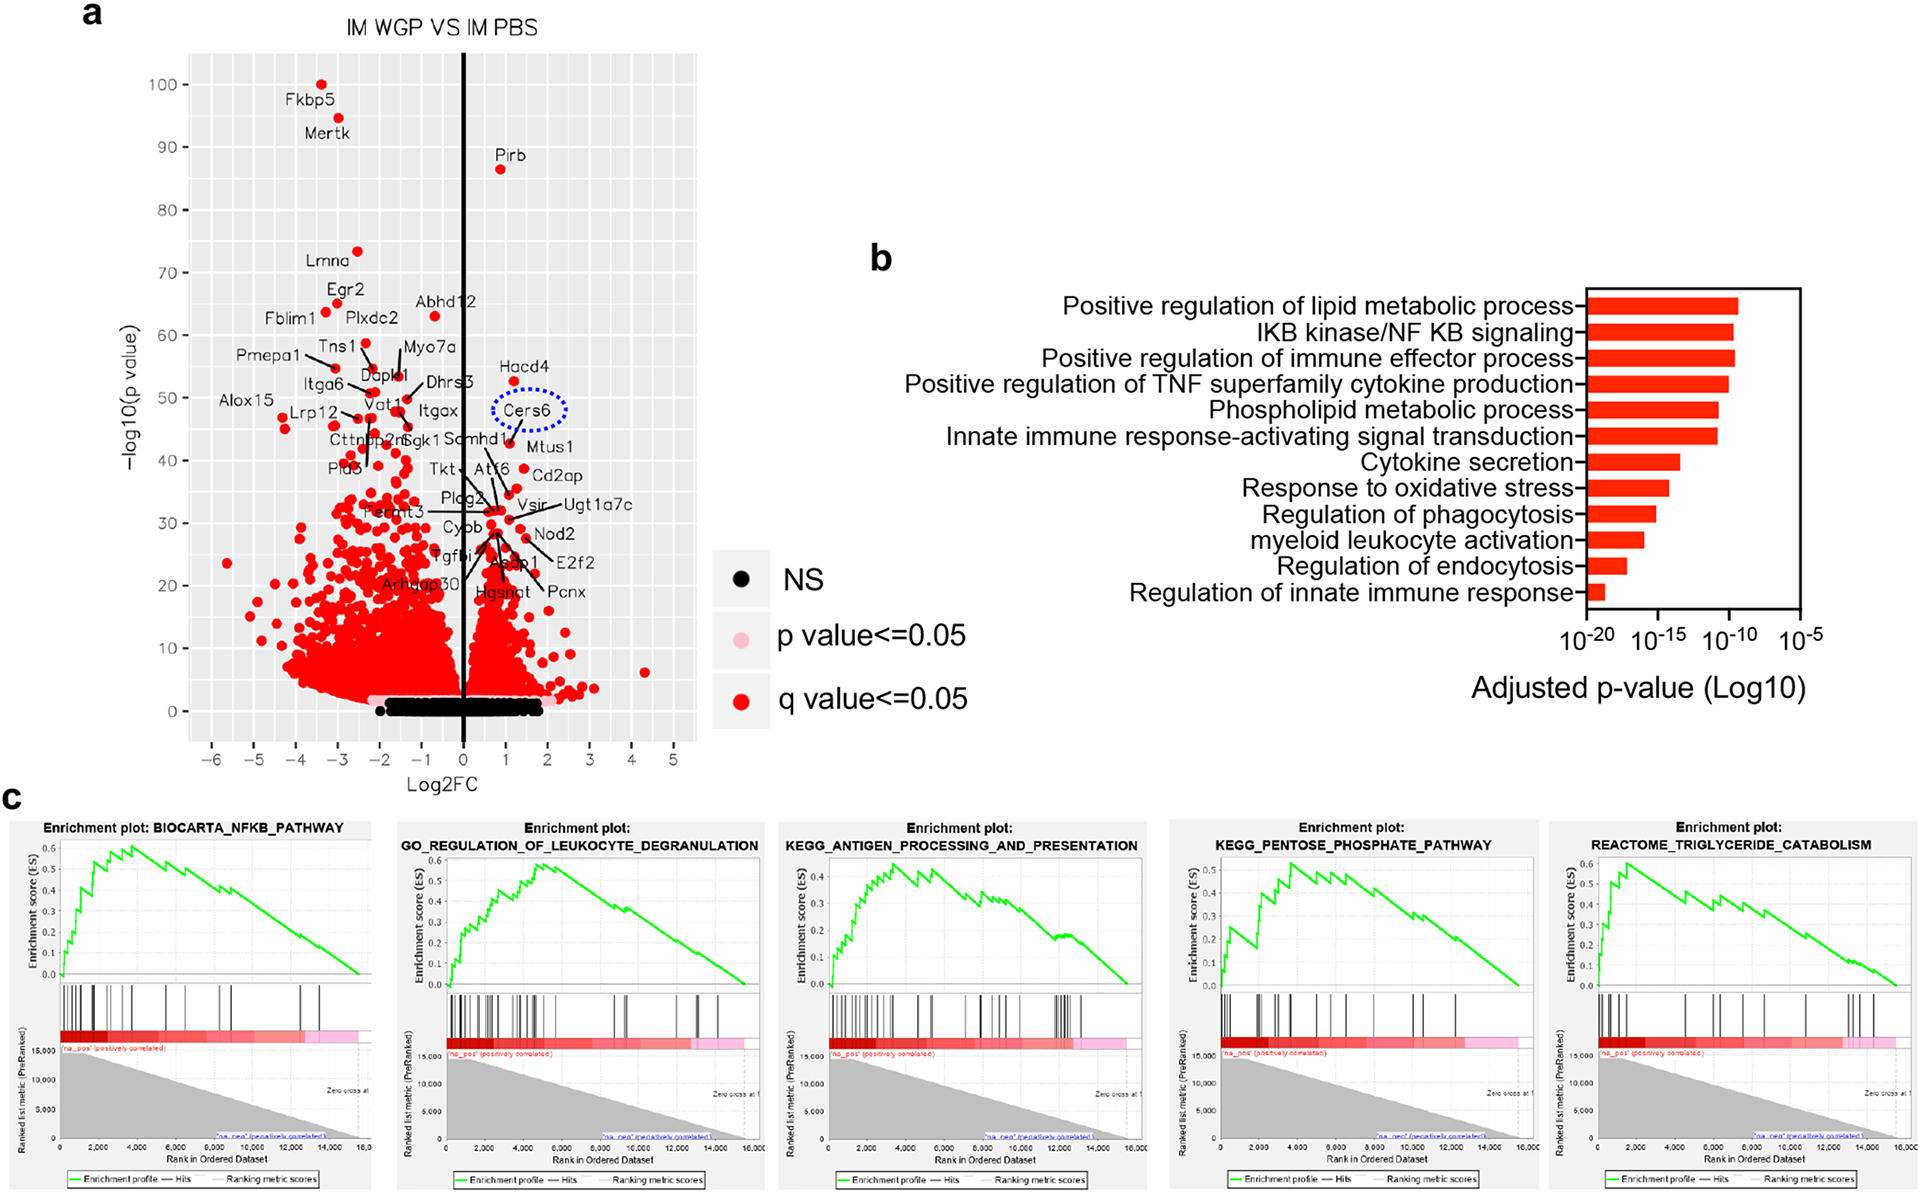
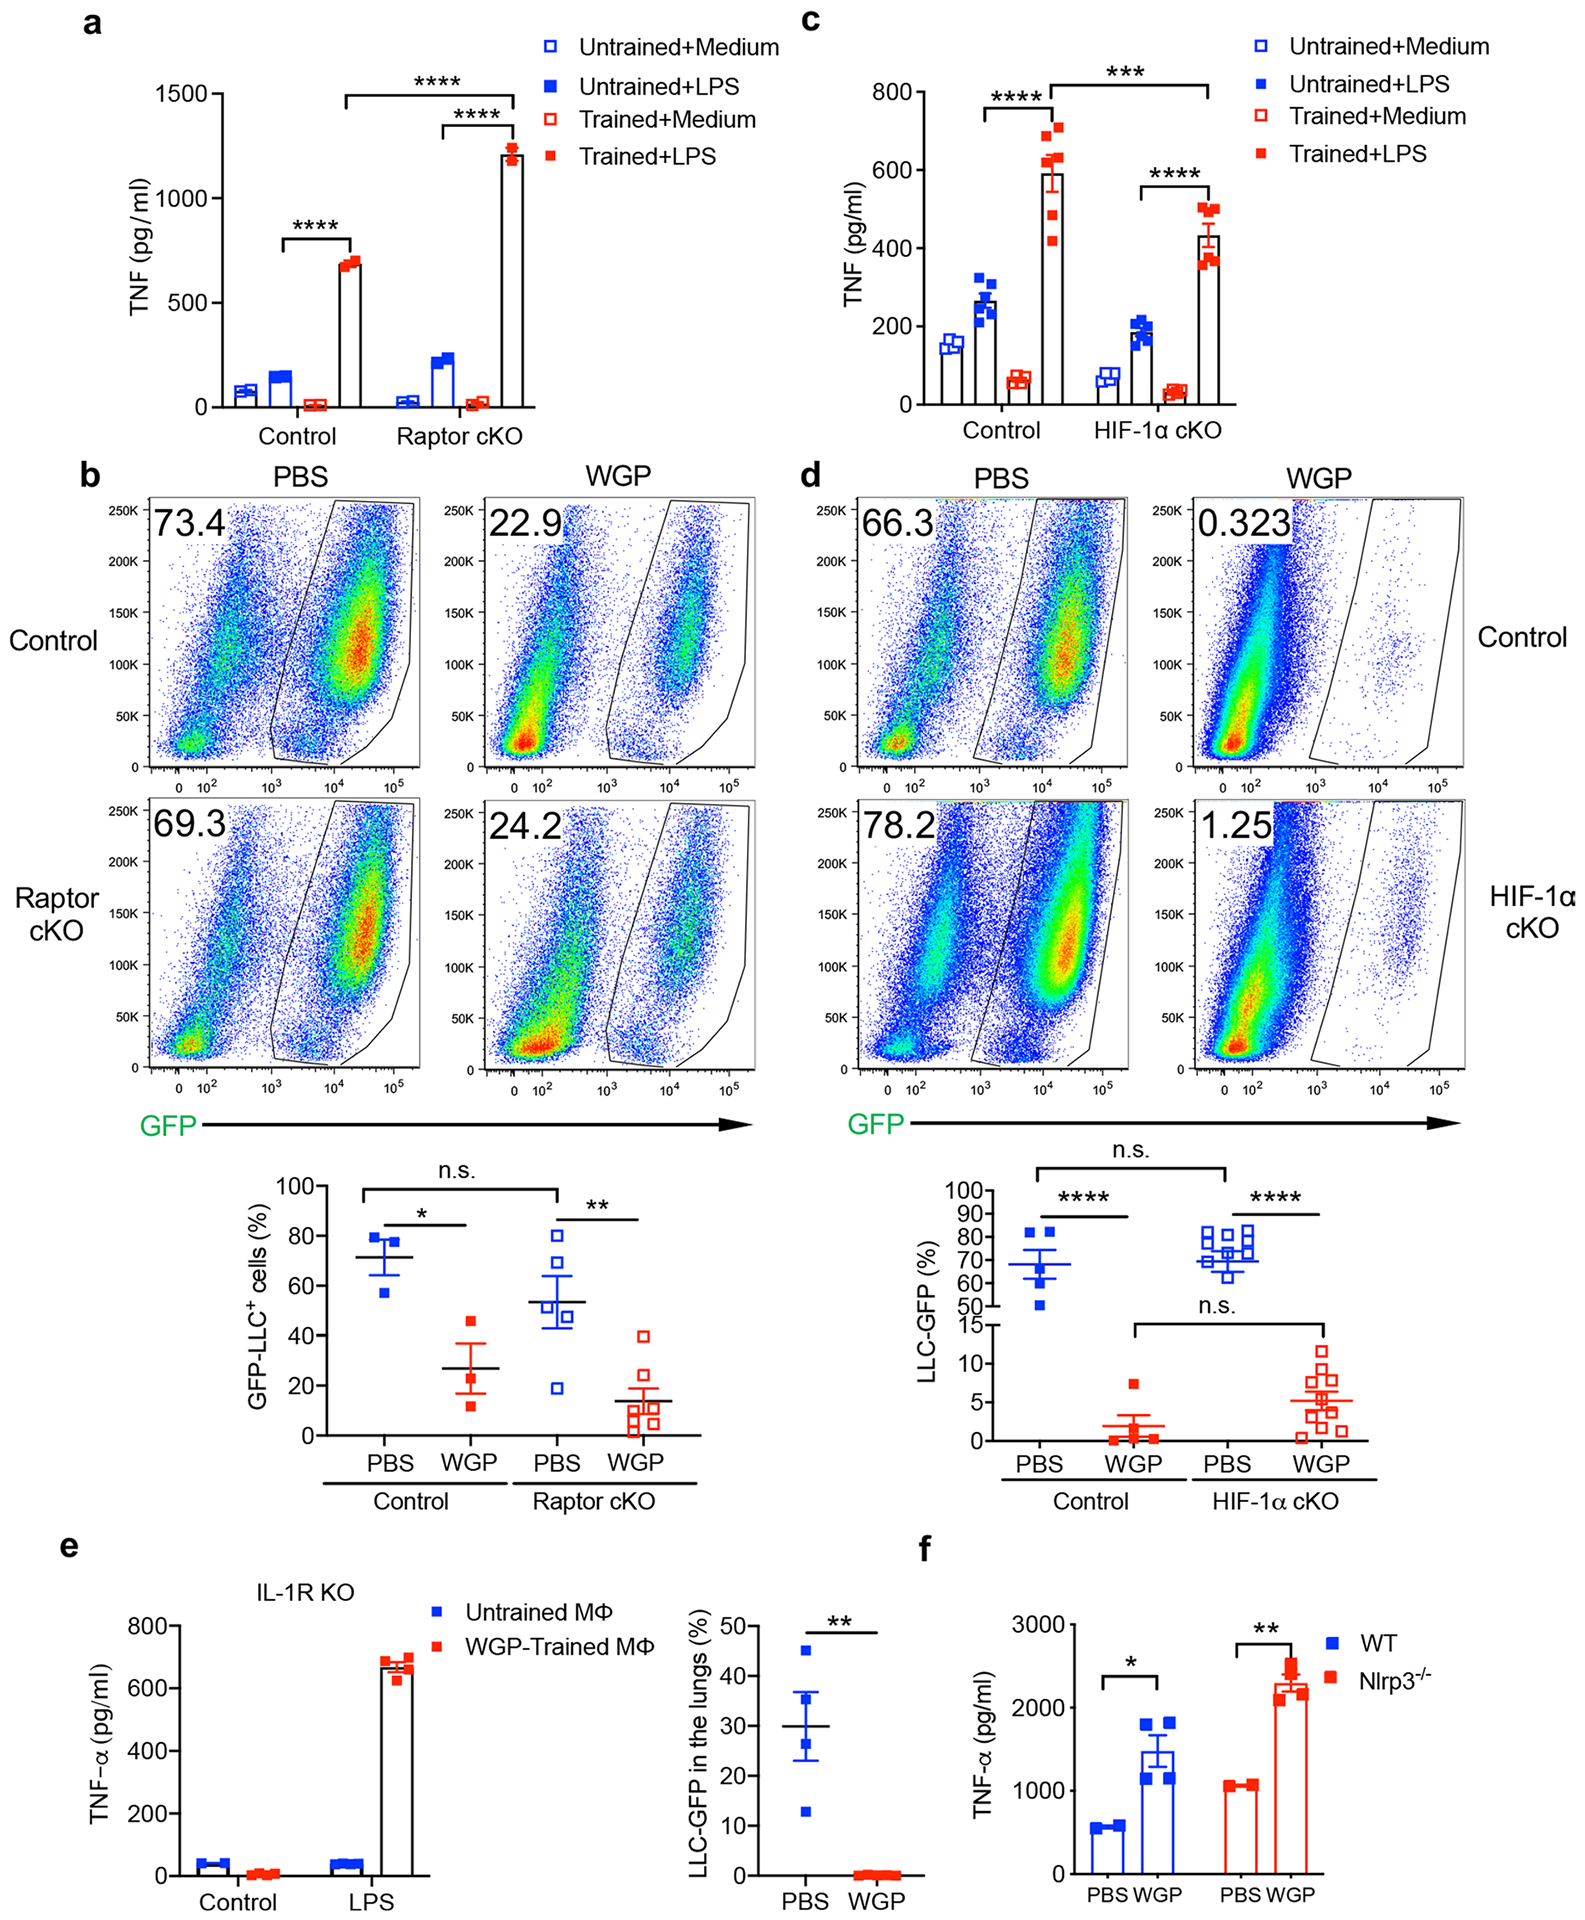
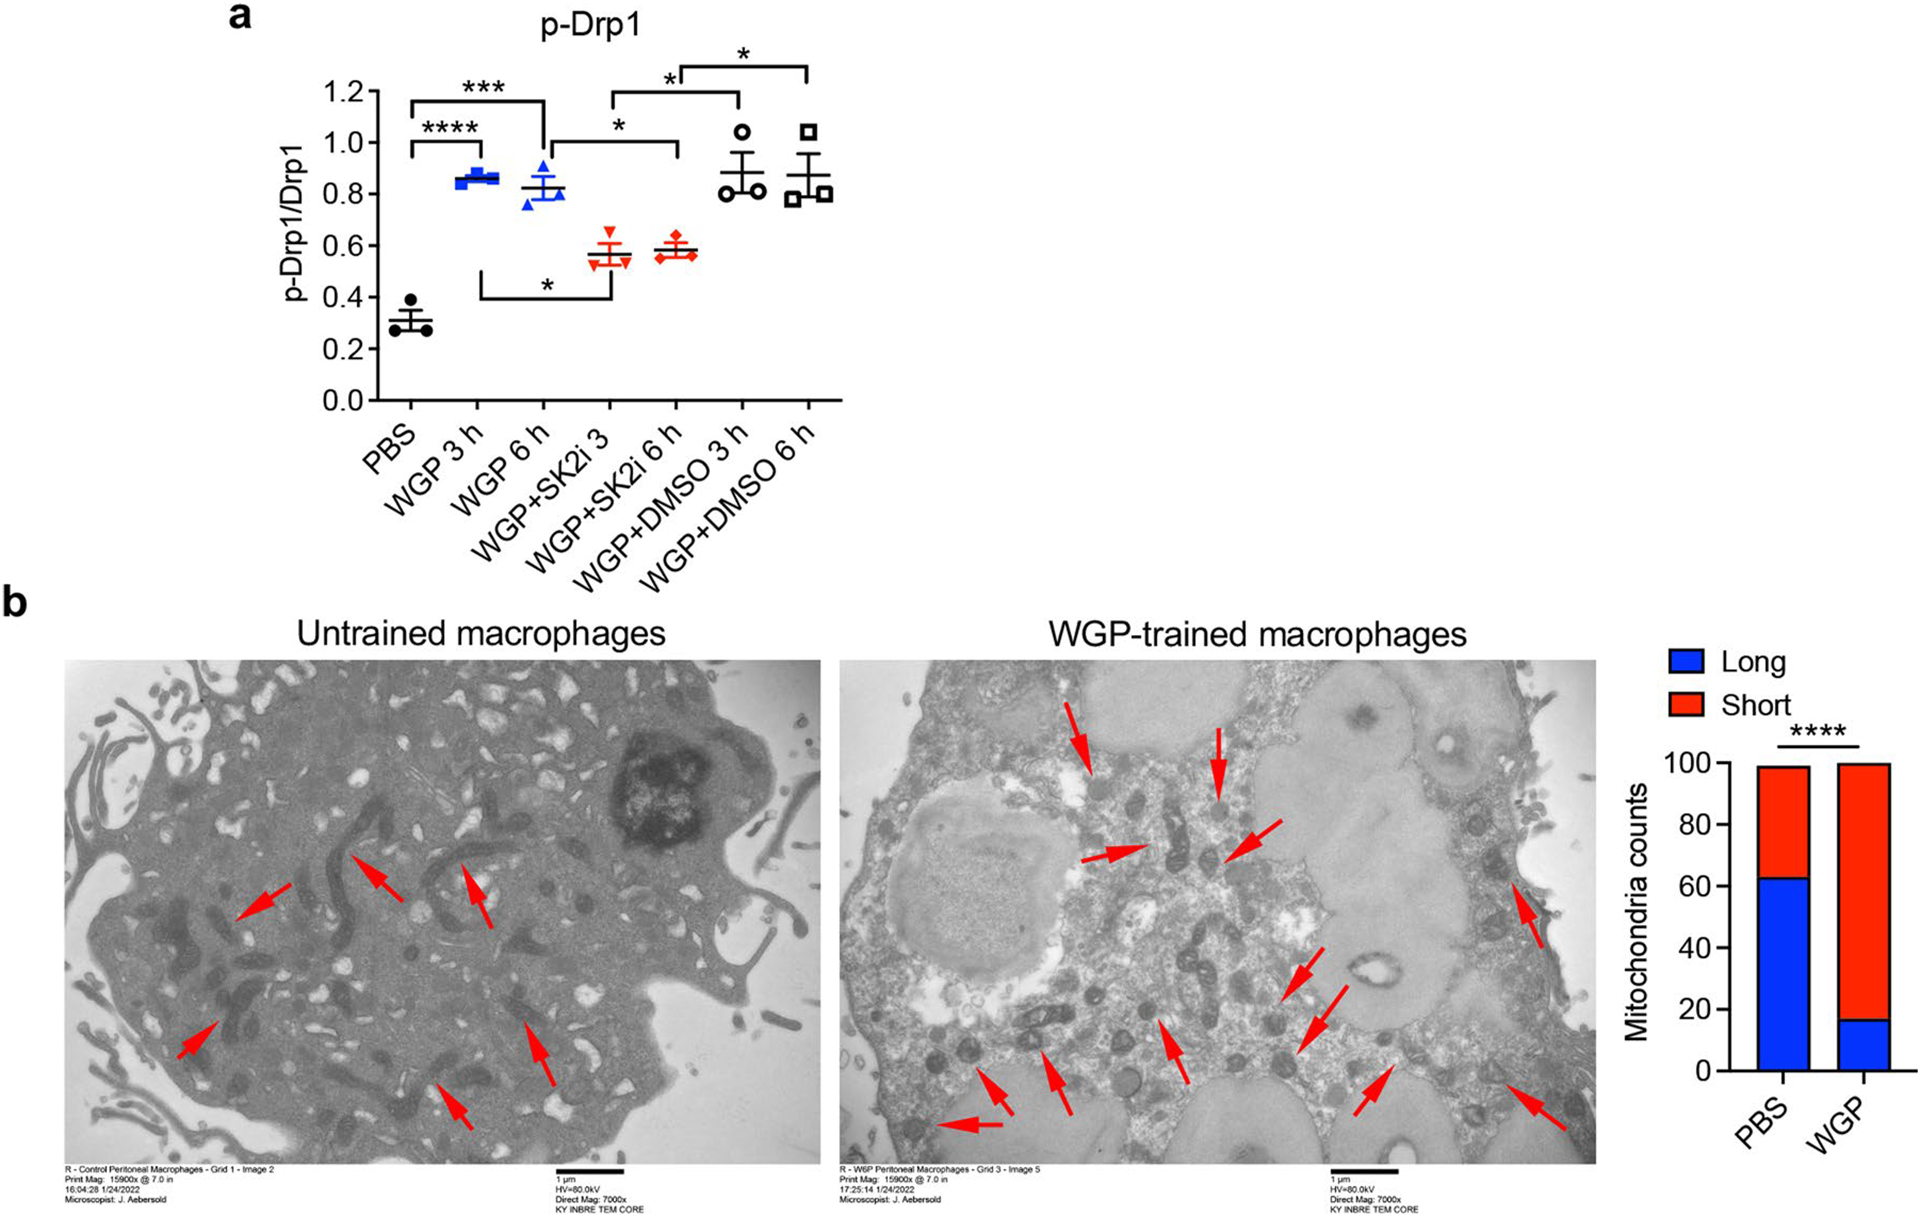
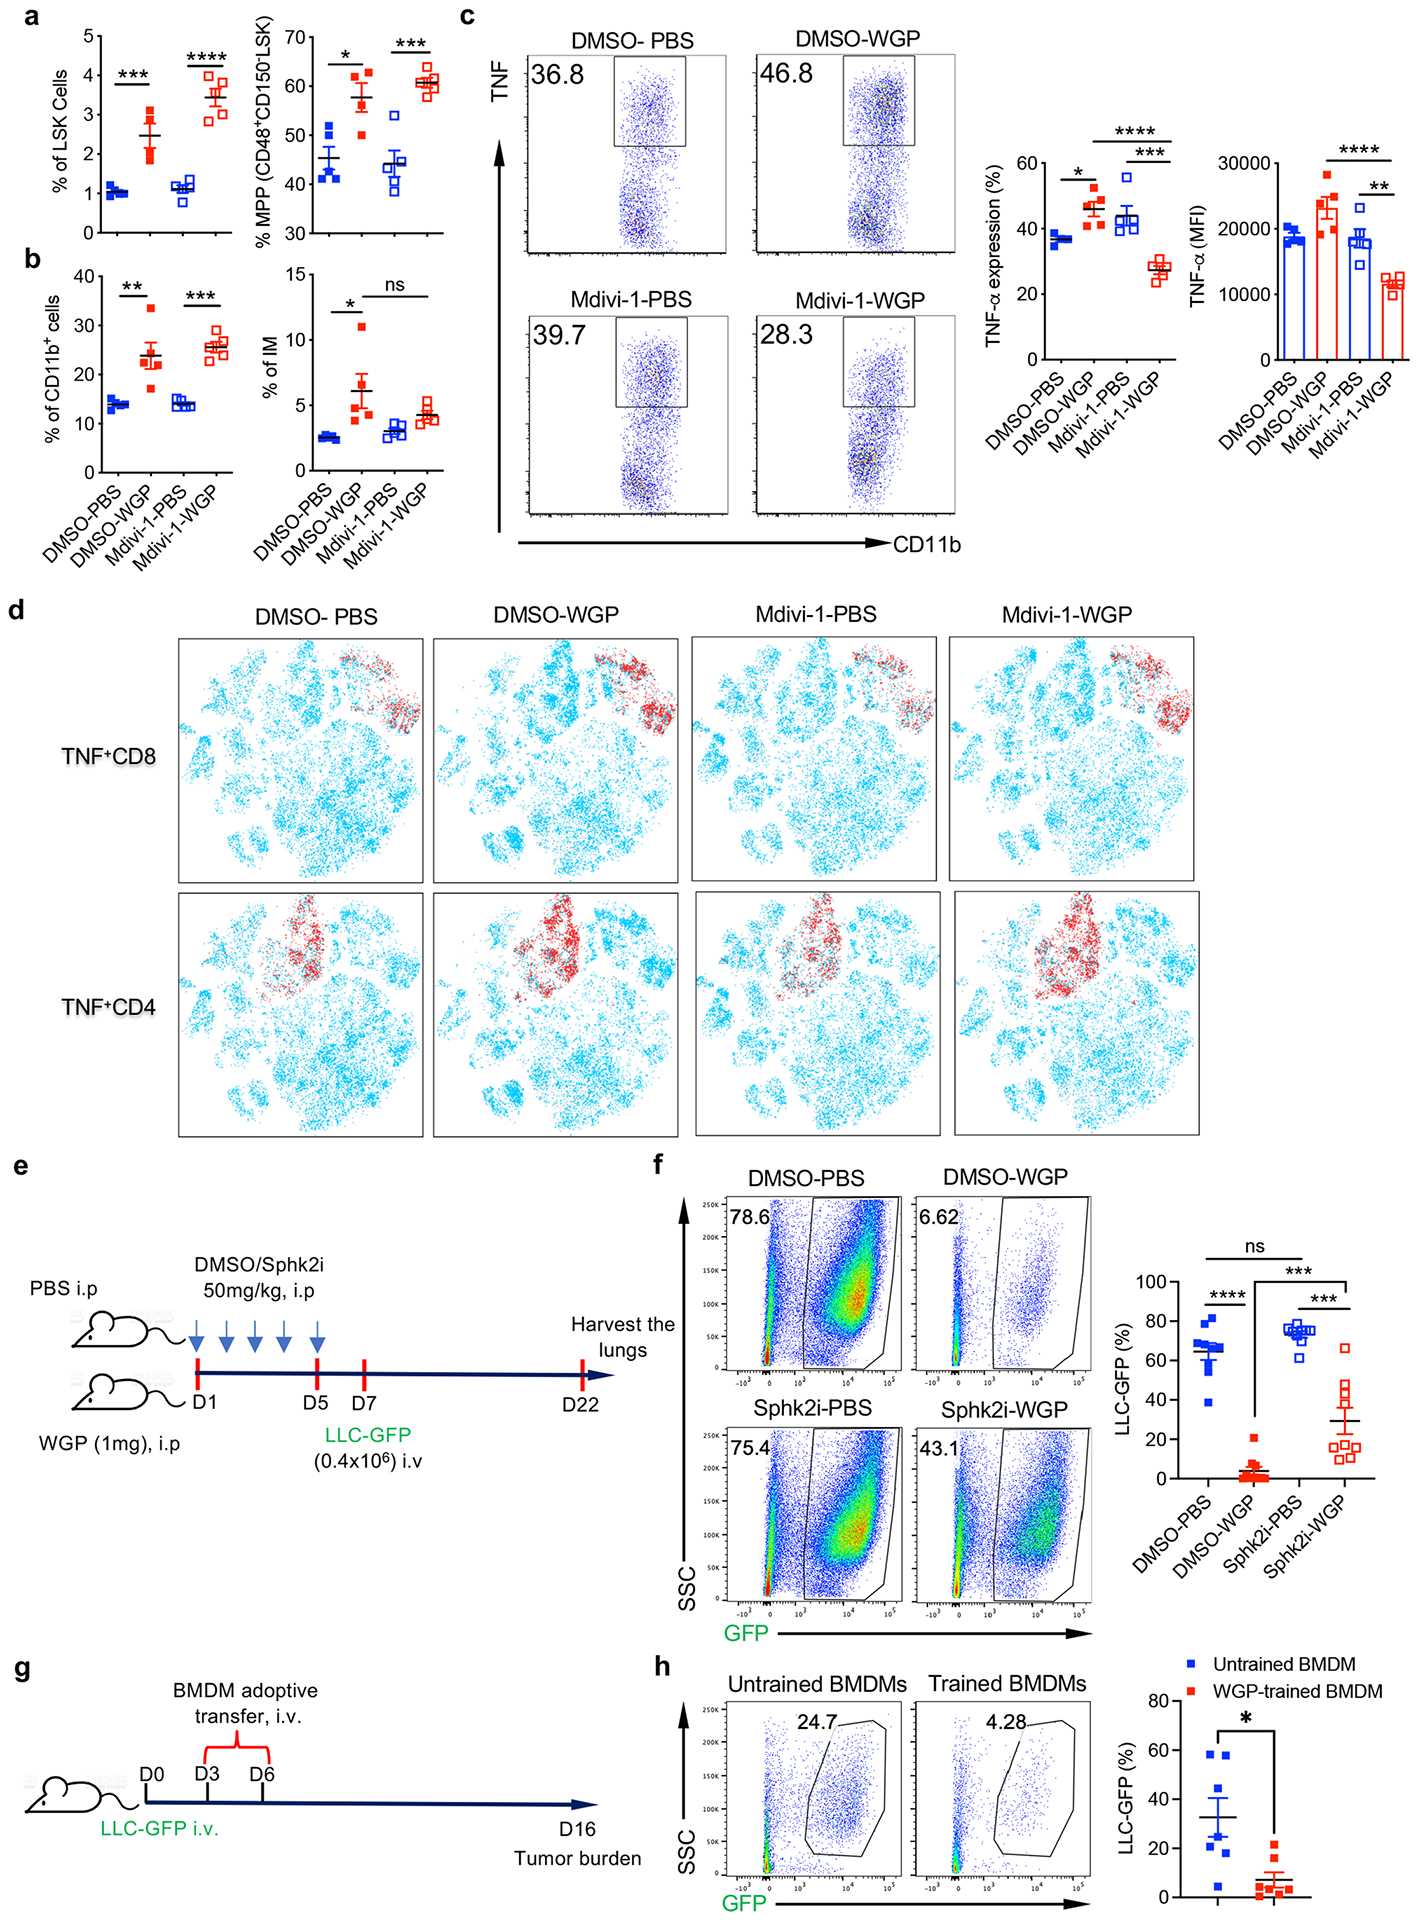
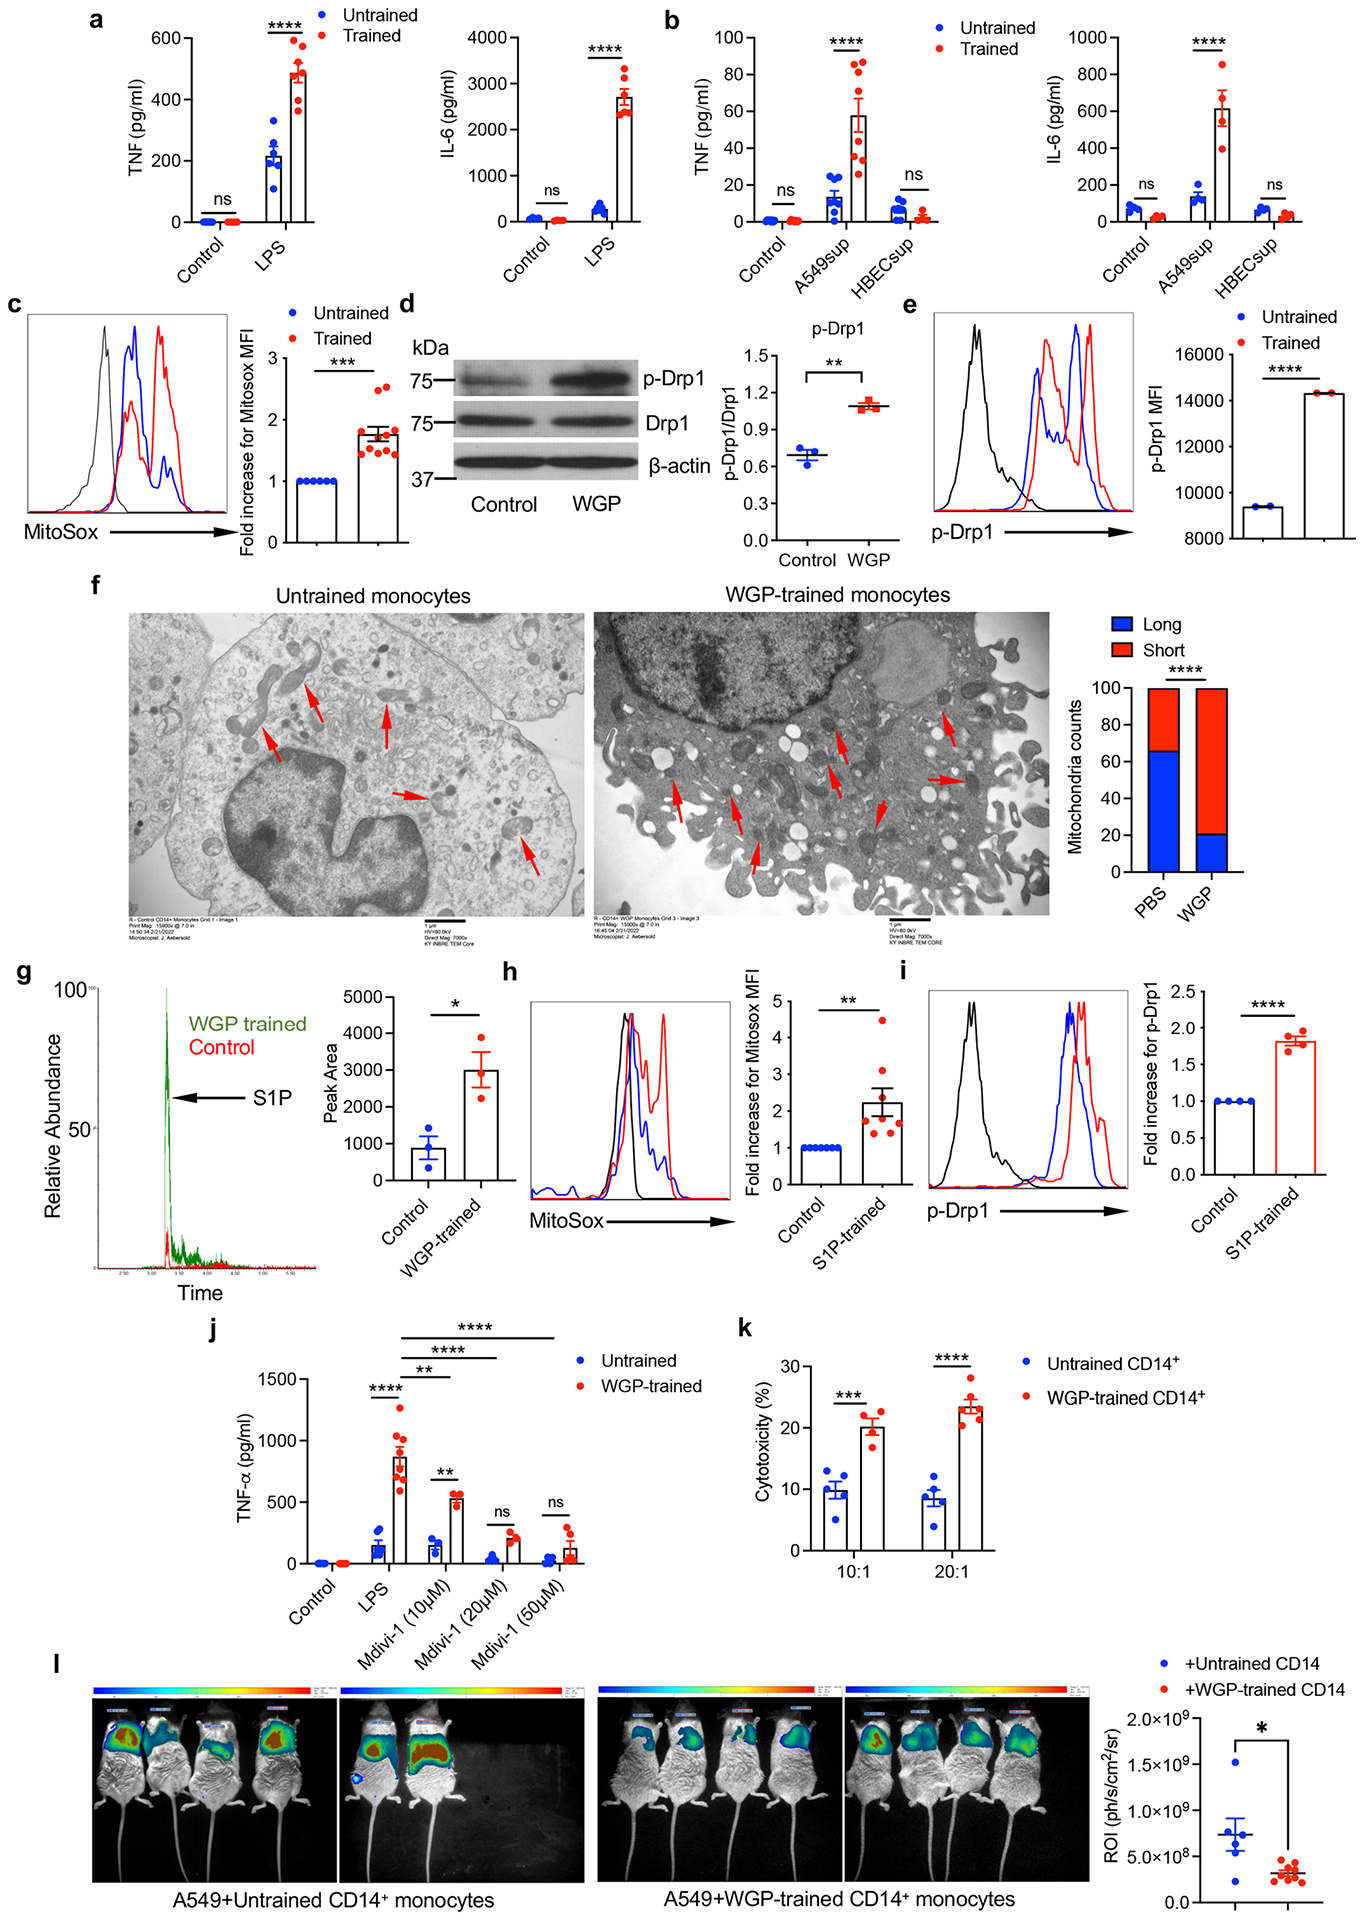
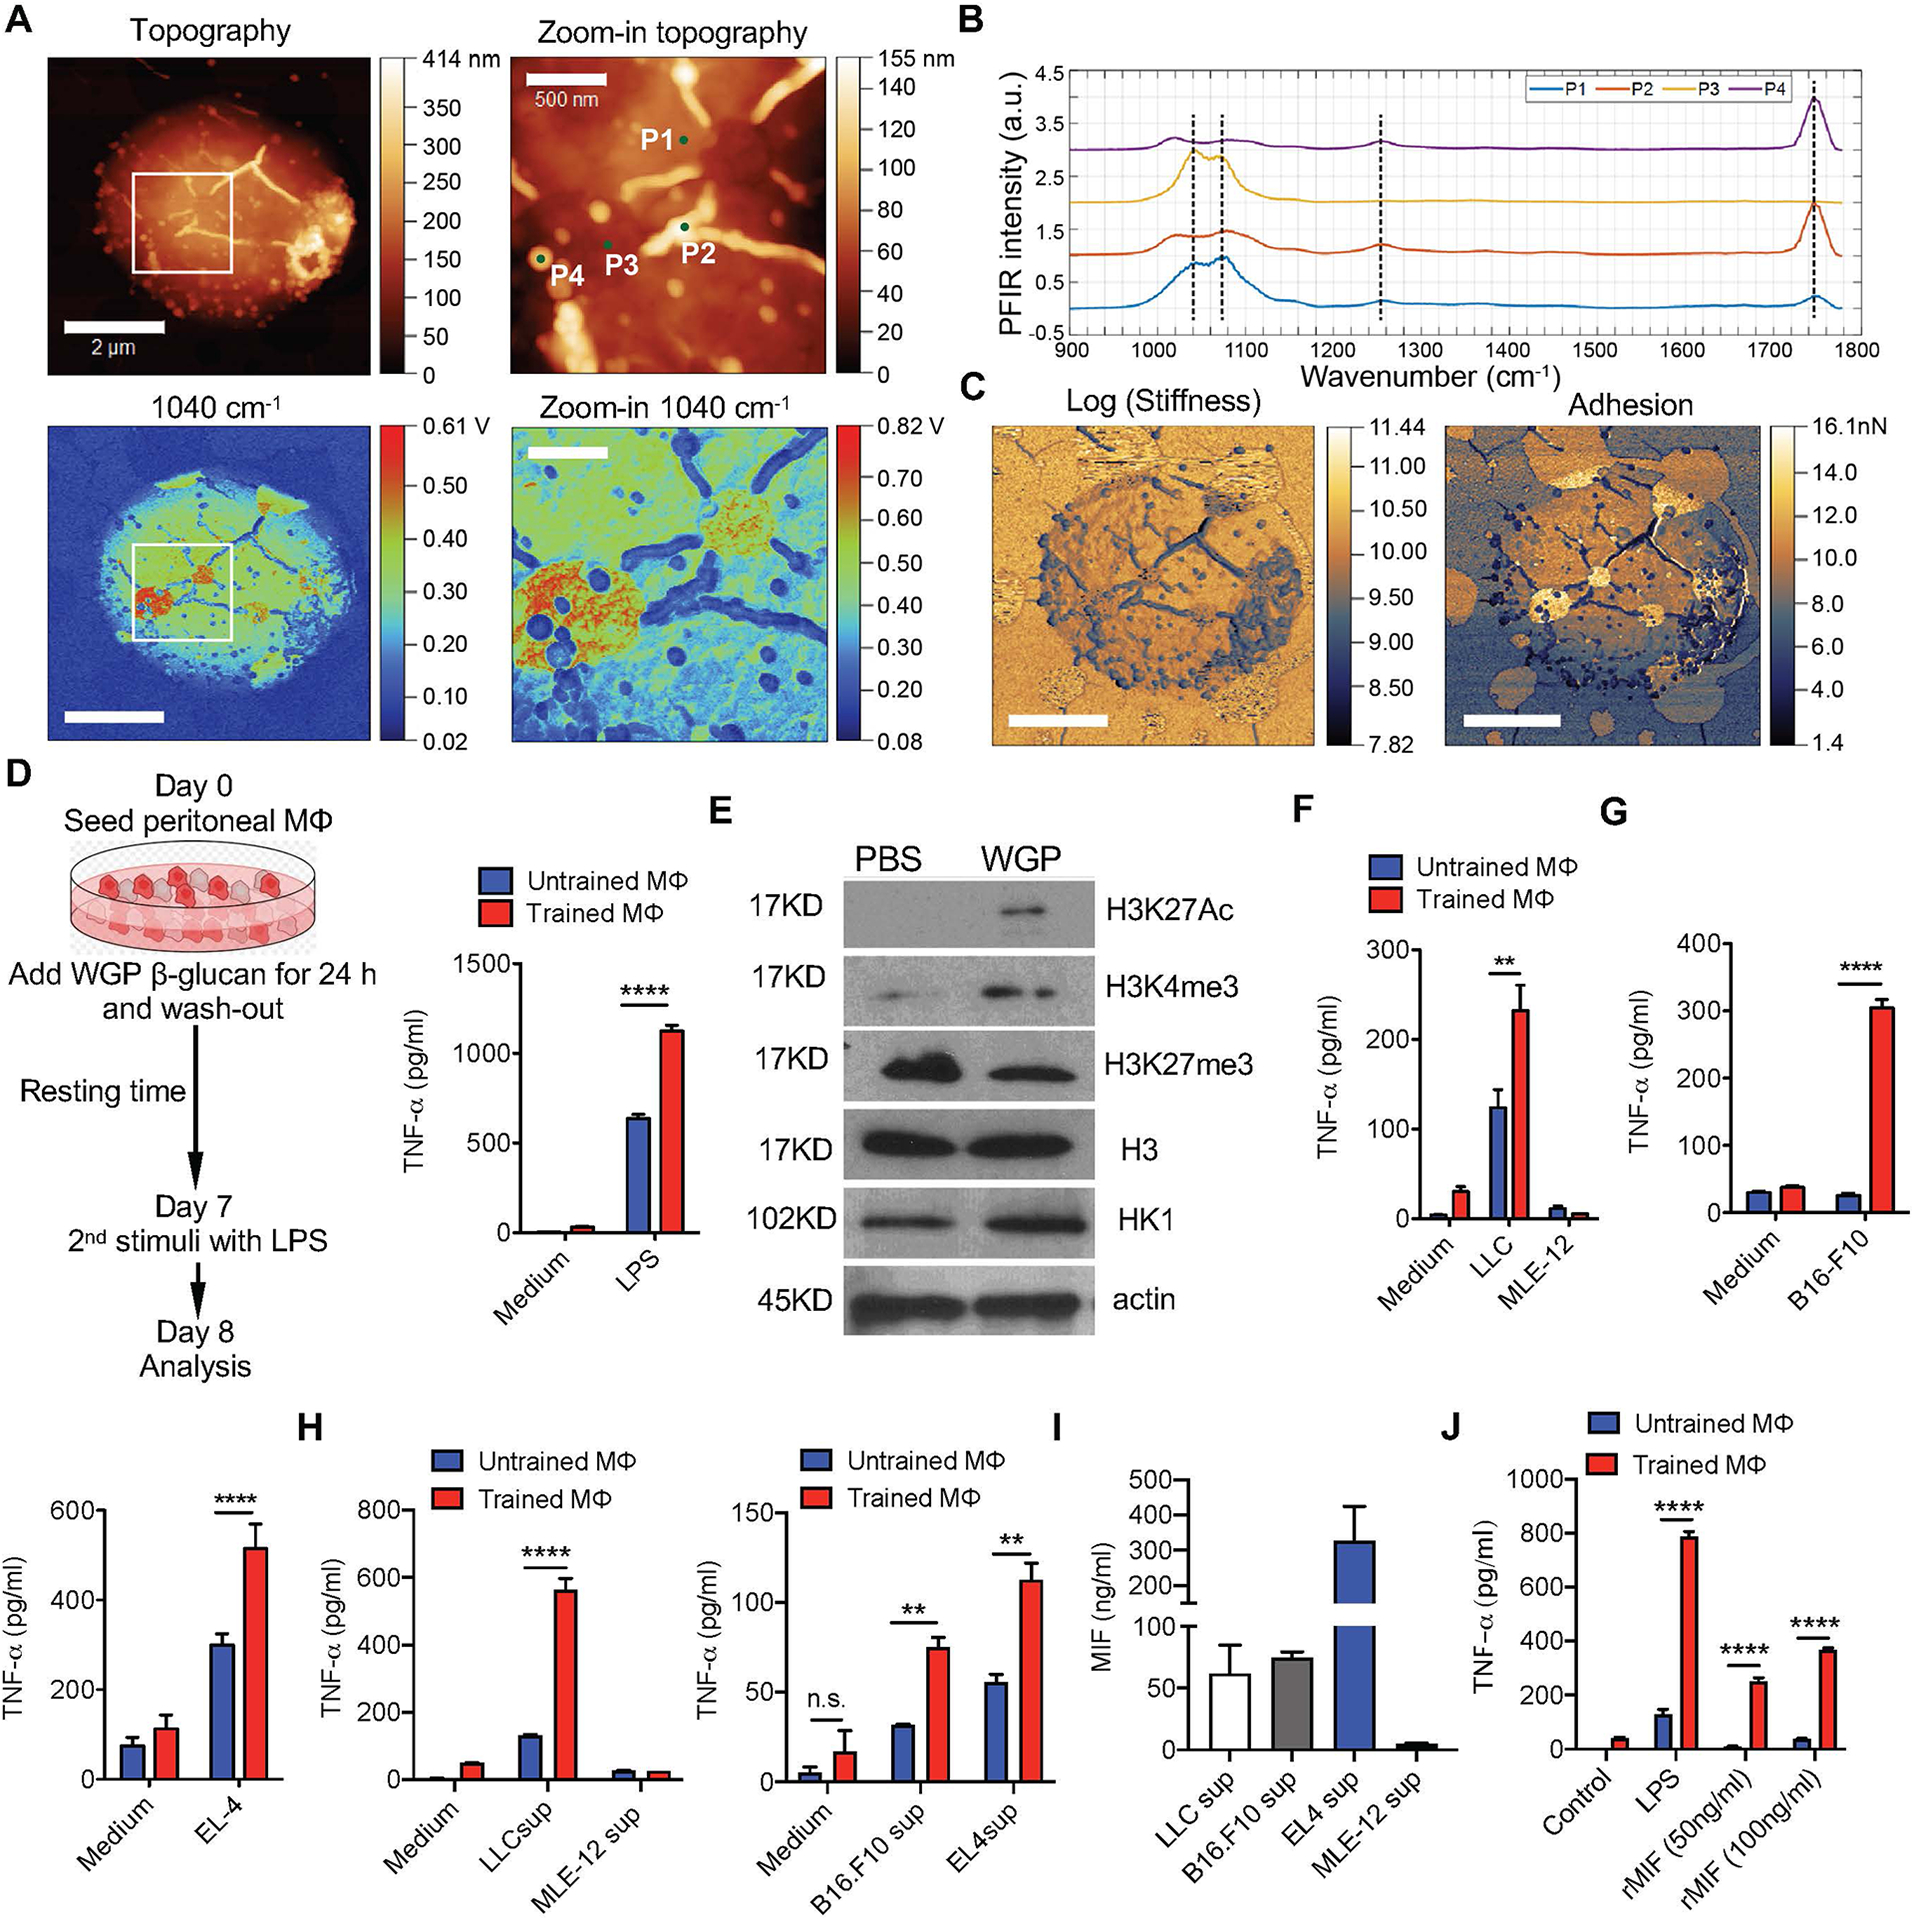
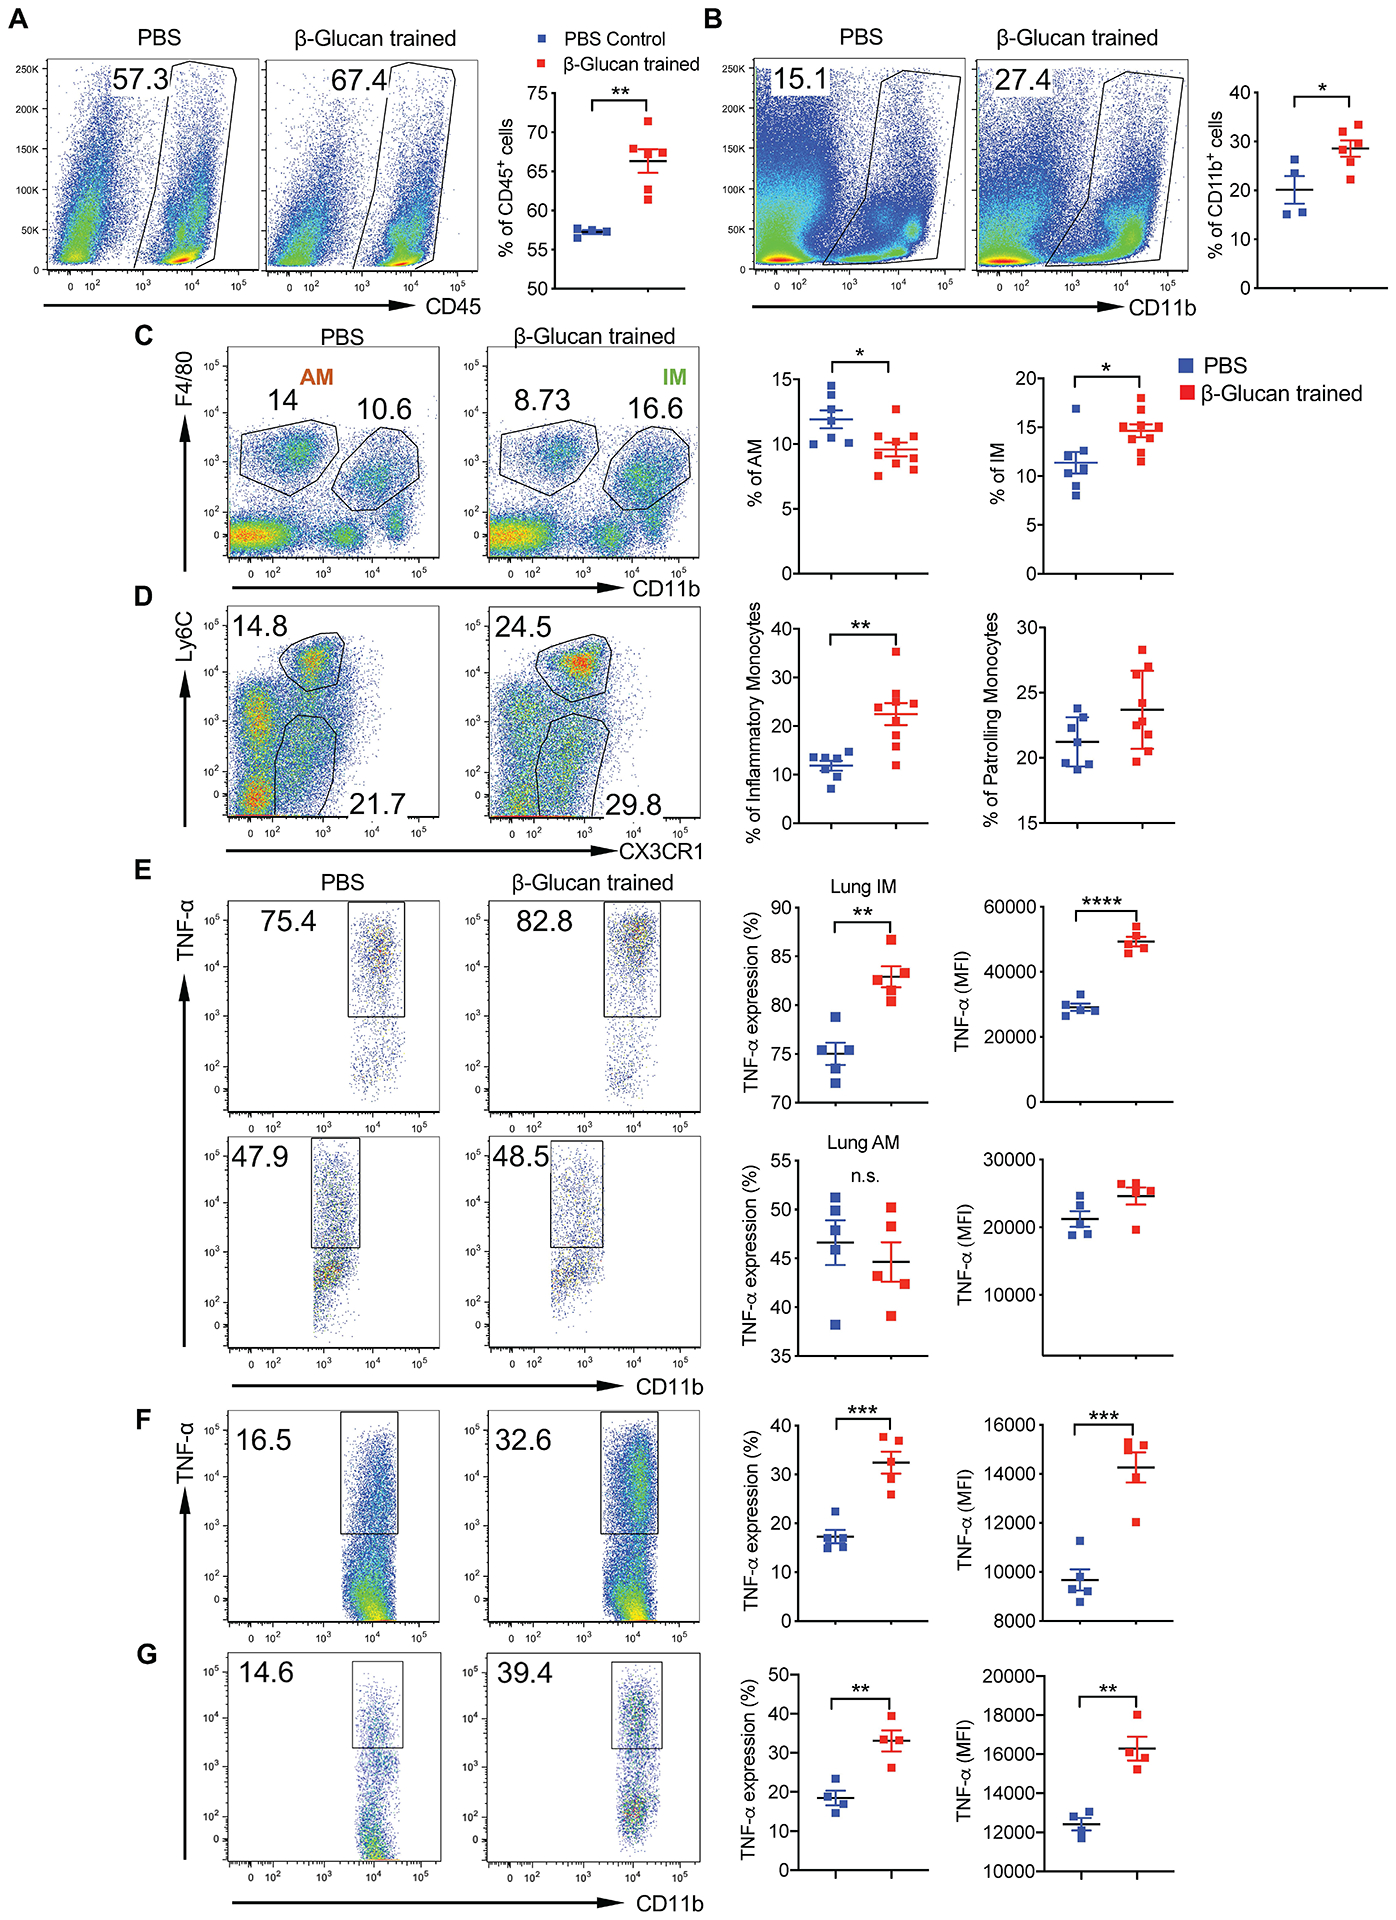
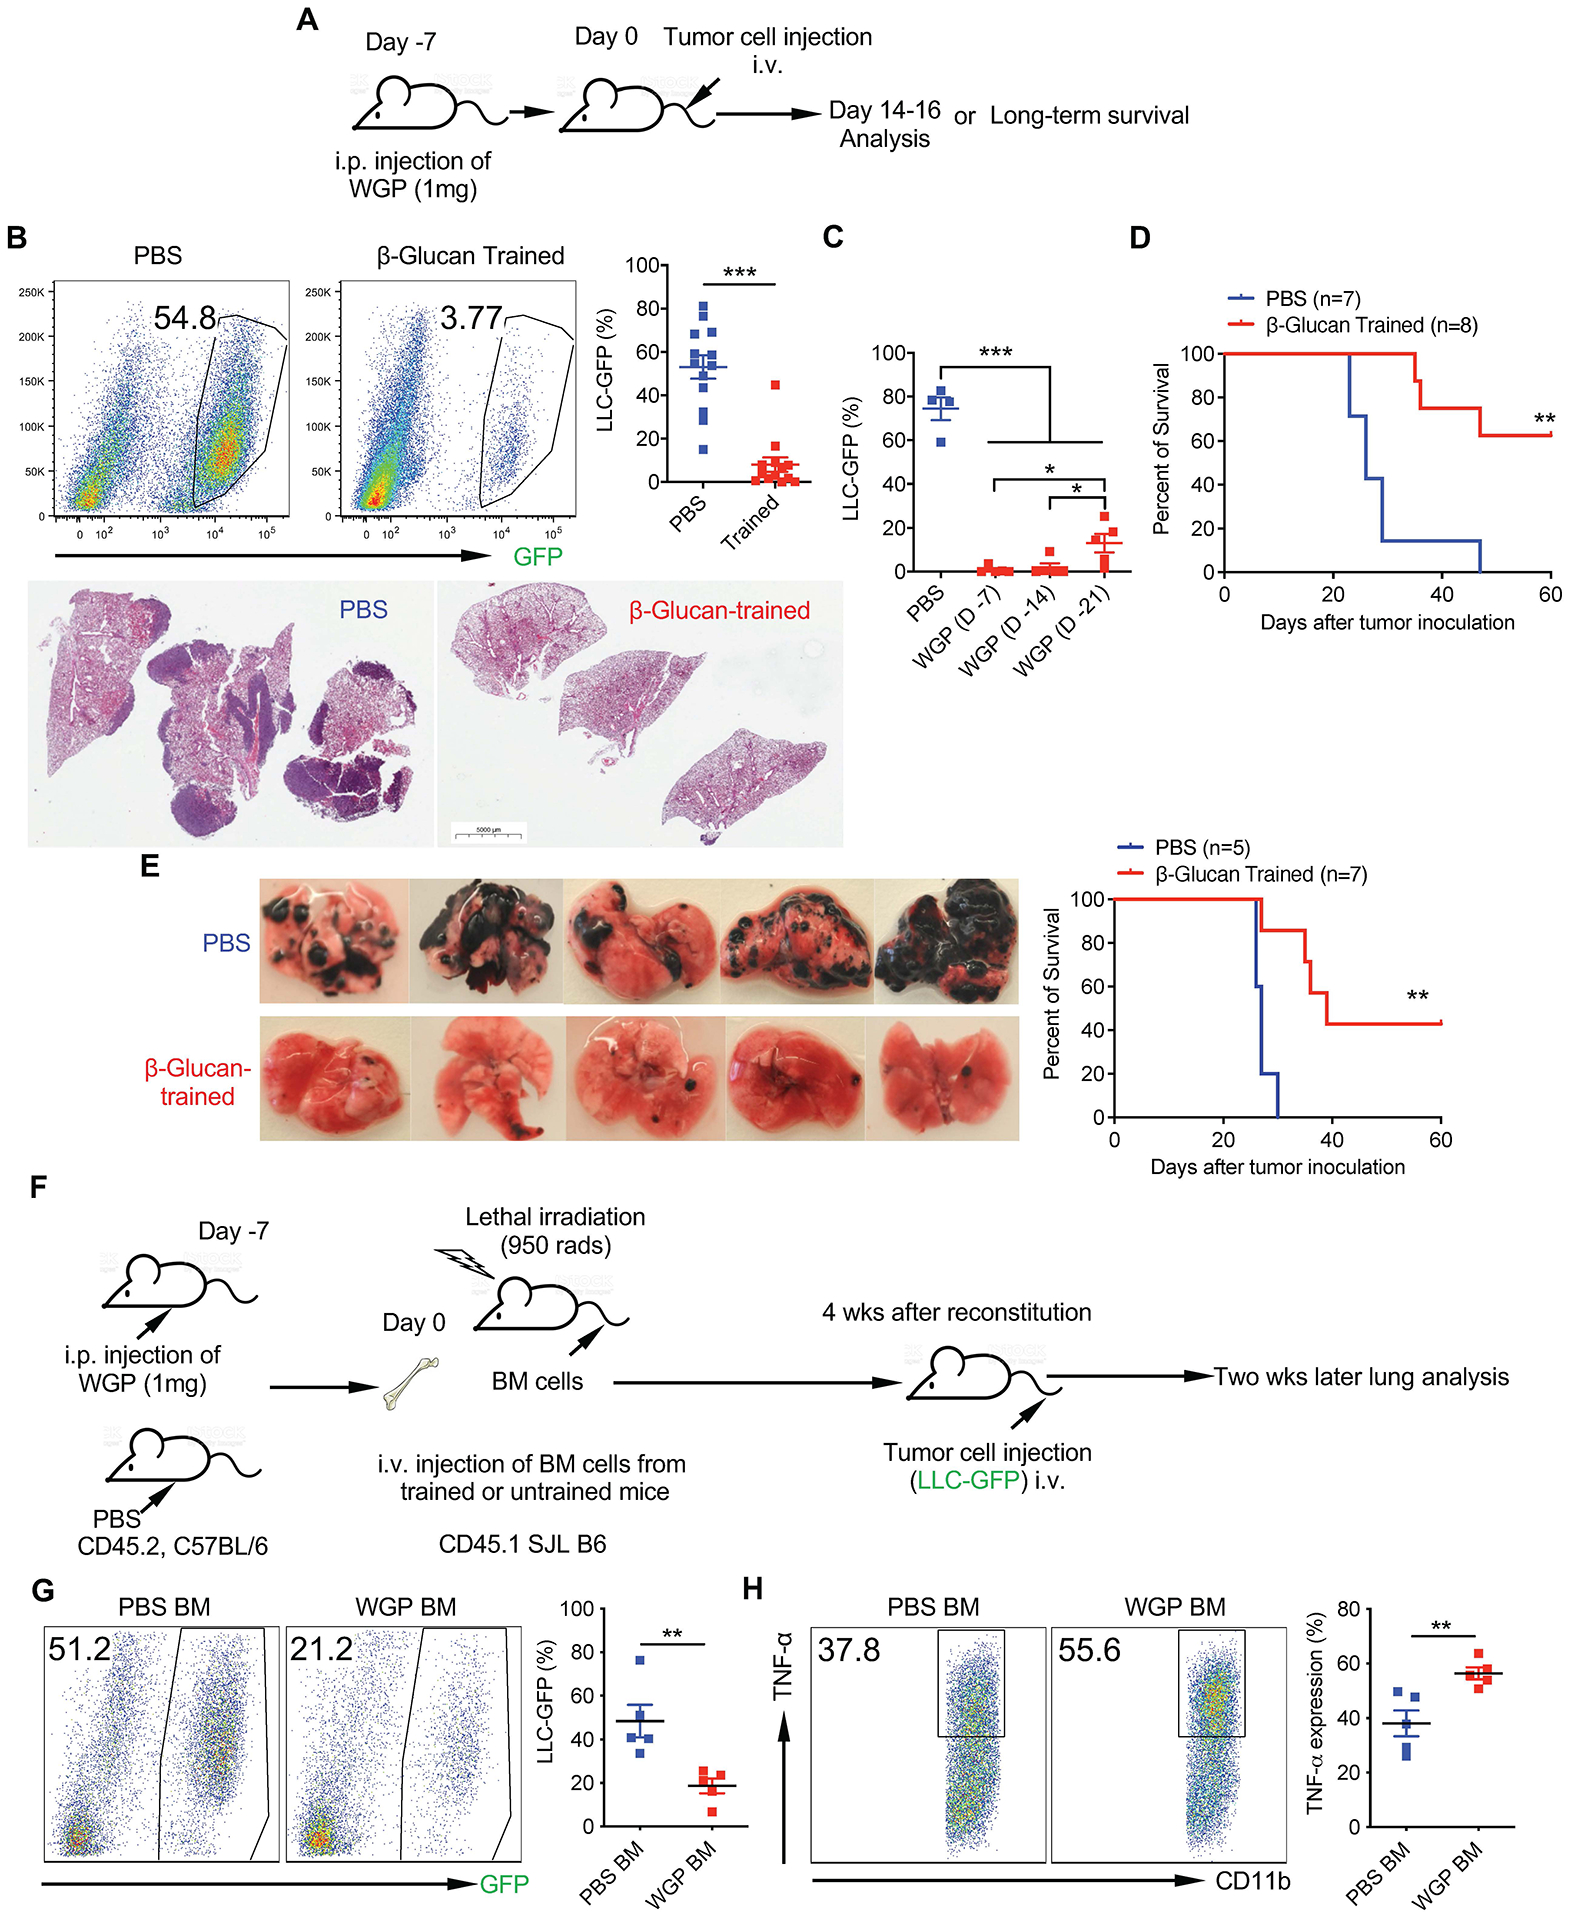
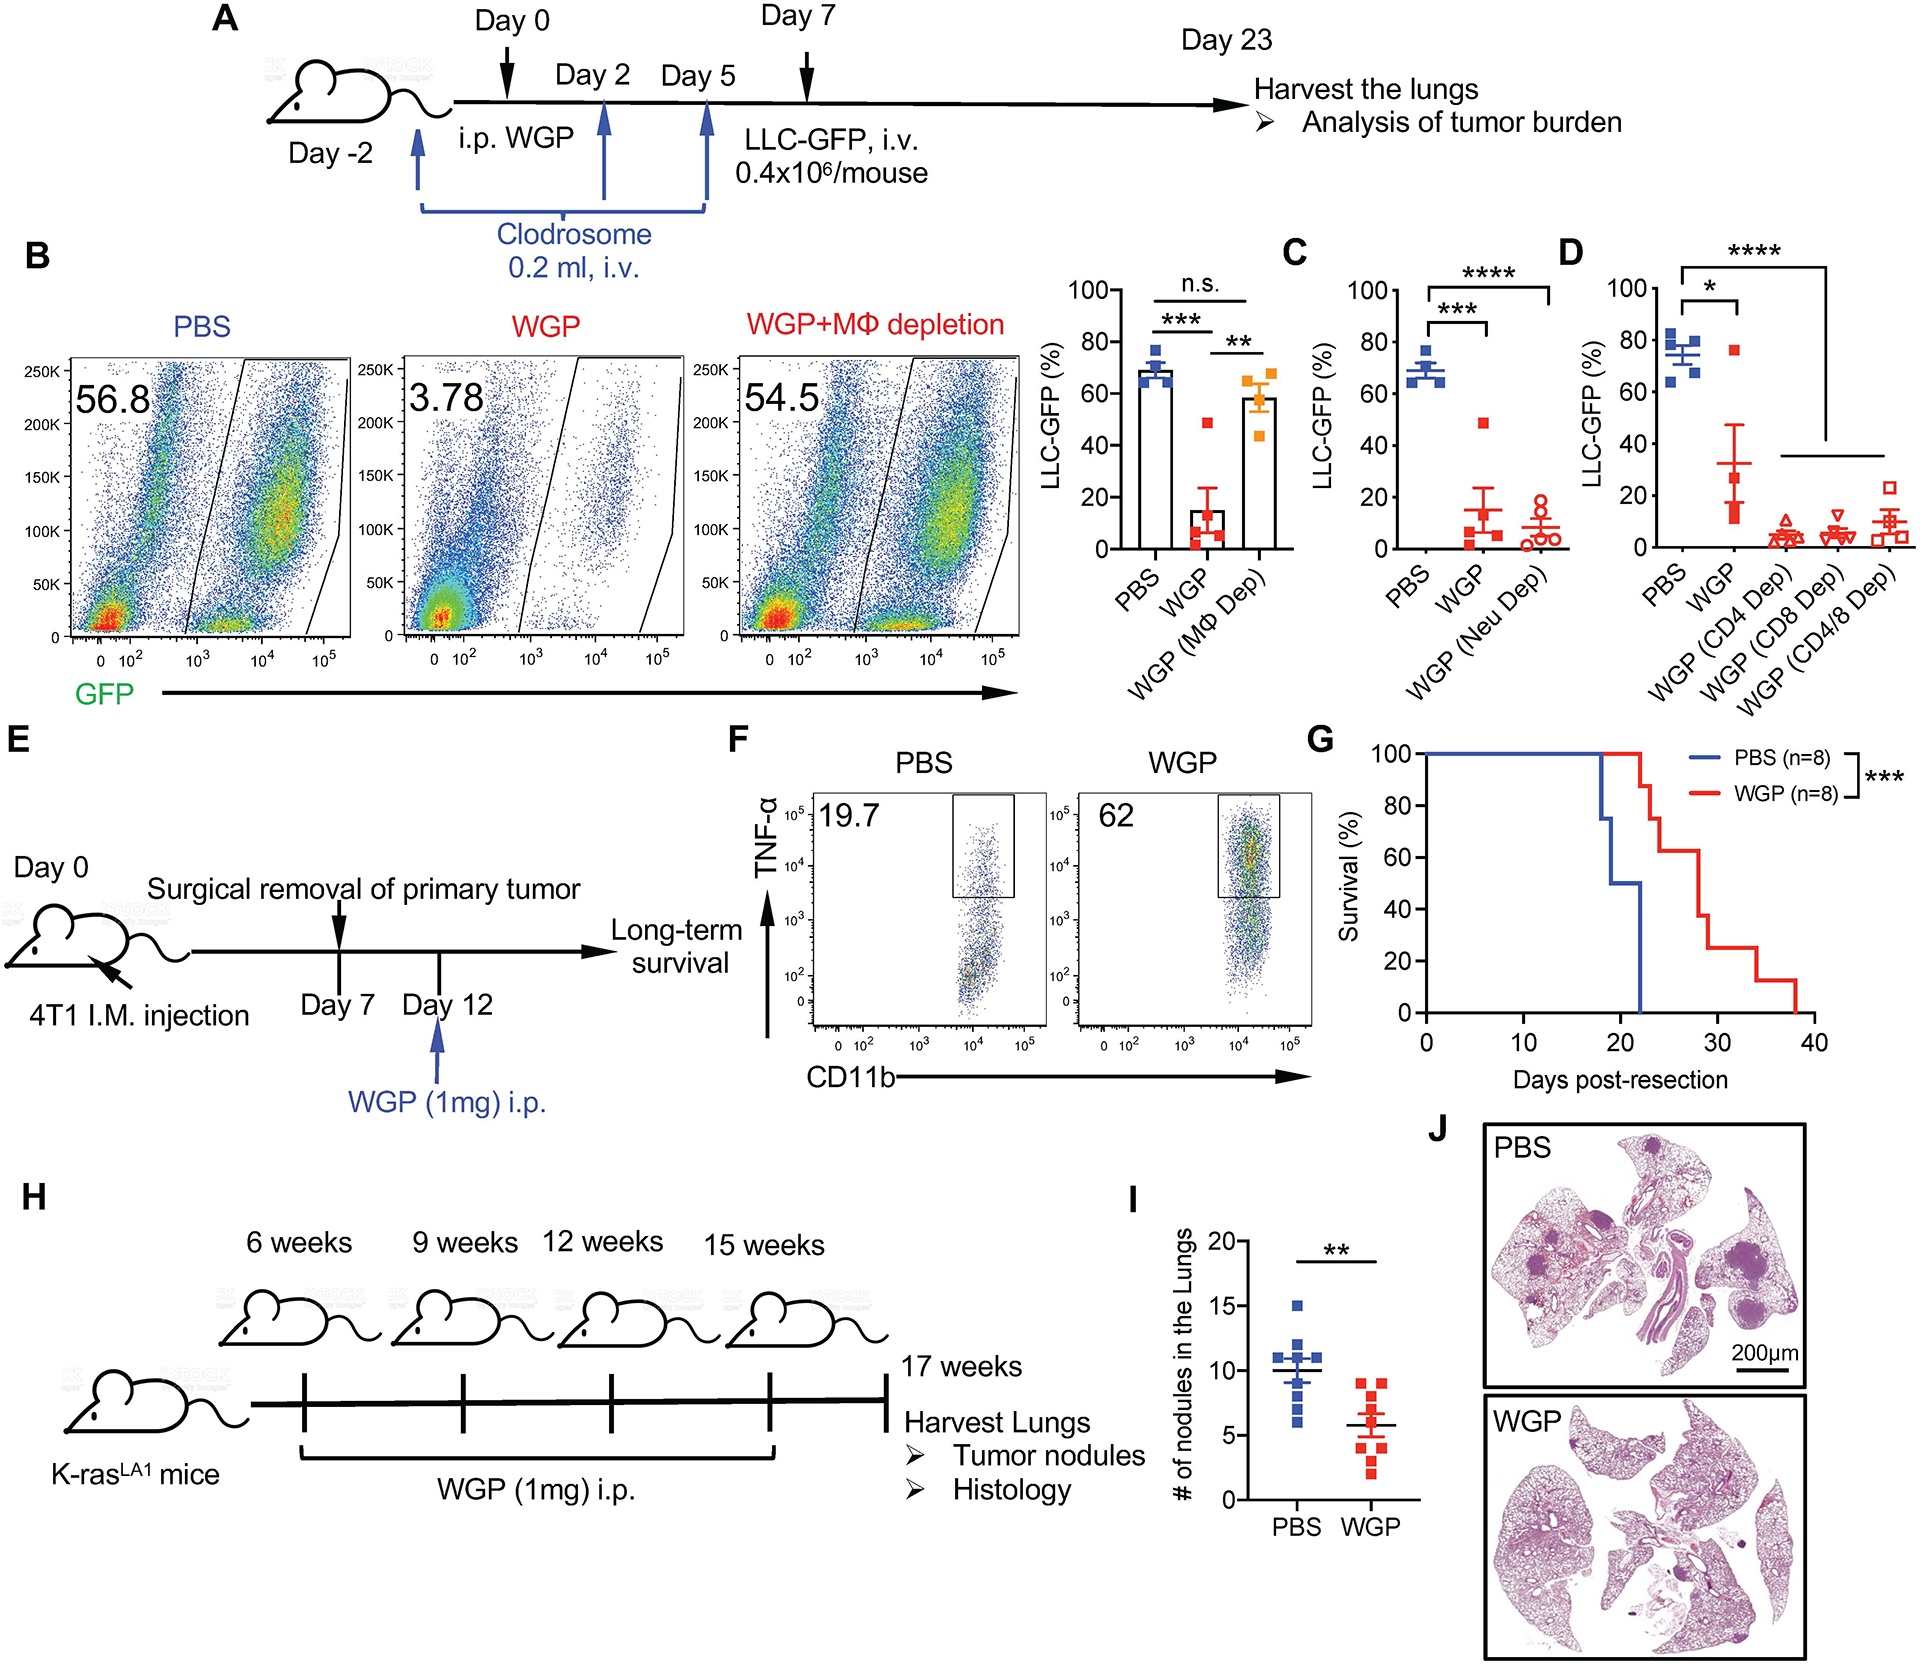
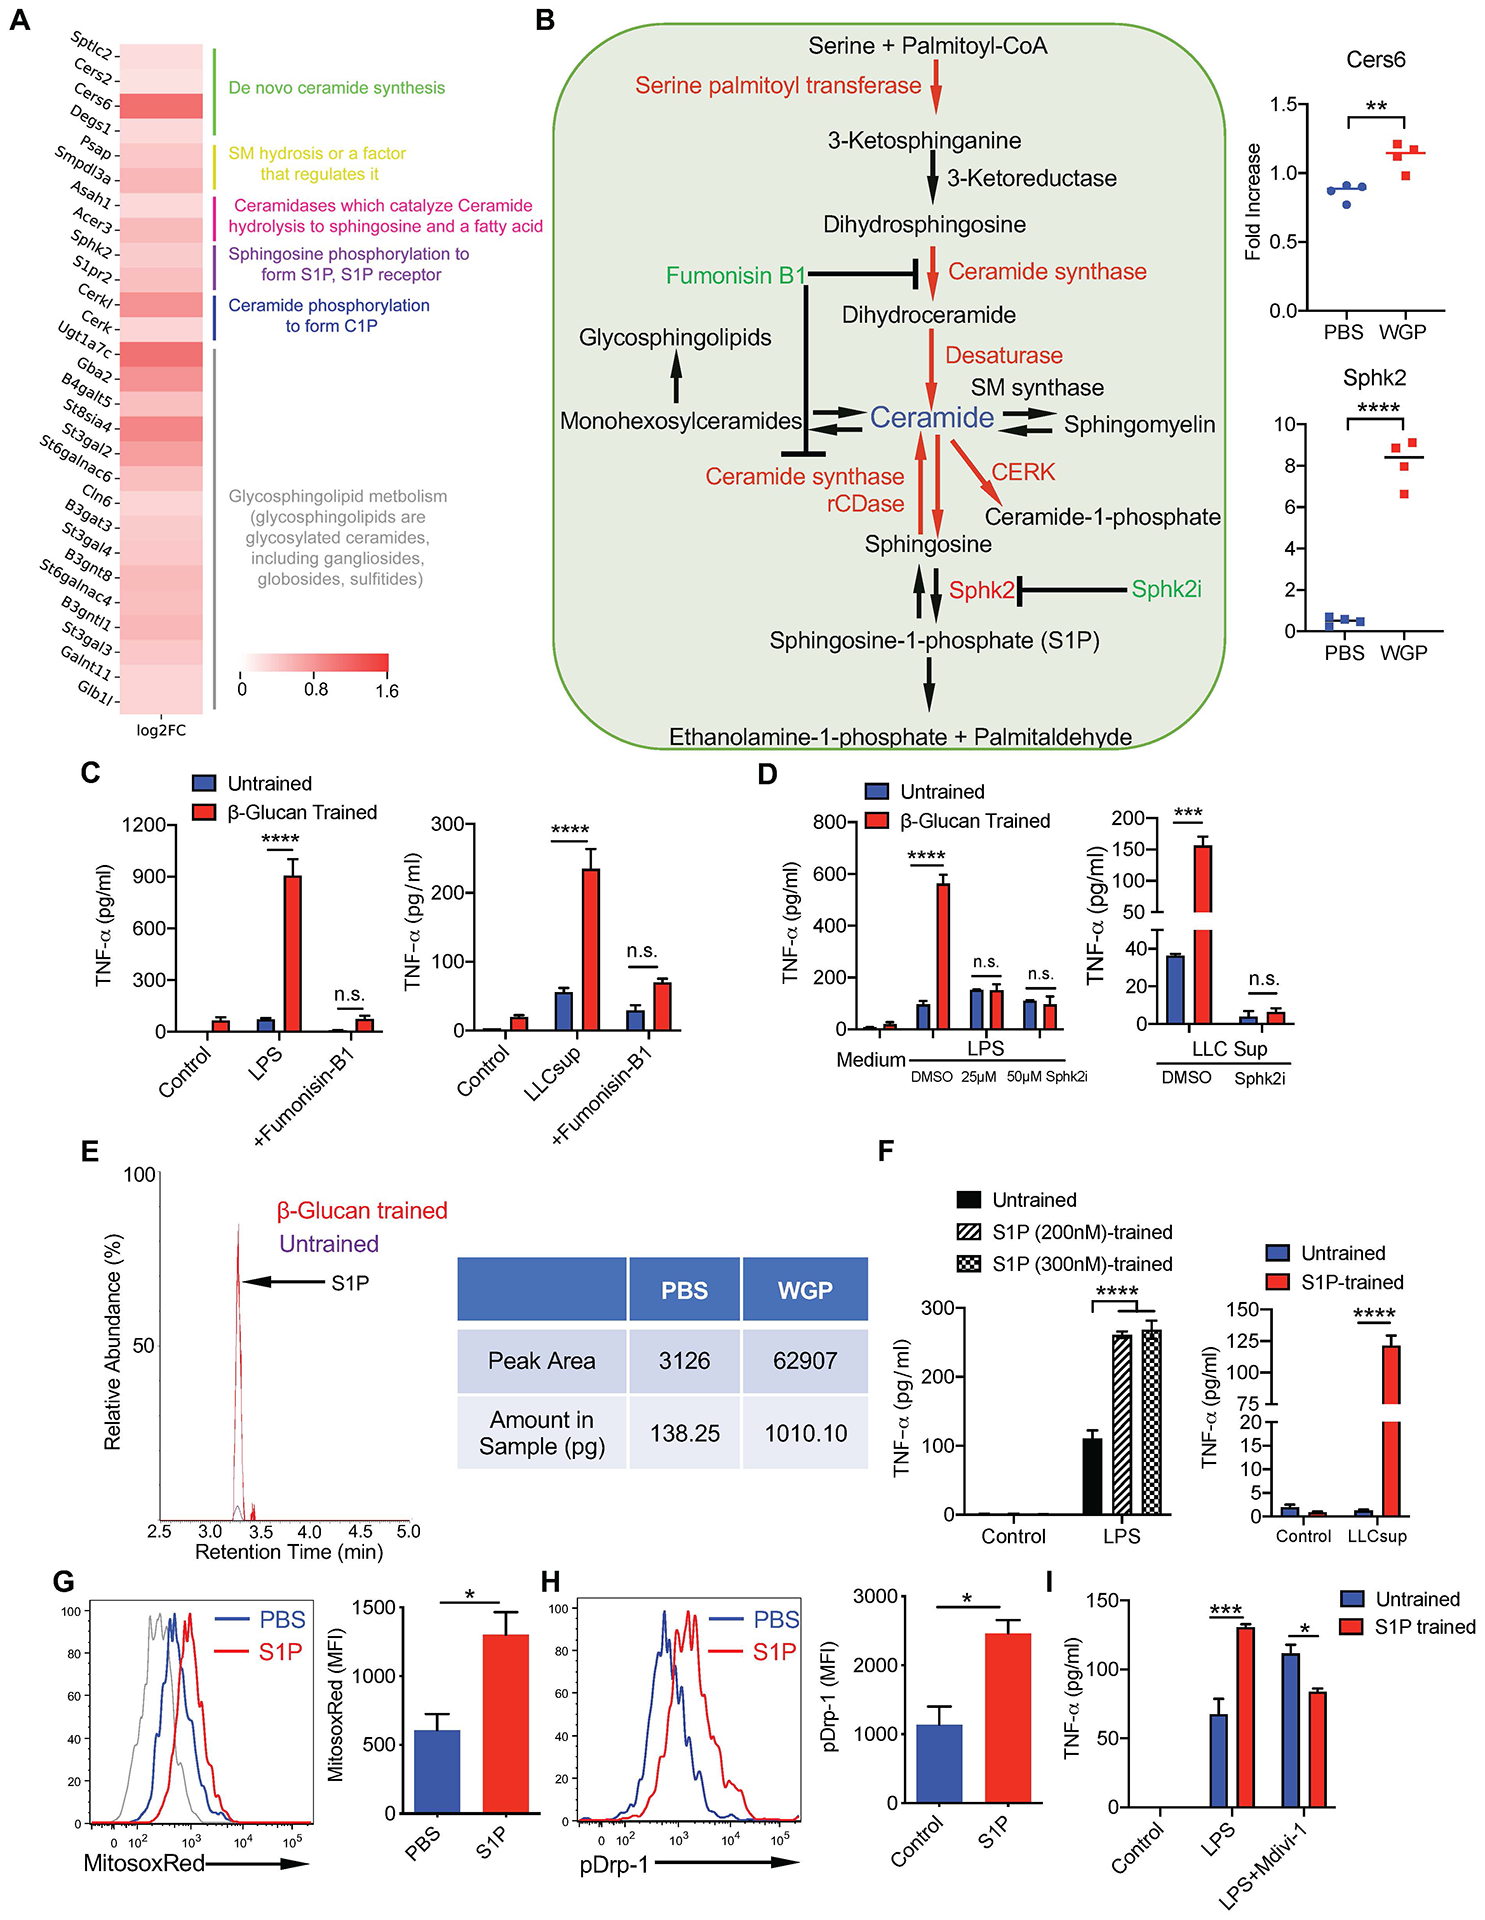
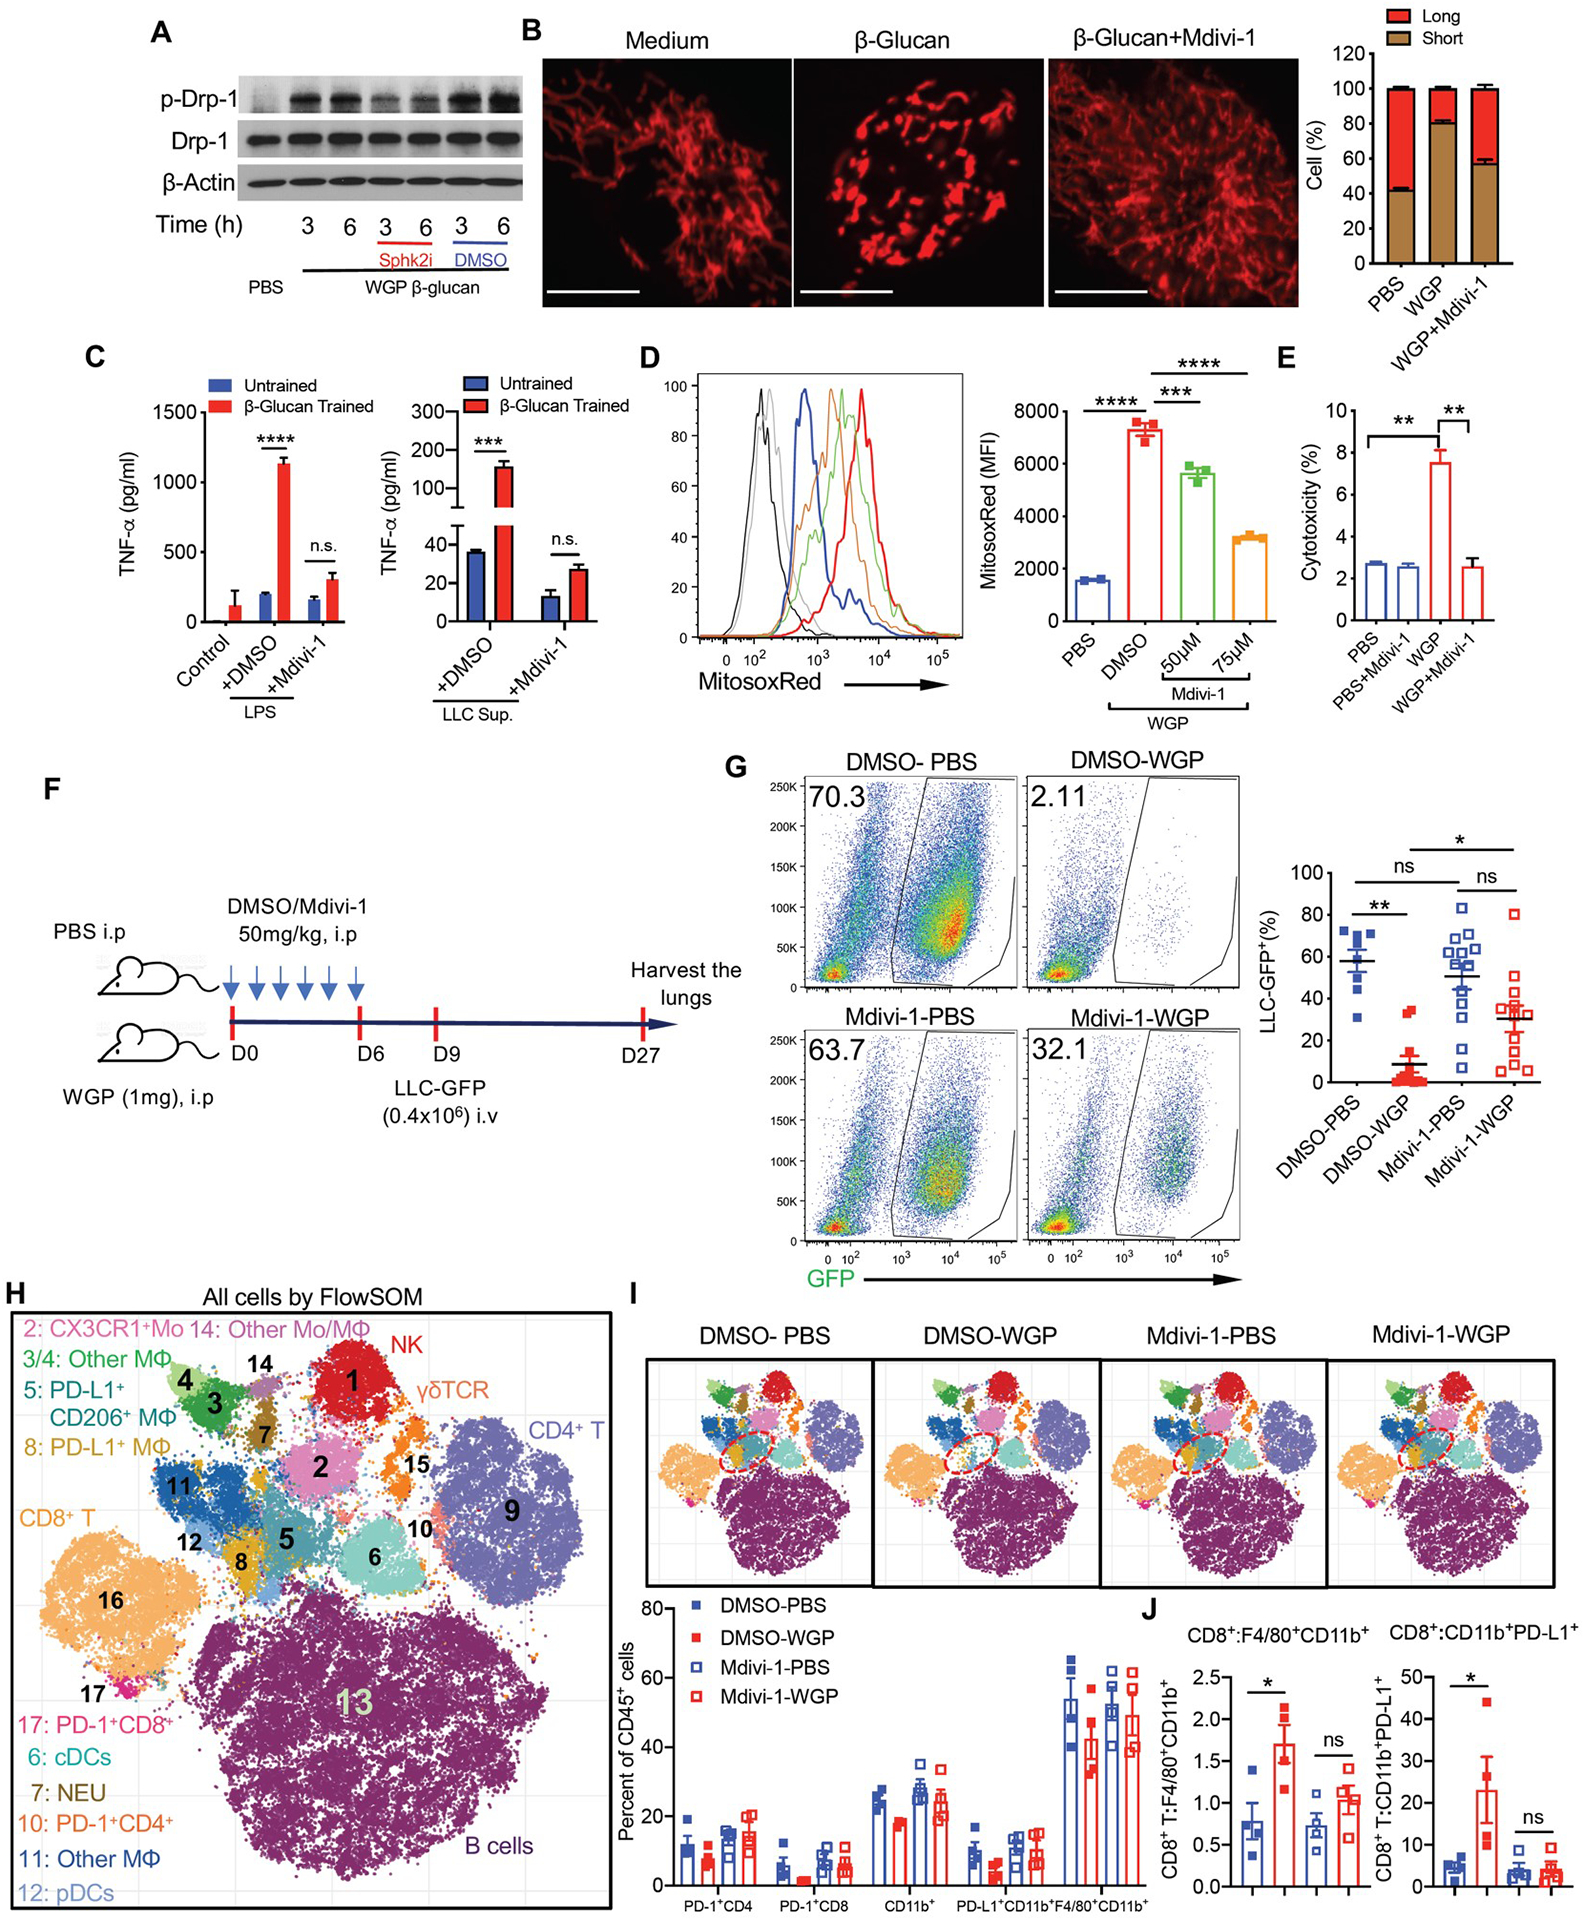
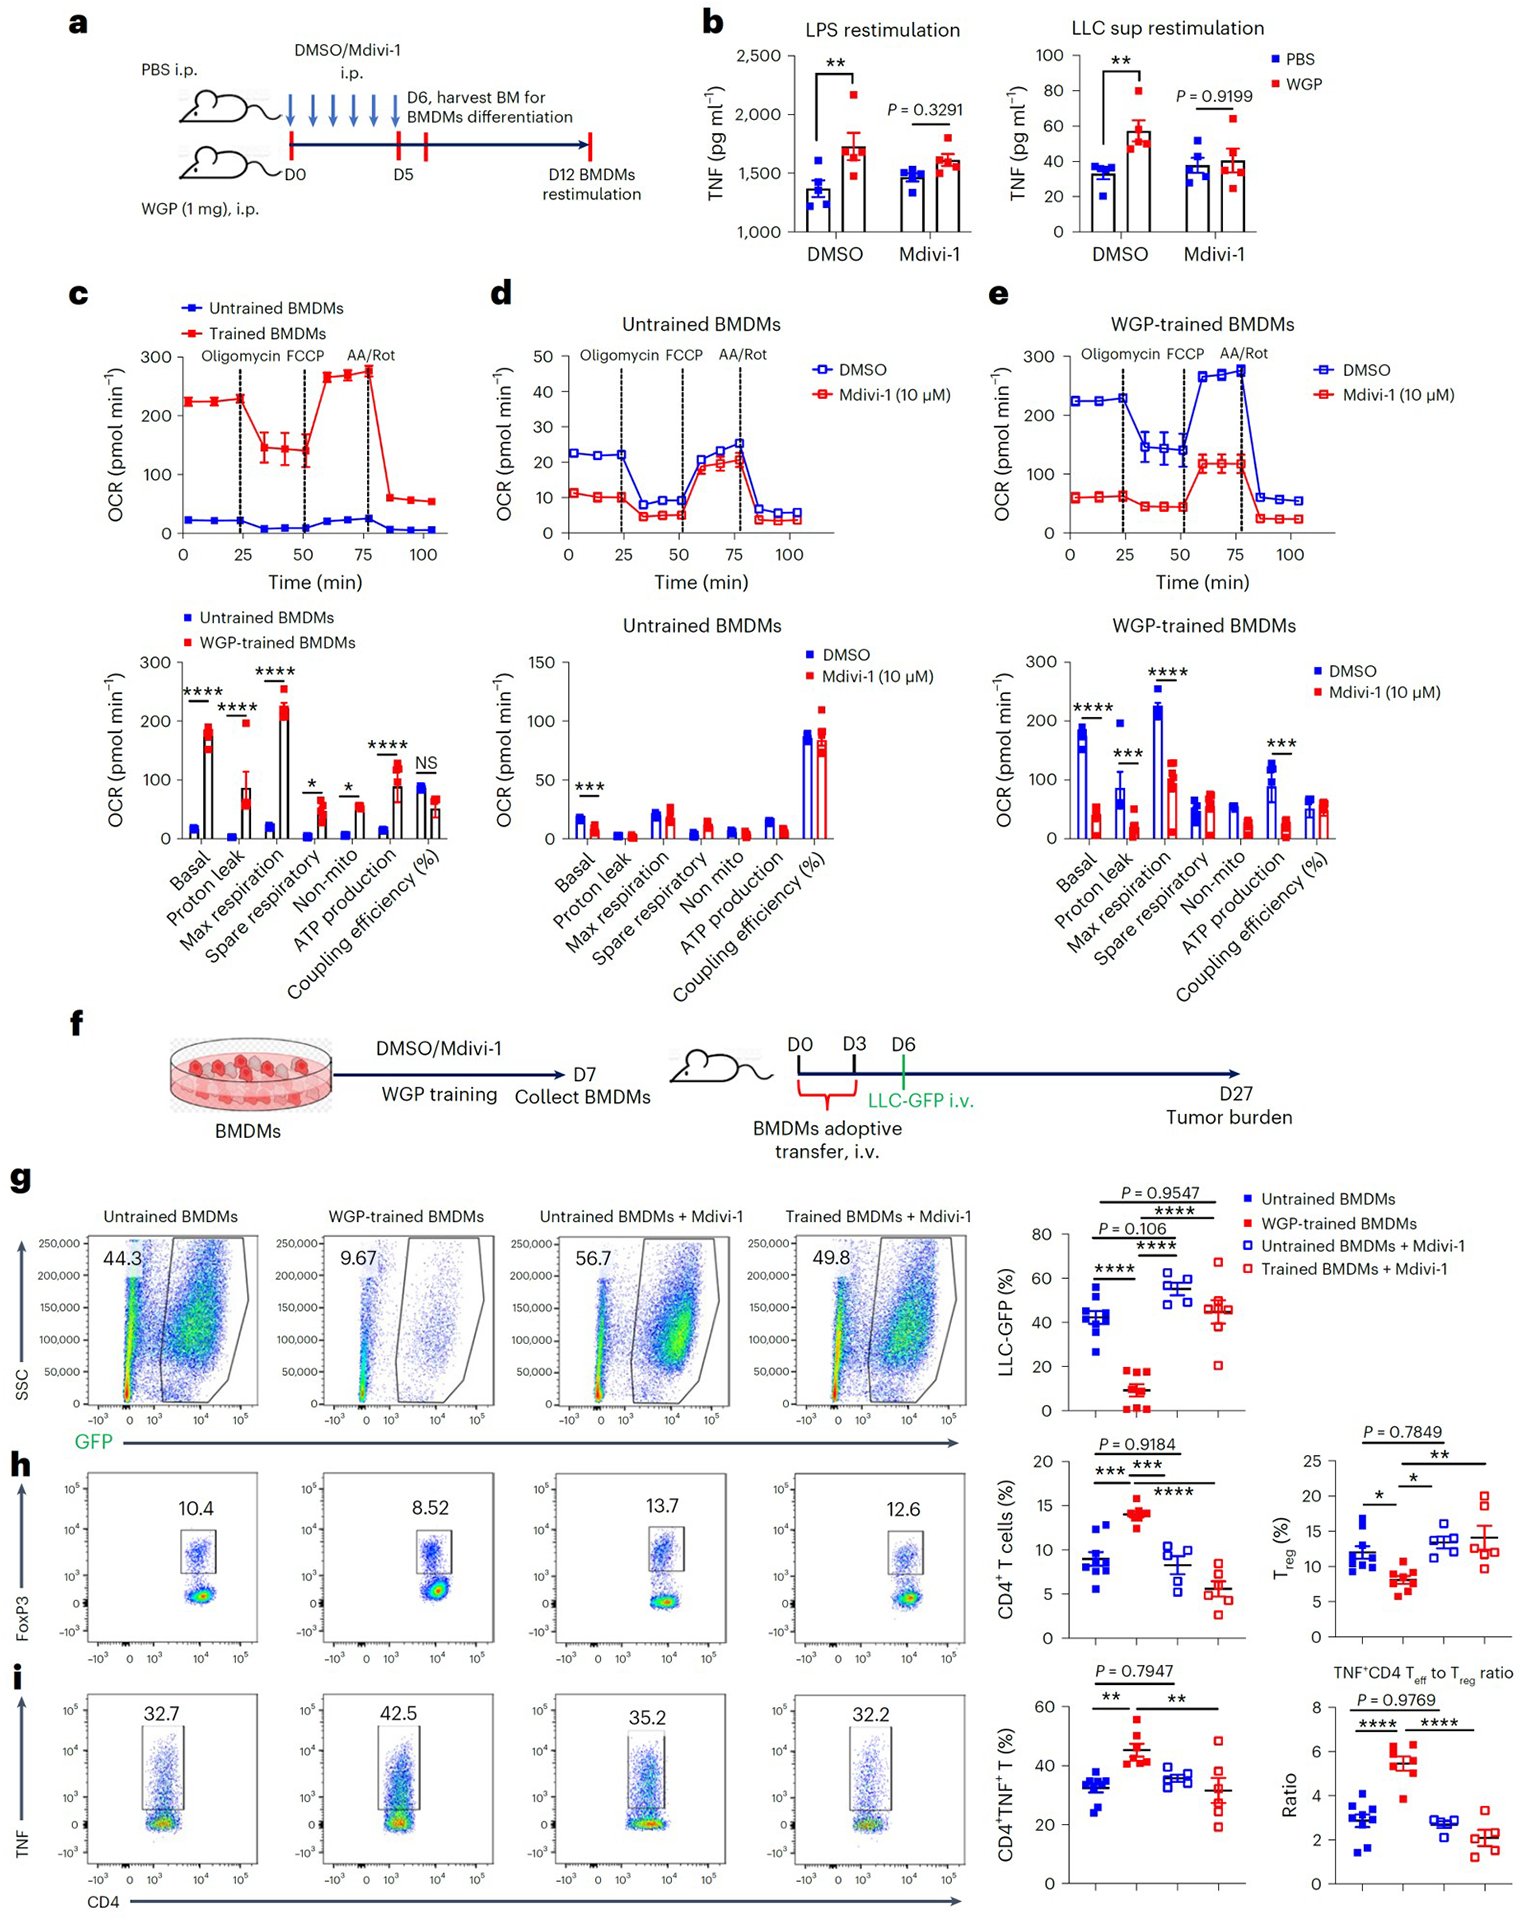
Metastasis is the leading cause of cancer-related deaths and myeloid cells are critical in the metastatic microenvironment. Here, we explore the implications of reprogramming pre-metastatic niche myeloid cells by inducing trained immunity with whole beta-glucan particle (WGP). WGP-trained macrophages had increased responsiveness not only to lipopolysaccharide but also to tumor-derived factors. WGP in vivo treatment led to a trained immunity phenotype in lung interstitial macrophages, resulting in inhibition of tumor metastasis and survival prolongation in multiple mouse models of metastasis. WGP-induced trained immunity is mediated by the metabolite sphingosine-1-phosphate. Adoptive transfer of WGP-trained bone marrow-derived macrophages reduced tumor lung metastasis. Blockade of sphingosine-1-phosphate synthesis and mitochondrial fission abrogated WGP-induced trained immunity and its inhibition of lung metastases. WGP also induced trained immunity in human monocytes, resulting in antitumor activity. Our study identifies the metabolic sphingolipid-mitochondrial fission pathway for WGP-induced trained immunity and control over metastasis.


Conflict of interest statement

Competing interests

The authors declare no competing interests.

Figures

Extended Data Fig. 1 |
Extended Data Fig. 1 |. WGP characterization.
a, Topography image and PFIR images at 1040 cm−1 of a dried WGP particle on silica substrate. b, PFIR spectra scan at 4 different spots marked in the zoom-in topography image. c, Stiffness and adhesion images of the same dried WGP particle. Scale bars: 2 μm; scale bars in zoom-in images: 500 nm. d, Phagocytosis process of WGP by GFP-Dectin-1 (green) RAW 264.7 macrophage. Dectin-1 was recruited and clustered at the site of phagocytic cups. Scale bars: 20 μm. e, Fluorescence confocal microscopy images (in maximum projection) showing heterogeneous recruitment of Dectin-1 receptors to phagosomes. Scale bars: 10 μm.
Extended Data Fig. 2 |
Extended Data Fig. 2 |. WGP mediates a systemic increase of trained macrophages.
a, Frequency of LSK cells (Linc-Kit+Sca-1+) and b, frequency of multi-potent progenitors (MPPs) (LincKit+Sca1+CD150CD48+) in the BM of PBS (n = 7) vs WGP-trained (n = 9) mice. Representative dot plots and summarized data from two independent experiments are shown. c, Frequency of CD11b+ myeloid cells in the spleen (n = 9–10) and lymph nodes (n = 7). Representative dot plots and pooled of two independent experiments are shown. d, Intracellular TNF levels on F4/80+ macrophages in the spleen and lymph node from PBS (n = 4) vs WGP-trained (n = 6) mice after ex vivo re-stimulation with LPS. Representative dot plots and summarized percent of TNF-α+ macrophages and MFI are shown. Data are representative of two independent experiments. e, Representative images for histology of the lungs from PBS, 24 h and 7 days post WGP treatment. Scale bar = 500μm. f, Gating strategy for Lung AM and IM. Data are presented as mean ± SEM. *P < 0.05, **P < 0.01, ***P < 0.001, ****P < 0.0001. P values were derived from unpaired two-tailed student’s t-test for a, b, d, e; one-way ANOVA with Tukey’s multiple comparison test for f, g.
Extended Data Fig. 3 |
Extended Data Fig. 3 |. Lung IMs bear a trained immunity upon WGP in vivo treatment.
a, CCR2 expression on lung AMs and IMs from naïve WT C57Bl/6 mice assessed by flow cytometry. b, Mice were trained with (n = 5) or without WGP (n = 4) (1 mg IP on day 0) and euthanized at day 7. Frequency of CCR2+ and CCR2 IMs was determined by flow cytometry. Representative dot plots and summarized data are shown. c, Both CCR2+ and CCR2 IMs display a trained immunity phenotype. Lung cells from WGP-trained or control mice were restimulated with LPS and intracellular TNF production was assessed by flow cytometry. Cells were gated on CCR2+ or CCR2 IMs. d, Summarized data ofpooled two independent experiments lung AMs and IMs from WT (n = 8) and CCR2 KO (n = 8) mice. e, WT and CCR2 KO mice were trained with or without WGP (n = 4). Lung cells were restimulated with LPS. Intracellular TNF was determined by flow cytometry. Representative dot plots and summarized percent and MFI data are shown. f, Mice were IP administered with PBS or WGP (0.5 mg) or WGP (2 mg) and analyzed for the lung IM phenotype at day 7 (n = 5). Frequency and MFI for intracellular TNF expression on lung IM after ex vivo re-stimulation with LPS were determine by flow cytometry. Representative dot plots and summarized percent and MFI data are shown. g, Mice were injected IP with PBS (n = 6) or WGP (1 mg/mouse, n = 6) or polystyrene beads (1 mg, n = 5) and analyzed for the lung IM phenotype at day 7. Frequency and MFI for intracellular TNF expression on lung IM after ex vivo re-stimulation with LPS. Representative dot plots and summarized percent and MFI data are shown. Data are representative as mean ± SEM. *P < 0.05, **P < 0.01, ***P < 0.001, ****p < 0.0001. P values were derived from one-way ANOVA with Tukey’s multiple comparison test.
Extended Data Fig. 4 |
Extended Data Fig. 4 |. WGP-induced training modulates T cells and BM progenitors.
a, PBS (n = 9) or WGP-trained (n = 10) mice were challenged with 0.4 × 10⁶ LLC cells intravenously. Mice were enthunized at day 16 for T cell phenotype analysis. Percentage of FoxP3+ Tregs, TNF expressing CD4+ and CD8+ T cells in the lungs from PBS vs WGP-trained mice. Data are representative of two independent experiments pooled together. b, Mice were trained with or without WGP (n = 5) for 7 days and then challenged with 0.4 × 10⁶ EL4 lymphoma cells i.v. followed by euthanizing at day 16 post tumor cell injection. Representative liver micrographs, summarized number of liver nodules, and liver weights of PBS and WGP-trained EL4 tumor cell-bearing mice are shown. c, CCR2 expression on lung IMs and intracellular TNF production in CCR2+ IMs from mice reconstituted with BM cells from WGP-trained or PBS control mice (n = 5). Representative dot plots and summarized data from one of two independent experiments are shown. Data are presented as mean ± SEM. **P < 0.01, ***P < 0.001, ****P < 0.0001. P values were derived from unpaired two-tailed student’s t-test for a, b and c.
Extended Data Fig. 5 |
Extended Data Fig. 5 |. Macrophages are the effector cells that control metastasis.
a, Depletion efficiency of lung IM and spleenic macrophages after Clodronate liposome (Clodrosome) injection. b, Summarized data for percentage of LLC-GFP cells in WGP-trained and untrained WT and CCR2 KO mice. WT and CCR2 KO mice were trained with PBS or WGP for a week followed by challenge with i.v. GFP-LLC cells (n = 5). Mice were then euthanized to analyze the tumor burden in the lungs 2 weeks later by flow cytometry. c, Schema for in vivo Ly6G depletion, WGP training, and tumor challenge protocol (n = 5, 5, 4, 5). d, Depletion efficiency of lung Ly6G+ neutrophils after weekly injections with Ly6G depletion antibody or isotype antibody by flow cytometry. e, Summarized data for percentage of LLC-GFP cells in neutrophil depleted or isotype antibody treated WGP trained and untrained mice. f, Depletion efficiency of CD4 and CD8 T cells in the lungs after CD4 and CD8 depletion antibody or isotype antibody injection. g, Representative dot plots and summarized data for intracellular TNF expression on lung IM after ex vivo LPS re-stimulation of PBS versus WGP-trained NSG mice (n = 4). h, Representative dot plots and summarized data for tumor burden in the lungs of WGP trained and untrained NSG mice. NSG mice trained with PBS (n = 7) or WGP (n = 9) were challenged with GFP-LLC cells i.v. and the lungs were harvested 48 h later to analyze the tumor burden in the lungs by flow cytometry. Data are representative of one of two independent experiments and presented as mean ± SEM. **P < 0.01, ***P < 0.001, ****P < 0.0001. P values were derived from two way ANOVA with Tukey’s multiple comparison test for b, one way ANOVA with Tukey’s multiple comparison test for e, unpaired two-tailed student’s t-test for g and h.
Extended Data Fig. 6 |
Extended Data Fig. 6 |. Trained lung IMs express DEGs related to innate function.
RNAseq was performed on lung IM sorted from PBS and WGP-trained mice (n = 3) on day 7. a, Volcano plot shows differentially expressed genes (DEGs) in WGP-trained lung IMs compared to PBS controls. Cers6 gene is among the top upregulated DEGs in WGP-trained lung IMs (circled). b, GO pathway analysis shows enriched pathways in WGP-trained lung IMs. c, GSEA plots show enriched differential pathways in WGP-trained lung IMs. DESeq2 for differential expression analysis was used for statistical analysis (a, b).
Extended Data Fig. 7 |
Extended Data Fig. 7 |. WGP-mediated training is independent of mTOR/HIF-1α or IL-1β.
a, TNF production by WGP-trained peritoneal macrophages sorted from Raptor cKO or control mice after LPS re-stimulation (n = 2). Data representative of one of three independent experiments. b, Percentage of LLC-GFP cells in the lungs from PBS vs WGP-trained control and Raptor cKO mice (n = 3, 3, 5, 7). Representative dot plots and summarized data for one of two independent experiments are shown. c, TNF production by WGP-trained peritoneal macrophages sorted from HIF-1α cKO or control mice after LPS re-stimulation (n = 3). Data representative of one of three independent experiments. d, Percentage of LLC-GFP cells in the lungs from PBS vs WGP-trained control and HIF-1α cKO mice (n = 5, 5, 11, 10). Representative dot plots and summarized data for two independent experiments pooled together are shown. e, TNF production by WGP-trained or untrained peritoneal macrophages sorted from IL-1R KO mice after LPS re-stimulation (left) (n = 4) and percentage of LLC-GFP cells in the lungs from PBS (n = 4) or WGP-trained IL-1R KO (n = 5) mice (right). f, TNF production by WGP-trained peritoneal macrophages sorted from WT and Nlrp3 KO mice after LPS re-stimulation (n = 4). Data are representative of one of two independent experiments and presented as mean ± SEM. **P < 0.01, ***P < 0.001, ****P < 0.0001. P values were derived from two-way ANOVA with Tukey’s multiple comparison test for a, c; one-way ANOVA with Tukey’s multiple comparison test for b, d, e, f.
Extended Data Fig. 8 |
Extended Data Fig. 8 |. WGP induces p-Drp-1 and mitochondrial fission in macrophages.
a, Summarized data for western blot of p-Drp-1 in peritoneal macrophages stimulated with WGP for different time points in the presence or absence of Sphk2i or DMSO vehicle control (n = 3). Data representative of three independent experiments pooled together. b, Representative images for Transmission Electron Microscopy (TEM) of untrained and WGP-trained peritoneal macrophages (left) and summarized data for mitochondrial lengths (right) (n = 100). Data are presented as mean ± SEM. **P < 0.01, ***P < 0.001, ****P < 0.0001. P values were derived from one-way ANOVA with Tukey’s multiple comparison test for a, chi-square test for b.
Extended Data Fig. 9 |
Extended Data Fig. 9 |. Mitochondrial fission is critical in WGP-induced trained immunity.
Mice were trained with PBS or WGP along with DMSO or Mdivi-1 daily treatment for 6 days (n = 5, 4, 5, 5). a, Summarized percentages of LSK+ cells (left) and MPPs (right) in the BM. b, Summarized percentages of lung total CD11b+ myeloid cells and IMs. Data are representative of one of two independent experiments. c, Intracellular TNF expression on lung IMs from PBS vs WGP-trained, DMSO vs Mdivi-1-treated mice. Representative dot plots and summarized data are shown. d, Representative tSNE plots show TNF production by CD4 and CD8 T cells in mice treated with different regimens. e, Schema for in vivo training with PBS or WGP in the presence of Sphk2 inhibitor or DMSO vehicle control and tumor challenge protocol (n = 9, 10, 9, 9). f, Representative dot plots and summarized data for percentage of GFP-LLC in the lungs. Mice were treated with Sphk2 inhibitor or vehicle control DMSO (50 mg/kg, i.p.) followed by PBS or WGP administration i.p. 2–3 h later. Treatment with Sphk2i or DMSO were performed daily until D5 followed by challenge with GFP-LLC i.v. Tumor burden in the lungs on D16 post-tumor challenge was analyzed. Data are pooled oftwo independent experiments. g, Schema for therapeutic model of BMDM adoptive transfer. 6 weeks old female C57Bl/6 mice were challenged with 0.4 × 10⁶ LLC-GFP tumor cells followed by two adoptive transfer of untrained or WGP-trained BMDM at D3 and D6 (n = 7). Mice were then euthanized at D16 to analyze the tumor burden in the lungs. h, Representative dot plots and summarized percentages for tumor burden in the lungs shown. Data are representative of one of two independent experiments and presented as mean ± SEM. *P < 0.05, **P < 0.01, ***P < 0.001, ****P < 0.0001. P values were derived from one-way ANOVA with Tukey’s multiple comparison test for a, b, c, f and h.
Extended Data Fig. 10 |
Extended Data Fig. 10 |. WGP induces trained immunity in human monocytes.
a, Human CD14+ monocytes from healthy donors (n = 4) were trained with WGP in vitro and then restimulated with LPS 7 days later. Culture supernatants were assayed for TNF and IL-6 by ELISA. b, WGP-trained monocytes were re-stimulated with culture supernatants from A549 or HBEC. TNF and IL-6 were measured by ELISA. c, WGP-induced mitochondrial ROS assessed by MitoSox staining (n = 6, 11). d, Western blot analysis for phosphorylation of Drp-1 (p-Drp-1 (n = 3). e, Flow cytometry analysis for p-Drp1 in control vs WGP-trained monocytes (n = 2). f, TEM images for untrained and WGP-trained monocytes. Representative images and summarized data for mitochondrial lengths (n = 100) are shown. g, Intracellular S1P quantitation in untrained vs WGP-trained human monocytes by LC/MS/MS. h, S1P-induced mitochondrial ROS assessed by Mitosox staining (n = 7, 8). i, Flow cytometric analysis of p-Drp1 for S1P-treated human monocytes (n = 4). j, Human monocytes trained with WGP were re-stimulated with LPS in the presence or absence of Mdivi-1. TNF production was measured by ELISA (n = 4). k, Human monocytes trained with or without WGP were co-cultured with luciferase+ A549 lung cancer cells at 10:1 and 20:1 ratios for 12–16 h (n = 5). Cytotoxicity was assessed as a measure of luciferase activity using a luminometer. l, Bioluminescence imaging (BLI) of NSG mice with orthotopic A549-luciferase tumor admixed with control (n = 6) vs WGP-trained human CD14+ (n = 9) monocytes. Data in c, d, and l are poold from two to three independent experiments . Data in a, b, e, g, h, i, j, and k are representative of two or three independent experiments. All data are presented as mean ± SEM. **P < 0.01, ***P < 0.001, ****P < 0.0001.P values were derived from two-way ANOVA with Tukey’s multiple comparison test for a, b, j, k; unpaired two-tailed student’s t-test for c, d, e, g, h, i, l; chi-square test for f.
Fig. 1 |
Fig. 1 |. WGP-induced trained immunity in macrophages.
a, Schema for WGP in vitro training assay (left). TNF production by in vitro WGP-trained (n = 6) or untrained (n = 6) peritoneal macrophages after LPS restimulation assessed by ELISA (right). b, TNF production by in vitro WGP-trained and untrained peritoneal macrophages of WT (n = 5) and Dectin-1-deficient mice (n = 5). c, TNF production by WGP-trained peritoneal macrophages versus those treated with polystyrene beads after LPS restimulation (n = 3). Untrained macrophages were used as control. d, HK2 expression in untrained (n = 3) or WGP-stimulated (n = 4) macrophages. Representative western blot and summarized densitometry data. P value was derived from an unpaired two-tailed Student’s t-test. e, TNF production by in vitro WGP-trained or untrained peritoneal macrophages (n = 3) upon co-culture with LLC and MLE-12 cells. f, TNF production by in vitro WGP-trained or untrained peritoneal macrophages (n = 2) co-cultured with B16F10 (left) and EL4 cells (right). g, TNF production by in vitro WGP-trained or untrained peritoneal macrophages (n = 2, 3) upon LLC or MLE-12 culture supernatant (sup) restimulation (left), and B16F10 or EL4 culture supernatant restimulation (right). h, Levels of MIF (n = 2) from different cell culture supernatants measured by ELISA. i, TNF production by in vitro WGP-trained or untrained peritoneal macrophages upon rMIF restimulation (n = 4). j, TNF production by WGP-trained peritoneal macrophages from WT (n = 2) and MIF KO (n = 3) after LPS or LLC supernatant (40%) restimulation. k, TNF production by WGP-trained and untrained peritoneal macrophages upon restimulation with LLC supernatant in the presence or absence of MIF neutralizing monoclonal antibody (mAb; n = 3). l, TNF production by WGP-trained and untrained BMDMs from WT (n = 3) and CD74 KO mice (n = 3) upon restimulation with rMIF, LLC supernatant and LPS. Data are representative of two or three independent experiments and presented as the mean ± s.e.m. **P < 0.01, ****P < 0.0001. P values were derived from two-way analysis of variance (ANOVA) with a Tukey’s multiple-comparison test (ac, eg and il).
Fig. 2 |
Fig. 2 |. In vivo whole beta-glucan particle treatment trains lung interstitial macrophages.
Six-week-old C57BL/6 mice were injected with WGP (1 mg) or i.p. PBS on day 0 and the lungs were collected on day 7. Single-cell suspensions were stained for analysis by flow cytometry. a, Frequency of total viable, CD45+ cells in the lungs of PBS (n = 4) and WGP (n = 6) trained mice. b, Frequency of CD11b+ myeloid cells in the lungs of PBS (n = 4) and WGP (n = 6) trained mice. Cells were gated on viable, CD45+ cells. c, Frequency of AMs and IMs in the lungs of PBS (n = 7) and WGP (n = 9) trained mice. Cells were gated on viable, CD45+ cells. d, Frequency of inflammatory monocytes and patrolling monocytes in the lungs of mice trained with PBS (n = 7) and WGP (n = 9). Cells were gated on viable, CD11b+ cells. eg, Percentage and mean fluorescence intensity (MFI) of intracellular TNF expression in lung IMs and AMs of PBS (n = 5) and WGP (n = 5) trained mice after ex vivo stimulation with LPS (e), LLC culture supernatants (n = 5 versus 5; f) or rMIF (n = 4 versus 4; g). Representative dot plots and summarized data are shown. *P < 0.05, **P < 0.01, ***P < 0.001, ****P < 0.0001. P values were determined by an unpaired two-tailed student’s t-test. Data are representative of two individual experiments and presented as the mean ± s.e.m.
Fig. 3 |
Fig. 3 |. Whole beta-glucan particle-induced trained response inhibits metastasis.
a, Schema for in vivo WGP training and tumor challenge. b, Six-week-old C57BL/6 mice trained with PBS (n = 13) and WGP (n = 13) were injected with 0.4 × 10⁶ LLC-GFP cells i.v. and tumor burden in the lungs was analyzed 14–16 d after tumor challenge by flow cytometry. Representative dot plots and summarized percentage of LLC-GFP cells in the CD45 population in the lungs are shown (up). Data are representative of two individual experiments combined. Histological analysis of the lungs from LLC-GFP tumor-bearing mice trained with PBS (n = 3) versus WGP (n = 3; down). c, Summarized frequencies of LLC-GFP cells in the lungs from tumor-bearing PBS versus WGP-trained mice. Mice were trained with PBS (n = 4) or WGP on days −7 (n = 5), −14 (n = 5) and −21 (n = 5), before tumor challenge. d, Long-term survival of mice trained with PBS (n = 7) versus WGP (n = 8) injected with 0.2 × 10⁶ LLC-GFP cells i.v. on day 0. e, Six-week-old female C57BL/6 mice were trained at day −7, challenged with i.v. injections of 0.4 × 10⁶ B16F10 tumor cells at day 0 and the lungs were collected at day 16 (left). Representative lung micrographs from PBS-trained (n = 5) versus WGP-trained (n = 5) B16F10 tumor-bearing mice. Black dots are melanoma lung metastasis nodules. Long-term survival of PBS-trained (n = 5) and WGP-trained (n = 7) mice challenged with B16F10 tumor cells (0.1 × 10⁶; right). f, Schema for BM chimeric experiment. g, Tumor burden (LLC-GFP) from recipient mice reconstituted with BM cells from WGP-trained (n = 5) or PBS control (n = 5) mice. Representative flow plots and summarized data are shown. h, Intracellular TNF production in lung IMs from mice reconstituted with BM cells from WGP-trained or PBS control mice. Data are representative of two independent experiments and presented as the mean ± s.e.m. *P < 0.05, **P < 0.01, ***P < 0.001. P values were derived from an unpaired two-tailed Student’s t-test for b, g and h, a one-way ANOVA for c and a Kaplan–Meier plot for d and e.
Fig. 4 |
Fig. 4 |. Whole beta-glucan particle-trained lung interstitial macrophages inhibit metastasis and lung cancer.
a, Schema for in vivo macrophage depletion by Clodrosome, WGP training, and tumor challenge in 6 weeks old C57BL/6 mice. b, Tumor burden in the lungs of PBS-trained (n = 4), WGP-trained (n = 5) and WGP-trained macrophage-depleted mice (n = 4) injected with 0.4 × 10⁶ LLC-GFP cells 16 d after tumor challenge. Representative dot plots and summarized data are shown. c, Tumor burden in the lungs of PBS-trained (n = 4), WGP-trained (n = 5) and neutrophil-depleted WGP-trained (n = 5) mice. d, Tumor burden in the lungs of PBS-trained (n = 5), WGP-trained (n = 4) mice versus WGP-trained CD4+ T cell-depleted (n = 5), WGP-trained CD8+ T cell-depleted (n = 5) or WGP-trained CD4+ and CD8+ T cell-depleted mice (n = 4) mice. e, Schema for 4T1 primary mammary tumor resection and WGP treatment protocol. Six-week-old female Balb/c mice were implanted with 0.1 × 10⁶ 4T1 tumor cells on the fourth mammary pad. Tumors were surgically resected after a week and mice were treated with PBS or WGP 5 d after resection. Long-term survival was monitored. f, Intracellular TNF expression on lung IMs after ex vivo LPS restimulation of PBS and WGP-trained Balb/c mice. g, Long-term survival of PBS (n = 8) and WGP-trained (n = 8) 4T1 tumor resected Balb/c mice. h, Schema for in vivo treatment of 4T1 primary mammary cancer model. i, Representative lung histology and summarized lung tumor nodules from WGP-treated (n = 5) or untreated (n = 6) mice. j, Schema for in vivo treatment of spontaneous K-rasLA1 mice. K-rasLA1 mice were injected with WGP (1 mg, i.p.) or PBS at 6, 9, 12 and 15 weeks of age and euthanized at 17 weeks to analyze tumor development in the lungs. k, Number of lung tumor nodules of PBS (n = 9) versus WGP-treated (n = 9) K-rasLA1 mice. Combined data from three independent experiments are shown. l, Representative histology of lungs of PBS versus WGP-treated K-rasLA1 mice. Data are representative of two independent experiments and presented as the mean ± s.e.m. NS, not significant, *P < 0.05, **P < 0.01, ***P < 0.001, ****P < 0.0001. P values were derived from one-way ANOVA with Tukey’s multiple correction for bd, a Kaplan–Meier plot for g and an unpaired two-tailed Student’s t-test for i and k. i.m., intramuscular.
Fig. 5 |
Fig. 5 |. Whole beta-glucan particle training increases phagocytic and cytotoxic activity of lung interstitial macrophages.
a, GSEA plot for the regulation of phagocytosis and heat map for the genes related to the phagocytosis regulation pathway. NES, normalized enrichment score. b, Phagocytosis assay was performed with lung AMs and IMs from WGP-trained (n = 4) or PBS control (n = 4) mice. Phagocytosis of pHrodo-green-labeled S. aureus was analyzed by flow cytometry. Representative dot plots and summarized data are shown. c, In vitro cytotoxicity assay using sorted lung IMs from PBS control (n = 3) or WGP-trained (n = 3) mice and co-cultured with LLC cells at different ratios. Cells were cultured for 16 h and cytotoxicity was measured by lactate dehydrogenase (LDH) release assay. d, In vivo cytotoxicity assay. Six-week-old C57BL/6 PBS control (n = 5) and WGP-trained (n = 5) mice were i.v. injected with 1 × 10⁶ LLC-GFP cells and were analyzed for the frequency of LLC-GFP cells in the lungs after 24 h. Representative dot plots and summarized data are shown. e, GSEA plot for ROS biosynthetic process and heat map for the related leading genes in the WGP-trained lung IMs. f, MitoSox Red staining for PBS and WGP-treated peritoneal macrophages. Peritoneal macrophages were treated with PBS (n = 8) or WGP (n = 9) for 24 h and then stained with MitoSox Red and analyzed by flow cytometry. Representative histogram and summarized data from two independent experiments are shown. g, Lung IMs sorted from WGP-trained mice (n = 3) were co-cultured with LLC target cells in the presence or absence of Mito-TEMPO at a 10:1 ratio. Cytotoxicity was measured by the LDH release assay. Data are representative of two independent experiments and presented as the mean ± s.e.m. For a and e, nominal P values were used to determine significance. When the nominal P value is represented as 0, this means P < .0001. The nominal P value was calculated by empirical phenotype-based permutation test. *P < 0.05, **P < 0.01, ****P < 0.0001. P values were derived from an unpaired two-tailed student’s t-test for b, d and f, a two-way ANOVA with Tukey’s multiple-comparison test for c and a one-way ANOVA for g.
Fig. 6 |
Fig. 6 |. Whole beta-glucan particle treatment activates sphingolipid synthesis in macrophages.
a, Heat map for the genes upregulated in the sphingolipid synthesis pathway in the WGP-trained lung IMs. b, Detailed schema for the sphingolipid synthesis pathway and RT–qPCR for CerS6 and Sphk2 mRNA expression in PBS (n = 4) and WGP-trained lung IMs (n = 4). c, TNF production by WGP-trained or untrained peritoneal macrophages in the presence of fumonisin-B1 (25 μM) or vehicle control DMSO. Peritoneal macrophages were trained with WGP in the presence of fumonisin-B1 or DMSO for 7 d and restimulated with LPS (n = 2 versus 3) or LLC culture supernatants (n = 3 versus 3). d, TNF production by WGP-trained (n = 2) or untrained peritoneal macrophages (n = 2) in the presence of Sphk2i (25 μM or 50 μM) or DMSO upon LPS or LLC culture supernatant restimulation. e, Representative mass spectrometry measurement of S1P in the in vitro WGP-trained or untrained peritoneal macrophages. One representative from three independent experiments with similar data. f, TNF production by S1P-trained (n = 3) versus untrained peritoneal macrophages (n = 3) after LPS or LLC culture supernatant restimulation. g, MitoSox Red staining on PBS (n = 3) versus S1P-trained peritoneal macrophages (n = 5) was analyzed by flow cytometry. Representative histogram and summarized data are shown. h, The p-Drp-1 expression in S1P-stimulated peritoneal macrophages assessed by flow cytometry. i, TNF production by S1P-trained (n = 2) versus untrained peritoneal macrophages (n = 2) in the presence of Mdivi-1 or vehicle control after LPS restimulation. Data are representative of one of three independent experiments and presented as the mean ± s.e.m. *P < 0.05, **P < 0.01, ***P < 0.001, ****P < 0.0001. P values were derived from an unpaired two-tailed Student’s t-test for b, g and h and two-way ANOVA with Tukey’s multiple-comparison test for c, d, f and i.
Fig. 7 |
Fig. 7 |. Mitochondrial fission is critical for training of lung interstitial macrophage control over metastasis.
a, Peritoneal macrophages were treated with PBS or WGP (50 μg ml−1) in the presence of Sphk2i (50 μM) or DMSO for 3 h and 6 h. The level of p-Drp-1 and total Drp-1 was determined by western blot. Data are representative of one of two independent experiments. b, Mitochondrial fission in PBS and WGP-trained versus WGP + Mdivi-1 (10 μM)-treated peritoneal macrophages. Macrophages were stained with TMRM and analyzed by confocal microscopy. The mitochondrial lengths were analyzed by ImageJ. Representative images and summarized data of one of two independent experiments are shown. Scale bar, 10 μm. c, TNF levels by PBS (n = 2) and WGP-trained peritoneal macrophages (n = 2) in the presence of Mdivi-1 (10 μM) or DMSO after LPS and LLC culture supernatant restimulation. Data are representative of one of three independent experiments. d, MitoSox Red staining on PBS (n = 2) and WGP-trained peritoneal macrophages (n = 3) in the presence of Mdivi-1 (50 μM and 75 μM) using flow cytometry. Representative histogram and summarized data from one of the two independent experiments are shown. e, Cytotoxicity of PBS (n = 3) and WGP-trained peritoneal macrophages (n = 3) in the presence of Mdivi-1 (10 μM) or DMSO co-cultured with LLC target cells at a ratio of 10:1 using the LDH release assay. f, Schema for Mdivi-1 in vivo treatment and tumor challenge. g, Tumor burden in the lungs from mice trained with or without WGP along with Mdivi-1 (n = 12, 13) or DMSO (n = 8, 11) treatment. Representative dot plots and summarized data from two independent experiments are shown. h,i, viSNE analysis of CyTOF immunophenotyping of the lungs from mice trained with or without WGP and treated with Mdivi-1 or DMSO (n = 4). All samples combined (h), combined samples from each group (i, top), and frequencies in different groups (i, bottom). j, The ratios of CD8+ T cells to F4/80+CD11b+ and CD11b+PD-L1+ myeloid cells are shown. Data are presented as the mean ± s.e.m. *P < 0.05, **P < 0.01, ***P < 0.001, ****P < 0.0001. P values were derived from two-way ANOVA with Tukey’s multiple-comparison test for c; one-way ANOVA with Tukey’s multiple-comparison test for d, e, g and j.
Fig. 8 |
Fig. 8 |. Mitochondrial fission is essential for bone marrow-derived macrophage-trained immunity.
a, Schema for in vivo training, Mdivi-1 or DMSO treatment, and BMDM differentiation. Six-week-old C57BL/6 mice were trained with or without WGP along with Mdivi-1 (50 mg per kg body weight, i.p.) or DMSO treatment. BM cells were collected on day 6. b, BMDMs from different groups were stimulated with LPS or LLC supernatant (n = 5). The culture supernatants were collected to measure TNF levels by ELISA. c, In vitro WGP-trained BMDMs (n = 5) and untrained BMDMs (n = 6) were subjected to Seahorse Mito Stress Test assay. Seahorse Mito Stress Test with sequential addition of oligomycin, FCCP and antimycin A (AA)/Rot. OCR bioenergenic profiling showing relative values of parameters for representative Seahorse assay (above) is shown. d, Seahorse Mito Stress Test in untrained BMDMs in the presence of Mdivi-1 (n = 8) or vehicle control (n = 6). OCR bioenergenic profiling showing relative values of parameters for representative Seahorse assay is also shown. e, Seahorse Mito Stress Test in WGP-trained BMDMs in the presence of Mdivi-1 (n = 8) or DMSO (n = 8). OCR bioenergenic profiling showing relative values of parameters for representative Seahorse assay is also shown. f, Schema for in vitro WGP training in BMDMs and adoptive transfer. g, Lungs were collected from mice that received BMDMs from different groups and tumor burden was assessed by flow cytometry (n = 9, 8, 5 and 7). Representative flow plots and summarized data are shown. Cells were gated on the CD45 population. h, Lung single-cell suspensions were stained with CD4 and FoxP3. Representative flow plots and summarized total CD4+ and CD4+FoxP3+ Treg cell percentages are shown (n = 9, 8, 5 and 6). i, Representative flow plots and summarized data for TNF expression in lung CD4+ T cells (left) (n = 9, 7, 5 and 6) and summarized ratios of effector CD4+ T cells (TNF+CD4+) to FoxP3+ Treg cells (n = 9, 7, 5 and 5) are shown. Data are representative of one of two independent experiments and are presented as the mean ± s.e.m. **P < 0.01, ***P < 0.001, ****P < 0.0001. P values were derived from two-way ANOVA with Sidak’s multiple-comparison test for b, two-way ANOVA with Tukey’s multiple-comparison test for ce and one-way ANOVA with Tukey’s multiple-comparison test for gi.

References

    1. Welch DR & Hurst DR Defining the hallmarks of metastasis. Cancer Res 79, 3011–3027 (2019). - PMC - PubMed
    1. Kaplan RN et al. VEGFR1-positive haematopoietic bone marrow progenitors initiate the pre-metastatic niche. Nature 438, 820–827 (2005). - PMC - PubMed
    1. Kaplan RN, Rafii S & Lyden D Preparing the ‘soil’: the premetastatic niche. Cancer Res. 66, 11089–11093 (2006). - PMC - PubMed
    1. Morrissey SM et al. Tumor-derived exosomes drive immunosuppressive macrophages in a pre-metastatic niche through glycolytic dominant metabolic reprogramming. Cell Metab. 33, 2040–2058 (2021). - PMC - PubMed
    1. Kaczanowska S et al. Genetically engineered myeloid cells rebalance the core immune suppression program in metastasis. Cell 184, 2033–2052 (2021). - PMC - PubMed

Publication types