. 2023 Feb;24(2):295-308.
doi: 10.1038/s41590-022-01386-w. Epub 2023 Jan 5.

Human TH17 cells engage gasdermin E pores to release IL-1α on NLRP3 inflammasome activation

Affiliations

Human TH17 cells engage gasdermin E pores to release IL-1α on NLRP3 inflammasome activation

Ying-Yin Chao et al. Nat Immunol. 2023 Feb.

Abstract

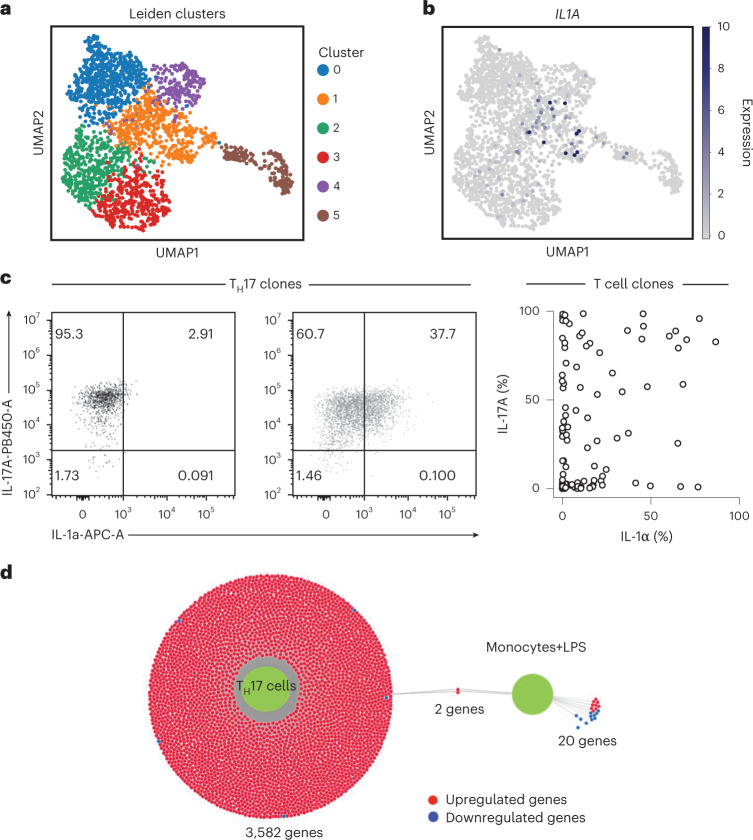
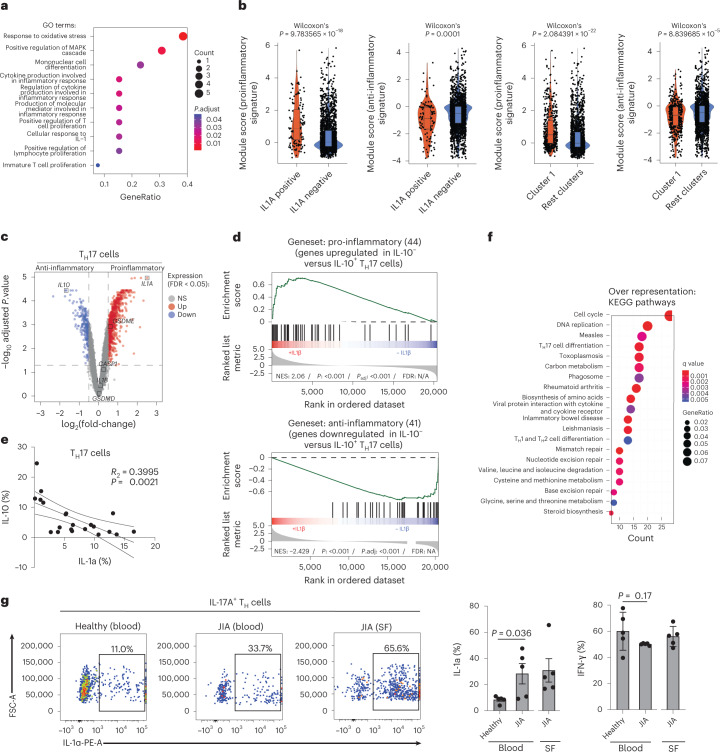
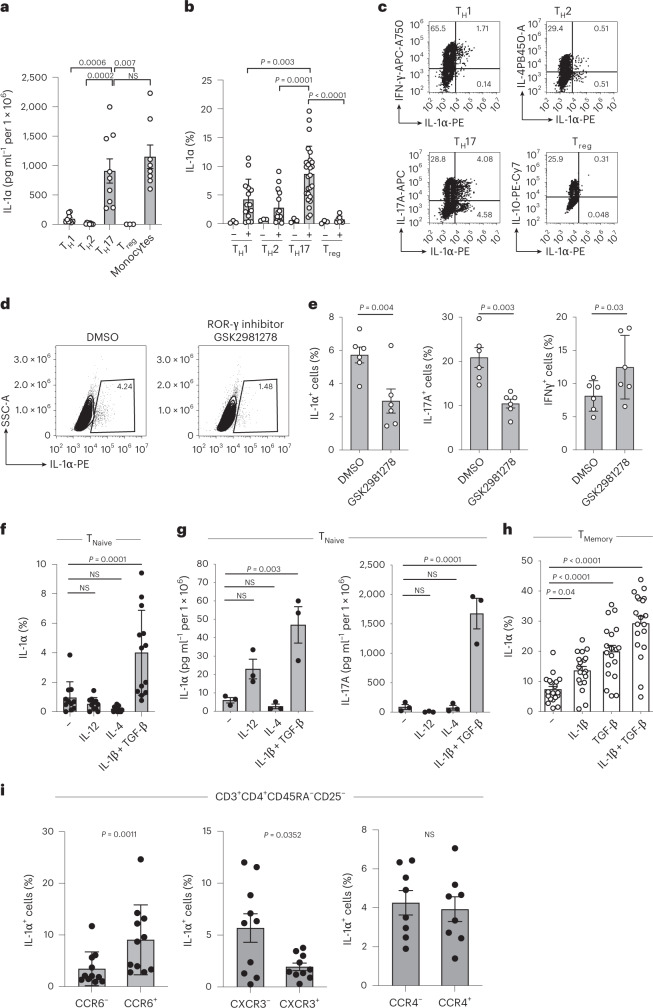
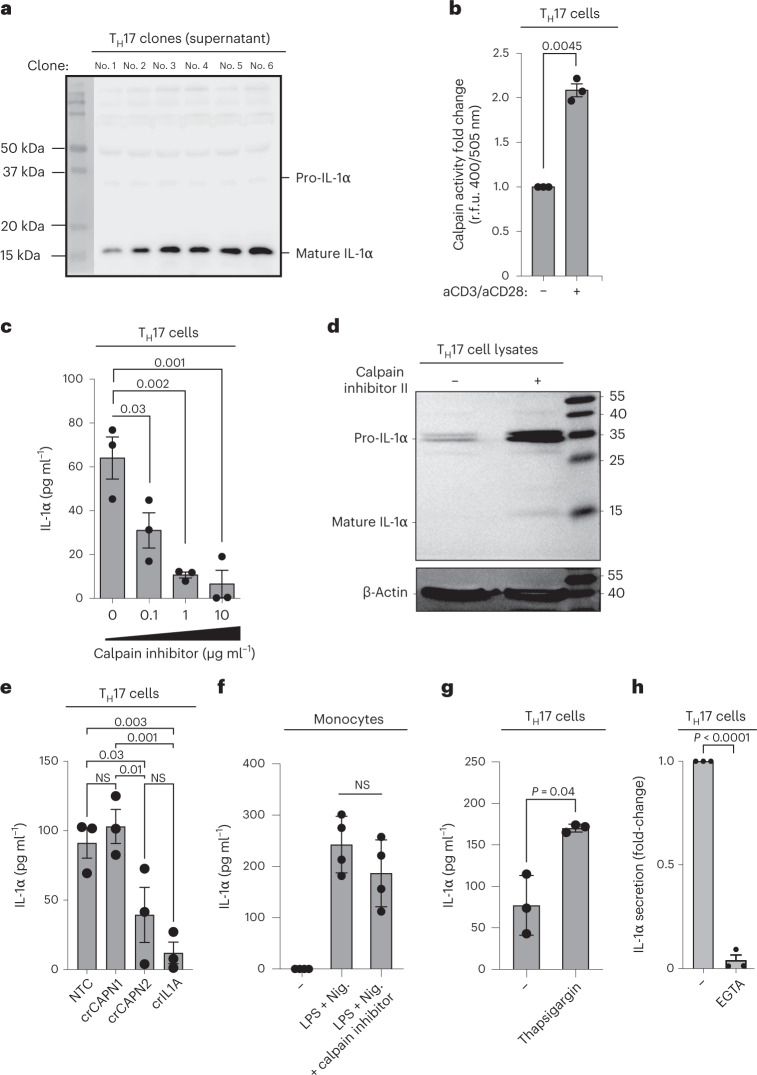
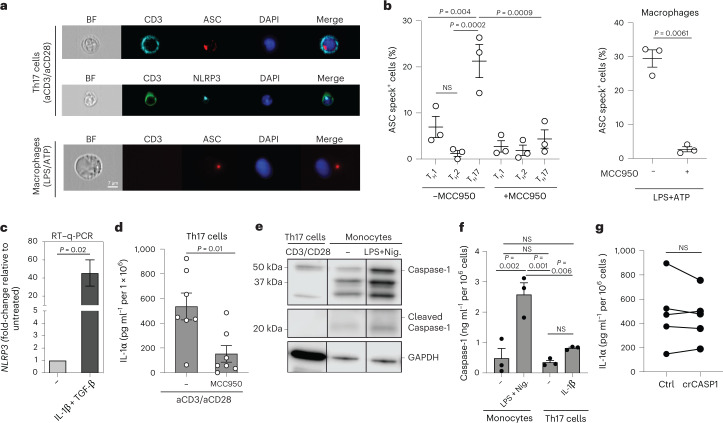
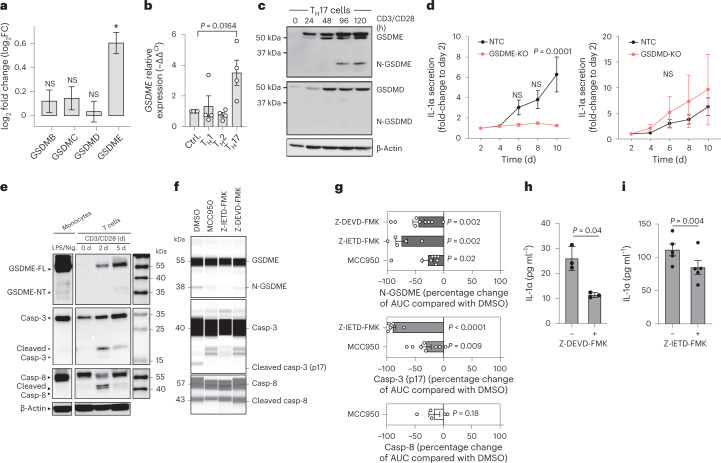
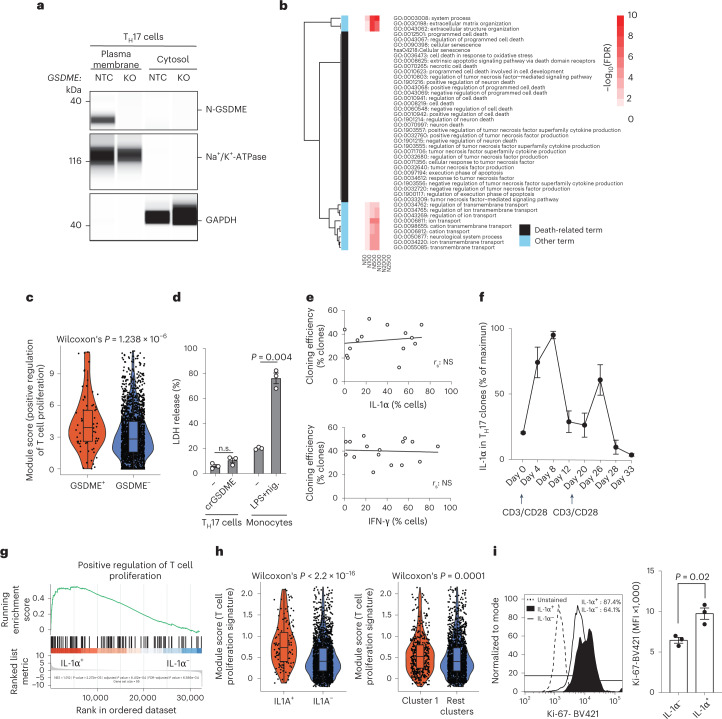
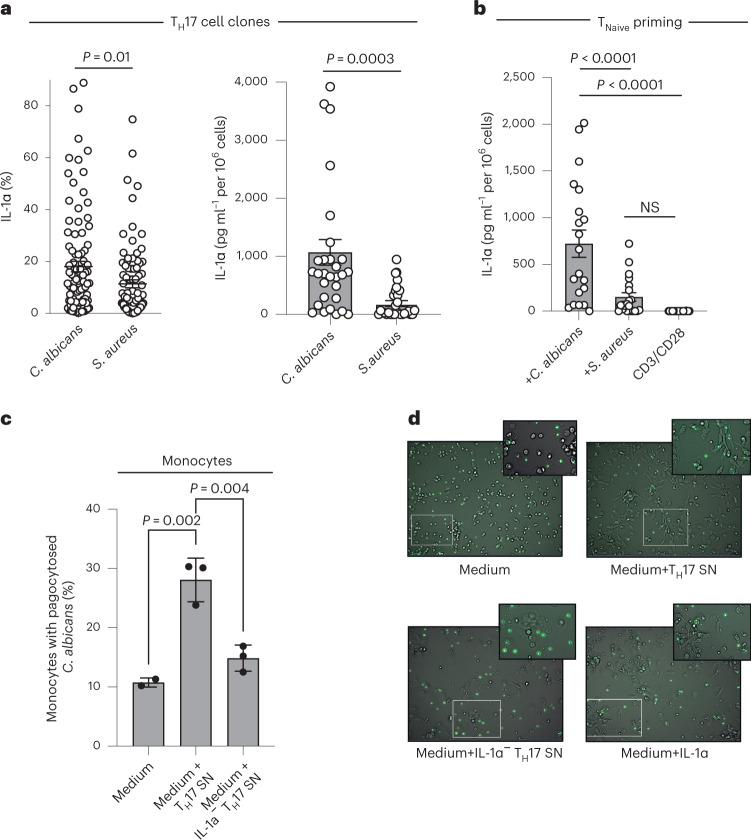
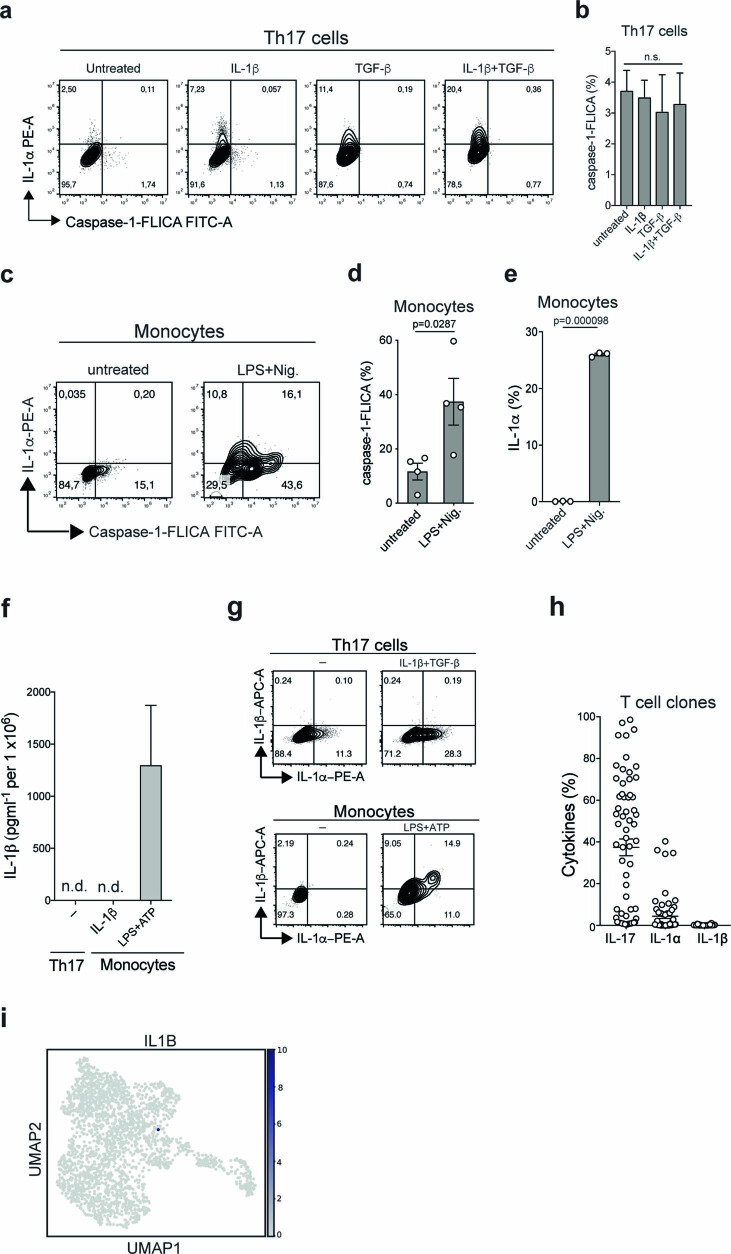
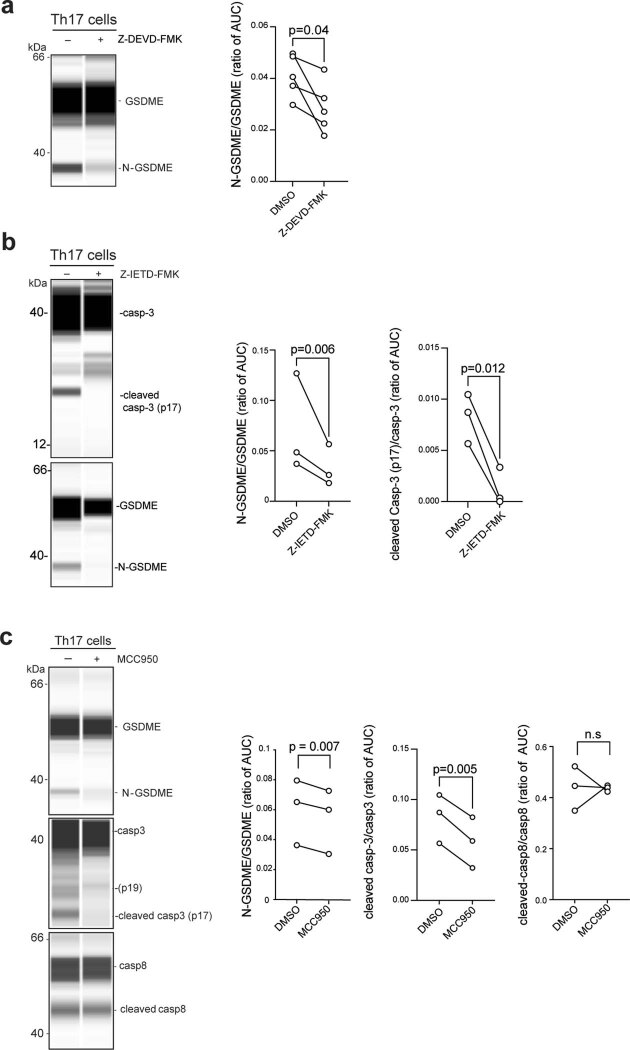
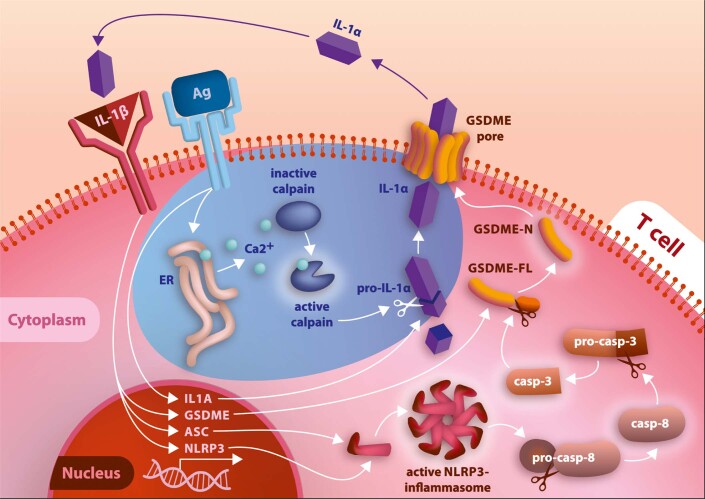
It has been shown that innate immune responses can adopt adaptive properties such as memory. Whether T cells utilize innate immune signaling pathways to diversify their repertoire of effector functions is unknown. Gasdermin E (GSDME) is a membrane pore-forming molecule that has been shown to execute pyroptotic cell death and thus to serve as a potential cancer checkpoint. In the present study, we show that human T cells express GSDME and, surprisingly, that this expression is associated with durable viability and repurposed for the release of the alarmin interleukin (IL)-1α. This property was restricted to a subset of human helper type 17 T cells with specificity for Candida albicans and regulated by a T cell-intrinsic NLRP3 inflammasome, and its engagement of a proteolytic cascade of successive caspase-8, caspase-3 and GSDME cleavage after T cell receptor stimulation and calcium-licensed calpain maturation of the pro-IL-1α form. Our results indicate that GSDME pore formation in T cells is a mechanism of unconventional cytokine release. This finding diversifies our understanding of the functional repertoire and mechanistic equipment of T cells and has implications for antifungal immunity.


Conflict of interest statement

A patent application has been filed by the authors. Otherwise, the authors declare no competing interests.

Figures

Fig. 1
Fig. 1. A distinct subset of human TH17 cells can express IL-1α.
a, ScRNA-seq and Leiden clustering of human TH17 cells after 5 d of stimulation with anti-CD3 and anti-CD28 monoclonal antibodies. b, IL1A expression in TH17 cells visualized in UMAP. c, Intracellular cytokine staining and flow cytometry of T cell clones generated from TH17 cells that were isolated ex vivo according to their differential expression of chemokine receptors. Left, representative flow cytometric analysis of one TH17 cell clone. Right, cumulative data from the blood of three healthy donors. d, DiVenn plot of DEGs obtained from IL1A+ versus IL1A human TH17 cells stimulated as described in a (shown as left green circle) and compared with IL1A+ versus IL1A human LPS-stimulated monocytes (GEO, accession no. GSE159113) (shown as right green circle). Upregulated genes (red circles) and downregulated genes (blue circles) are connected via a gray line to either green circle, indicating its dataset of origin. Gray lines connecting both green circles depict common DEGs between both datasets. Source data
Fig. 2
Fig. 2. IL-1α producing TH17 cells are proinflammatory.
a, Enrichment analysis using clusterprofiler with genes coexpressed with IL1A as determined in Extended Data Fig. 3a,b. The top 10 GO terms out of 150 significant GO terms are shown. b, Expression of pro- and anti-inflammatory gene sets obtained from public data in TH17 cells analyzed by scRNA-seq after grouping single cells into IL1A+ and IL1A TH17 cells and after Leiden clustering (Wilcoxon’s rank-sum test). c, Transcriptome analysis showing DEGs (red, upregulated; blue, downregulated; gray, nonsignificant genes) of pro- versus anti-inflammatory TH17 cells after 5 d of polyclonal stimulation in the presence or absence of IL-1β, respectively. d, GSEA of TH17 cells from c. The gene sets were established from a public dataset after transcriptomic comparison of IL-10 versus IL-10+ TH17 cell clones. N/S, not significant; NES, normalized enrichment score. e, Intracellular cytokine staining and flow cytometric analysis of TH17 cells stimulated for 5 d with anti-CD3 and anti-CD28 monoclonal antibodies. f, Overrepresentation of KEGG pathways within the DEGs from the transcriptomic comparison of pro- versus anti-inflammatory TH17 cells. g, Intracellular cytokine staining and flow cytometry (left, representative experiment; right, cumulative data) of T cells (from blood and synovial fluid (SF) of patients suffering from JIA and healthy control donors). IL-17A+ gated TH cells are shown (paired Student’s t-test; n = 5 independent patients and healthy donors). Source data
Fig. 3
Fig. 3. IL-1α production by T cells is restricted to the TH17 cell fate.
a, ELISA of cell culture supernatants of TH cell subsets after stimulation with anti-CD3 and anti-CD28 monoclonal antibodies for 5 d. Monocytes were stimulated with LPS for 24 h and nigericin for the last 30 min (one-way analysis of variance (ANOVA) with Dunnett’s multiple-comparison test). bf,h, Intracellular cytokine staining and flow cytometric analysis of cells stimulated as in a (one-way ANOVA with Dunnett’s multiple-comparison test (b, f and h), two-tailed paired Student’s t-test (e)). DMSO, Dimethysulfoxide; NS, not significant. g, ELISA of cell culture supernatants from cells stimulated as in f (one-way ANOVA with Dunnett’s multiple-comparison test). i, Intracellular cytokine staining and flow cytometry of memory TH cells sorted positively and negatively for specific chemokine receptors. The analysis was performed after 5 d of stimulation with anti-CD3 and anti-CD28 monoclonal antibodies (two-tailed, paired Student’s t-test). Data are presented as mean ± s.e.m. Each circle indicates an independent biological sample representing a blood donor. Source data
Fig. 4
Fig. 4. Calpain is a prerequisite for the release of cleaved IL-1α by human TH17 cells.
a, Immunoblot analysis of cell culture supernatants derived from TH17 cell clones that were restimulated with anti-CD3 and anti-CD28 monoclonal antibodies for 5 d. b, Fold-change in relative fluorescence units (r.f.u.) after 1 h of incubation of TH17 cells with the calpain substrate Ac-LLY-AFC. TH17 cells were stimulated for 3 d with anti-CD3 and anti-CD28 monoclonal antibodies. c,e,g,h, ELISA of cell culture supernatants after stimulation of TH17 cells (c and eg) with anti-CD3 and anti-CD28 monoclonal antibodies for 5 d and of monocytes (f) with LPS (24 h) and nigericin (30 min). Thapsigargin (g), 1 μM, was added on days 2 and 3 and EGTA (h) on day 0. d, Immunoblot analysis of human TH17 cell lysates. Human TH17 cells were stimulated with anti-CD3 and anti-CD28 monoclonal antibodies and IL-1β in the presence or absence of calpain inhibitor II (10 mM) and analyzed on day 5. The data represent two experiments with two donors. e, TH17 cells were stimulated with anti-CD3 and anti-CD28 monoclonal antibodies for 5 d after genetic depletion of CAPN1 or CAPN2 with CRISPR–Cas9 technology. Each circle indicates an independent blood donor. The data represent three independent experiments (b, c and eh). P values were calculated using one-way ANOVA with Dunnett’s multiple-comparison test (c) or Fisher’s least significance difference test (e) or two-tailed, paired Student’s t-test (b and fh). Source data
Fig. 5
Fig. 5. Unconventional NLRP3 inflammasome activation regulates IL-1α production by human TH17 cells.
a,b, Imaging flow cytometry with TH17 cells on day 5 after stimulation with plate-bound anti-CD3 and anti-CD28 monoclonal antibodies and macrophages after 24 h of stimulation with LPS and ATP for the last 30 min. a, Representative experiment. BF, bright-field. b, Cumulative data with n = 3 biological samples, presented as mean ± s.e.m. Left, P values calculated using one-way ANOVA with Tukey’s multiple-comparison test. Right, P values calculated using two-tailed, paired Student’s t-test. c, RT–qPCR analysis of TH17 cells stimulated as in a and restimulated with PMA and ionomycin for 3 h. Data represent three independent experiments with n = 9 biological replicates (two-tailed, paired Student’s t-test). d, ELISA of cell culture supernatants after stimulation of TH17 cells for 5 d with anti-CD3 and anti-CD28 monoclonal antibodies. Data represent three experiments with n = 7 biological replicates (two-tailed, paired Student’s t-test). e, Immunoblot analysis of cell lysates from TH17 cells after 5 d of stimulation with anti-CD3 and anti-CD28 monoclonal antibodies and of monocyte lysates after stimulation with LPS for 24 h and nigericin (Nig.) for the last 30 min. The conditions from the same blot after removal of irrelevant conditions or replicates are shown. f, ELISA of cell culture supernatants from anti-CD3- and anti-CD28-activated TH17 cells (5 d) and LPS (24 h)- and nigericin (30 min)-stimulated monocytes (n = 3 biological samples presented as mean ± s.e.m.; one-way ANOVA with Tukey’s multiple-comparison test). g, ELISA of cell culture supernatants from anti-CD3- and anti-CD28-activated TH17 cells after depletion of CASP1 by CRISPR–Cas9 gene editing. Data represent five independent experiments. P values were calculated using two-tailed, paired Student’s t-test. Each circle indicates an independent blood donor. Source data
Fig. 6
Fig. 6. The NLRP3–casp8/3 cleavage cascade leads to GSDME pores for IL-1α release.
a, Differential gene expression determined by transcriptome analysis of TH17 cells treated as in Fig. 2c (n = 3 individual healthy blood donors). b, RT–qPCR analysis of anti-CD3 and anti-CD28 monoclonal antibody-stimulated, naive T cells in polarizing cytokine conditions (n = 4, one-way ANOVA with Dunnett’s multiple-comparison test). c, Immunoblot analysis of cell lysates from TH17 cells stimulated with anti-CD3 and anti-CD28 monoclonal antibodies for different durations. The data represent three experiments. d, ELISA of cell culture supernatants from TH17 cells with and without deletion of GSDME (left) or GSDMD (right) by CRISPR–Cas9 technology. Individual experiments were normalized to the first time point of analysis on day 2 (n = 3 individual biological samples, two-way ANOVA with Bonferroni’s multiple-comparison test). e, Immunoblot analysis of cell lysates from TH17 cells stimulated with anti-CD3 and anti-CD28 monoclonal antibodies for the indicated time points and of CD14+ monocytes stimulated for 24 h with LPS and 30 min with nigericin. Casp, Caspase. f, Lane view of electropherograms obtained with a Jess Simple Western System for cell lysates of TH17 cells stimulated for 5 d as in e in the presence or absence of the indicated inhibitors. It is a representative experiment. g, Cumulative data of f (one-sample Student’s t-test). AUC, area under the curve. h, Luminex assay of the supernatants of TH17 cells stimulated with plate-bound anti-CD3 (1 μg ml−1, TR66) and phorbol-12,13-dibutyrate for 8 h on day 4 of culture (n = 3 individual biological samples, two-tailed, paired Student’s t-test). i, ELISA of supernatants of TH17 cells stimulated as in f. Each circle indicates an independent blood donor in h and i (n = 4 individual biological samples; two-tailed, paired Student’s t-test). Source data
Fig. 7
Fig. 7. TH17 cells are resilient to pyroptosis despite GSDME plasma membrane pores.
a, Representative electropherogram obtained with a Jess Simple Western System after normalization to total protein. TH17 cells were stimulated with anti-CD3 and anti-CD28 monoclonal antibodies for 48 h and then transfected with RNPs containing an NTC or crGSDME (KO). The TH17 cells were then expanded for another 7 d. The data represent three experiments. b, Heatmap with gene sets constructed based on the fold-changes of the genes (see Supplementary Fig. 10). All annotation terms significant in at least three gene sets (FDR ≤ 5%) are shown. The observed −log10(FDR) values were capped at 10 for ease of visualization. In addition, all cell death-associated annotation terms are shown. c, Gene set expression comparison using a GO term in TH17 cells analyzed by scRNA-seq after grouping into GSDME+ and GSDME TH17 cells (Wilcoxon’s rank-sum test). d, CytoTox 96 Non-Radioactive Cytotoxicity Assay from TH17 cells with and without CRISPR–Cas9 gene editing for GSDME stimulated with anti-CD3 and anti-CD28 monoclonal antibodies or from monocytes stimulated with or without LPS and nigericin (24 h). Supernatants from washed TH17 cell cultures were collected between days 4 and 5 of stimulation or from monocytes 24 h after stimulation (paired Student’s t-test). e, Cloning efficiency of TH17 cell clones with varying degrees of IL-1α expression (top) and of control TH cell clones with varying degrees of IFN-γ expression, but lacking IL-1α coexpression (bottom) as assessed by intracellular cytokine staining. f, Intracellular staining and flow cytometric analysis of TH17 cell clones after repetitive restimulation with anti-CD3 and anti-CD28 monoclonal antibodies (n = 5 individual TH17 cell clones). g, GSEA of IL-1α+ compared with IL-1α TH17 cell clones. h, Gene set expression comparison after scRNA-seq as in c. i, Flow cytometric analysis of TH17 cells stimulated for 5 d with anti-CD3 and anti-CD28 monoclonal antibodies. Left, representative experiment. Right, cumulative data (n = 3, two-tailed, paired Student’s t-test). Each circle indicates an independent blood donor. Source data
Fig. 8
Fig. 8. TCR specificity controls IL-1α production contributing to C. albicans clearance.
a, Intracellular cytokine staining and flow cytometry (left) and ELISA (right) of C. albicans- versus S. aureus-specific TH17 cell clones from three individual blood donors 14 d after single-cell TH17 cell cloning with irradiated feeder cells and restimulation for 5 d with anti-CD3 and anti-CD28 monoclonal antibodies. The microbial antigen-specific TH17 cells were isolated for subsequent cloning as a carboxyfluorescein succinimidyl ester (CFSE)-negative population after their restimulation with microbe-pulsed autologous monocytes. Each circle indicates an individual T cell clone (n = 30 TH cell clones, 10 clones per healthy blood donor). Data are presented as mean ± s.e.m. (two-tailed, unpaired Student’s t-test). b, Naive TH cells were primed by either C. albicans- or S. aureus-pulsed monocytes. Each circle indicates an individual T cell clone. The ELISA analysis of supernatants after restimulation of each clone with anti-CD3 and anti-CD28 monoclonal antibodies for 5 d is shown (n = 19, 4–5 clones per healthy blood donor; one-way ANOVA with Tukey’s multiple-comparison test). c, Flow cytometric analysis of phagocytosis of FITC-labeled, heat-inactivated C. albicans yeast by monocytes preincubated for 18 h with IL-1α replete or depleted (immunoabsorption or CRISPR–Cas9 KO) TH17 cell supernatants (n = 3 independent biological samples; one-way ANOVA with Tukey’s multiple-comparison test). Each circle indicates an independent blood donor. d, Real-time live cell in vitro imaging (videos in Supplementary Video 1, time points) of monocytes in coculture with FITC-labeled C. albicans as in c. Representative snap shots with magnifications of the videos are shown at a time point 2 h after addition of C. albicans. Source data
Extended Data Fig. 1
Extended Data Fig. 1. Autocrine IL-1α production by Th17 cells enforces a pathogenic Th17 cell identity.
a, Th17 cells were stimulated with anti-CD3 and anti-CD28 mAbs for 5 days before intracellular cytokine staining and flow cytometry following PMA and ionomycin restimulation. Representative experiment. b, Cumulative data for (a). Two-sided paired t-test. c, ELISA of supernatants from Th17 cells stimulated for 5 days with anti-CD3 and anti-CD28 mAbs. Two-sided paired t-test.
Extended Data Fig. 2
Extended Data Fig. 2. Differential gene expression between pro- and anti-inflammatory human Th17 cells.
Shown is a heatmap displaying the top 20 up- and downregulated genes (by order of significance) of the transcriptome following stimulation of human Th17 cells with anti-CD3 and anti-CD28mAbs for 5 days in the presence (proinflammatory) or absence (anti-inflammatory) of exogenous IL-1β. The samples and genes were clustered according to the pattern of expression using k-means clustering.
Extended Data Fig. 3
Extended Data Fig. 3. Gating strategy for the isolation of Th cell subsets from the blood.
Fresh PBMCs from healthy donors were enriched for CD4 expression by MACS before FACS for CD45RA Th cell subsets according to their differential expression of the chemokine receptor markers CCR6, CCR4 and CXCR3. A representative gating strategy and the percentage of Th-cell subsets in the respective gates for 33 healthy donors are shown (mean ± SEM).
Extended Data Fig. 4
Extended Data Fig. 4. Consensus binding sites for the Th17 master transcription factors ROR-γt and RORα in the IL1A intronic enhancer region.
a, Locations of RORα and ROR-γt consensus binding sites in the regulatory region of IL1A. Binding sites were predicted using the JASPAR2022 database (Castro-Mondragon JA et al., Nucleic Acids Res 2022) and annotated with the UCSC genome browser (assembly hg38) (Kent WJ et al., Genome Res 2002). The quality cutoff was set at 400 (this score indicates a p value of p = 1*10- (score/100)). ENCODE tracks for histone marks were used to indicate the bona fide IL1A regulatory region (chr2:112,781,072-112,786,251) (Rosenbloom KR et al., Nucleic Acids Res 2013). b, Alignment of the RORα and RORγt consensus binding motif with the predicted binding sites in the IL1A enhancer RORα-IL1A.1 (chr2:112784300-112784309), RORα-IL1A.2 (chr2:112782834-112782843); RORγt-IL1A.1 (chr2:112,782,077-112,782,088); RORγt-IL1A.2 (chr2:112,784,298-112,784,309) and established binding sites in the IL17A enhancer RORα-IL17A.1 (chr6:52181117-52181130), RORα-IL17A.2 (chr6:52180979-52180992) and RORγt-IL17A.1 (chr6:52181118-52181129) (Wang X et al., Immunity. 2012). Scores for individual sites are indicated.
Extended Data Fig. 5
Extended Data Fig. 5. IL-1α is secreted by an unconventional pathway in human Th17 cells and is not expressed on the cell surface.
a, Th17 cells were stimulated for 5 days with anti-CD3 and anti-CD28 mAbs (48 h plate-bound) before intracellular cytokine staining and flow cytometric analysis on day 5 following PMA and ionomycin restimulation. Representative experiment. b, Cumulative data, Two-sided paired t-test. Each circle indicates an individual healthy blood donor (n = 3 examined over 2 independent experiments). Data are presented as mean ± SEM. c, ELISA of 24 h cumulative supernatants from day 4 to day 5 in the presence or absence of BFA. n.s., not significant. Two-sided paired t-test. Each circle indicates an individual healthy blood donor (n = 4 biologically independent samples examined over 2 independent experiments). Data are presented as mean ± SEM. d, Th17 cells were stimulated and analyzed as in (a). Monocytes were stimulated in the presence and absence of LPS (24 h) and nigericin (last 30 min) and analyzed by intracellular and surface staining and flow cytometry. Representative experiment (n = 3 biologically independent samples).
Extended Data Fig. 6
Extended Data Fig. 6. Human Th17 cells express the inflammasome components ASC and NLRP3.
a, Lane views of electropherograms obtained with the Jess Simple Western System (ProteinSimple). Monocytes were MACS-isolated with CD14 beads and stimulated in the presence or absence of LPS (24 h) and nigericin (Nig.) for 30 min before cell lysis. Th17 cells were FACS-sorted ex vivo from the blood of healthy donors, stimulated for 48 h and transfected with RNP containing nontargeted control (NTC) or crASC. Cell lysates were collected after 7 days. The experiment was repeated independently 3 times with similar results. b, Western blot analysis. Cell culture lysates derived from Th17 cells and monocytes. Th17 cells were sorted as in (a) and stimulated with anti-CD3 and anti-CD28 mAbs (48 h plate-bound) for 5 days. Monocytes were isolated and stimulated as in (a). The experiment was repeated independently 2 times with similar results. c, NLRP3-speck formation assessed by ImageStream in Th17 cells stimulated for 5 days with anti-CD3 and anti-CD28 mAbs. Each circle indicates an individual healthy blood donor and experiment. Two-sided paired t-test. Data are presented as mean ± SEM. n = 4 biologically independent samples examined over 2 independent experiments. Source data
Extended Data Fig. 7
Extended Data Fig. 7. IL-1α expression is neither regulated by active caspase-1 in human Th17 cells nor coregulated with IL-1β, in contrast to the situation in monocytes.
a, Th17 cells were isolated ex vivo by FACS-sorting and stimulated for 5 days with anti-CD3 and anti-CD28 mAbs (48 h plate-bound) in the presence or absence of the indicated cytokines before flow cytometric analysis of intracellular IL-1α and active caspase-1 after PMA and ionomycin restimulation. The results of one representative experiment are shown. b, Cumulative data for active caspase-1 as shown in (a). One-way ANOVA. n = 3 biologically independent samples examined over 3 independent experiments. Data are presented as mean ± SEM. c, Intracellular staining and flow cytometry of monocytes following 24 h stimulation with LPS and 30 min with nigericin (Nig.). The results shown are from one representative experiment. d, e, cumulative data of (d), Two-sided paired t-test. Each circle indicates an individual healthy blood donor (n = 3-4 biologically independent samples examined over 3 independent experiment). Data are presented as mean ± SEM. f, ELISA of Th17 cells, which were stimulated as in (a) and of monocytes were stimulated with LPS (24 h) and ATP (30 min). n = 3 biologically independent samples examined over 2 independent experiments. Data are presented as mean ± SEM. g, Flow cytometric analysis of cells as in (g).h, Intracellular cytokine staining and flow cytometric analysis of T-cell clones generated from the Th17-cell subset. Each circle indicates an individual T cell clone (n = 64). Data are presented as mean ± SEM. i, scRNA-seq and UMAP showing IL-1β expression in human Th17 cells stimulated for 5 days with anti-CD3 and anti-CD28 mAbs. Source data
Extended Data Fig. 8
Extended Data Fig. 8. The GSDME promoter and intronic enhancer region display consensus binding sites for TCR-induced transcription factors as well as for Th17 master regulators.
a, Locations of consensus binding sites of TCR-induced (NFATC-family, NF-κB-family, AP1-family and BATF) and TGFβ-induced (SMAD 2,3,4) transcription factors as well as the Th17 transcription factors RORα and BATF in the regulatory region of GSDME (chr7:24,754,387-24,758,496). The regulatory region and the consensus binding sites were defined and annotated as in Extended Data Fig.6. b, The consensus binding motives were aligned with predicted binding sites in the GSDME promotor/enhancer region. The binding sites with the highest score for each family are indicated. NFATC3-GSDME.1 (chr7:24756897-24756905), RELA-GSDME.1 (chr7:24757878-24757887), FOS::JUN (chr7:24755766-24755775), BATF-GSDME.1 (chr7:24755766-24755776), SMAD4 (chr7:24754928-24754935), RORα (chr7:24758120-24758133).
Extended Data Fig. 9
Extended Data Fig. 9. Pharmacological inhibition shows that GSDME pore formation is regulated by each component of the NLRP3 inflammasome – casp8 – casp3 cleavage cascade.
The lane view of electropherograms obtained with the Jess Simple Western System (ProteinSimple) is shown. Th17 cells were sorted according to the differential expression of chemokine receptors and stimulated for 5 days with anti-CD3 and anti-CD28 mAbs (48 h plate-bound) in the presence or absence of specific inhibitors for caspase-3 (a), caspase-8 (b) or the NLRP3 inflammasome (c). The inhibitors were added on day 3 of the 5-day culture period. The AUC was calculated with the Jess software Compass for SW as the ratio of the cleaved versus noncleaved inhibitor target proteins after normalization to total protein. Two-sided paired t-tests.
Extended Data Fig. 10
Extended Data Fig. 10. Mechanism of IL-1α production by human Th17 cells: Graphical summary.
The graphic was created with a commercial license from Adobe.

References

    1. Ivanov II, et al. The orphan nuclear receptor RORgammat directs the differentiation program of proinflammatory IL-17+ T helper cells. Cell. 2006;126:1121–1133. - PubMed
    1. Zwicky P, Unger S, Becher B. Targeting interleukin-17 in chronic inflammatory disease: a clinical perspective. J. Exp. Med. 2020;217:e20191123. - PMC - PubMed
    1. Stockinger B, Omenetti S. The dichotomous nature of T helper 17 cells. Nat. Rev. Immunol. 2017;17:535–544. - PubMed
    1. Zielinski CE, et al. Pathogen-induced human TH17 cells produce IFN-gamma or IL-10 and are regulated by IL-1beta. Nature. 2012;484:514–518. - PubMed
    1. Ghoreschi K, et al. Generation of pathogenic TH17 cells in the absence of TGF-beta signalling. Nature. 2010;467:967–971. - PMC - PubMed

Publication types