. 2023 May;19(5):575-584.
doi: 10.1038/s41589-022-01219-9. Epub 2023 Jan 5.

Structure, sequon recognition and mechanism of tryptophan C-mannosyltransferase

Affiliations

Structure, sequon recognition and mechanism of tryptophan C-mannosyltransferase

Joël S Bloch et al. Nat Chem Biol. 2023 May.

Abstract

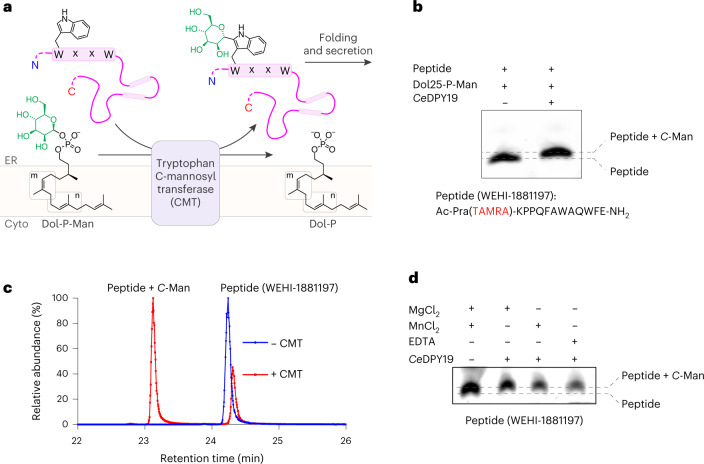
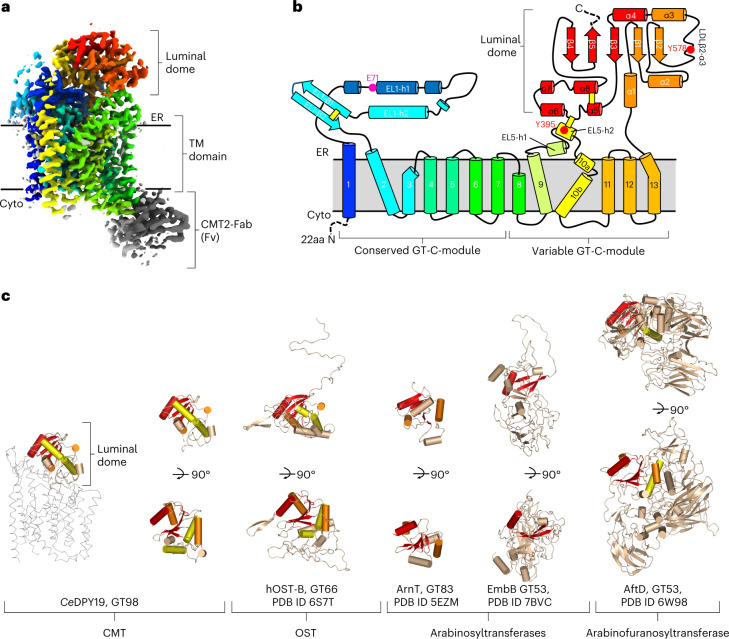
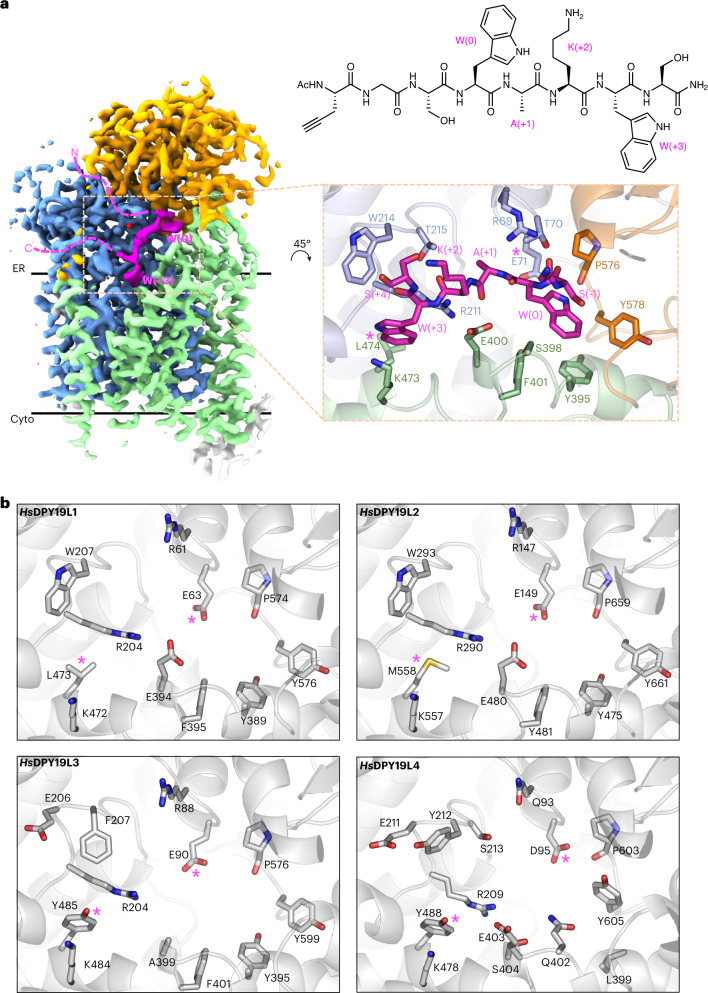
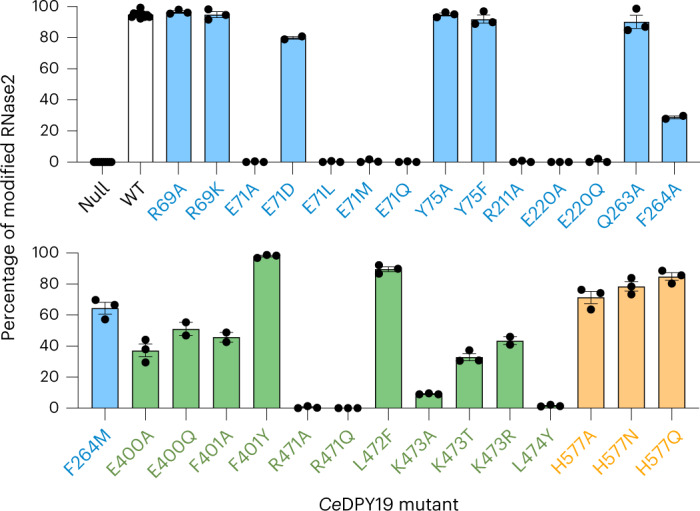
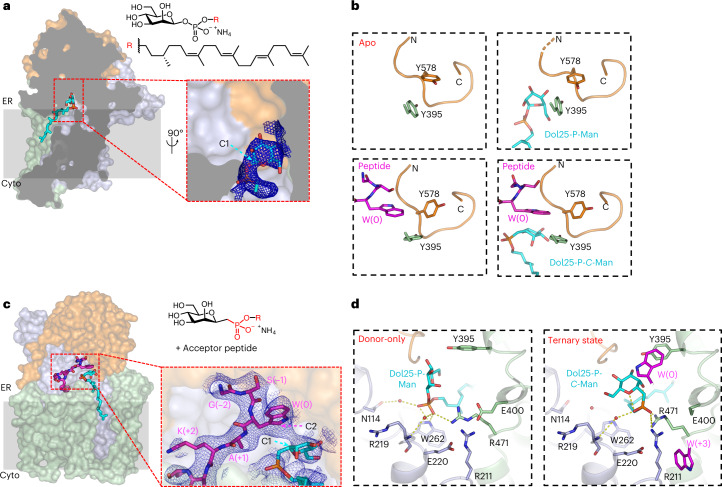
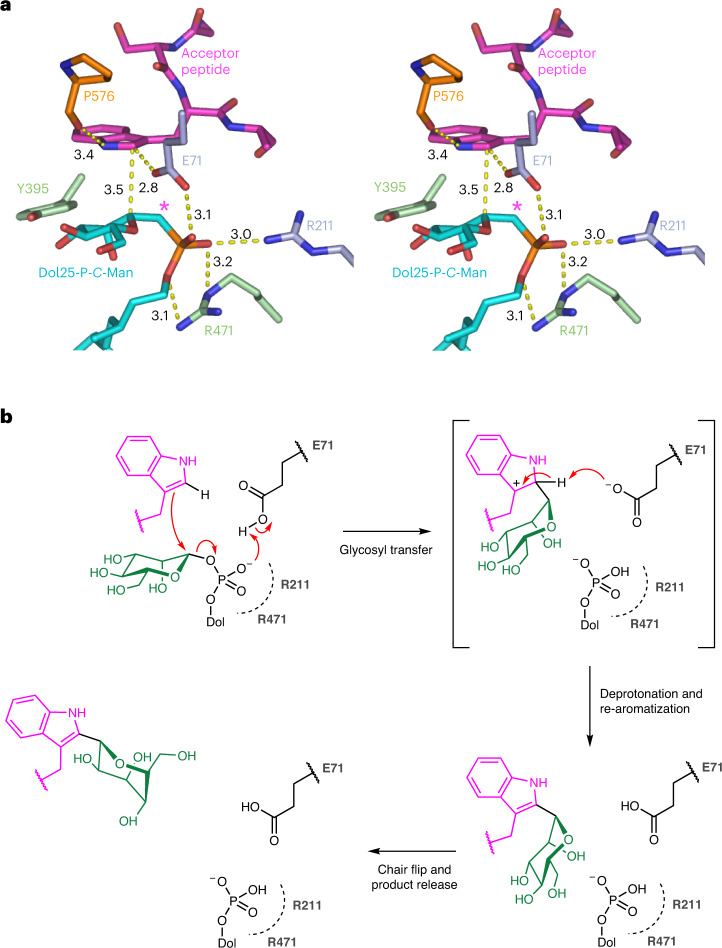
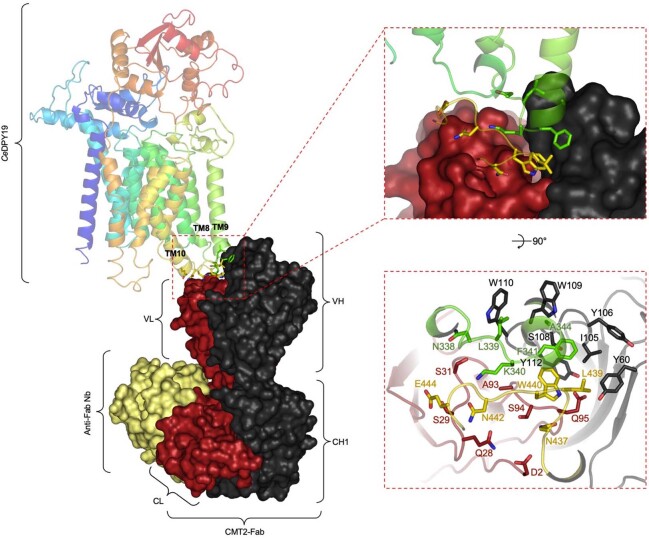
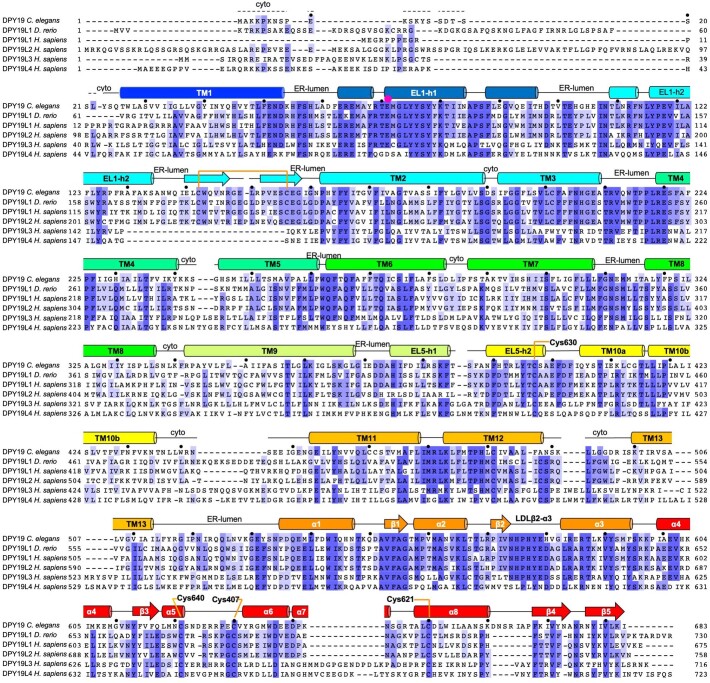
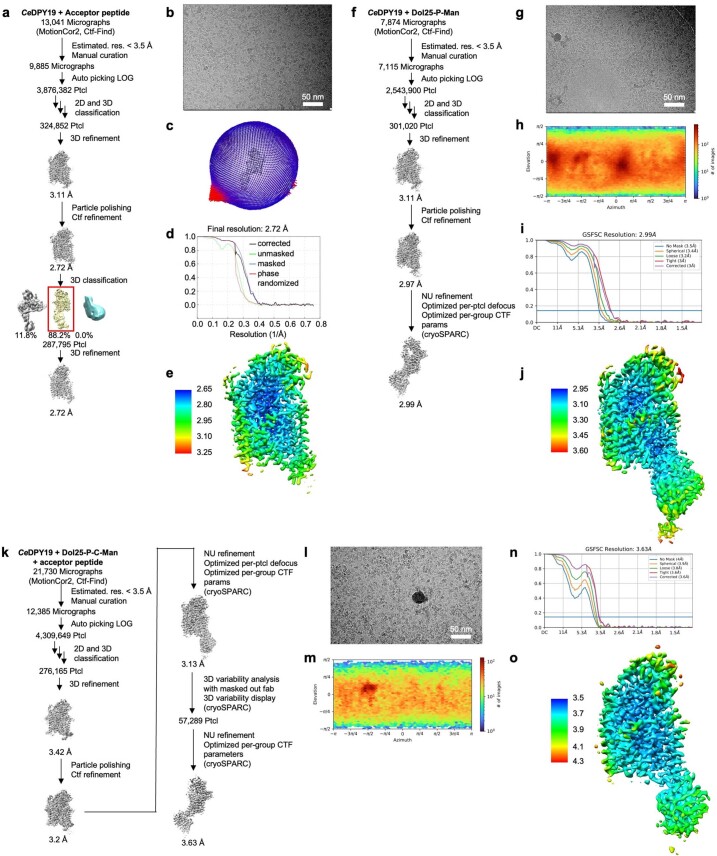
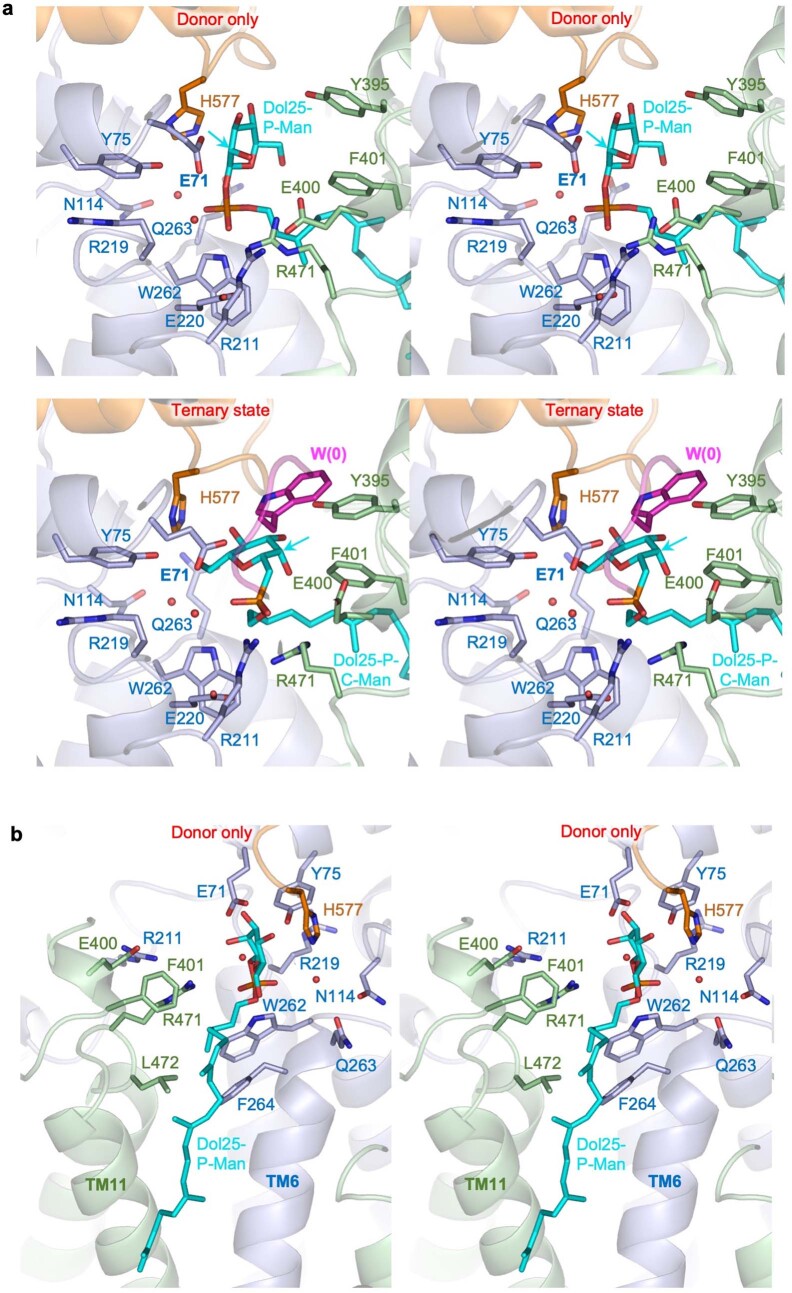
C-linked glycosylation is essential for the trafficking, folding and function of secretory and transmembrane proteins involved in cellular communication processes. The tryptophan C-mannosyltransferase (CMT) enzymes that install the modification attach a mannose to the first tryptophan of WxxW/C sequons in nascent polypeptide chains by an unknown mechanism. Here, we report cryogenic-electron microscopy structures of Caenorhabditis elegans CMT in four key states: apo, acceptor peptide-bound, donor-substrate analog-bound and as a trapped ternary complex with both peptide and a donor-substrate mimic bound. The structures indicate how the C-mannosylation sequon is recognized by this CMT and its paralogs, and how sequon binding triggers conformational activation of the donor substrate: a process relevant to all glycosyltransferase C superfamily enzymes. Our structural data further indicate that the CMTs adopt an unprecedented electrophilic aromatic substitution mechanism to enable the C-glycosylation of proteins. These results afford opportunities for understanding human disease and therapeutic targeting of specific CMT paralogs.


Conflict of interest statement

The authors declare no competing interests.

Figures

Fig. 1
Fig. 1. CMT activity is not divalent metal ion dependent.
a, Schematic of CMT-mediated tryptophan C-mannosylation of secretory and transmembrane proteins in the endoplasmic reticulum (ER). Nascent polypeptide chains (pink line) containing the WxxW/C sequon (pink boxes) are mannosylated by CMT using Dol-P-Man (mannosyl group depicted in green) as donor substrate, thereby forming the depicted C-glycosidic bond. Glycopeptides are subsequently folded and secreted via the Golgi apparatus. b, In vitro C-mannosylation reaction using purified CMT CeDPY19. Tricine–SDS–PAGE was used to separate fluorescently labeled acceptor peptide upon mannosylation or unmodified, n = 1 independent replicates. c, LC–MS analysis of in vitro C-mannosylation reaction, demonstrating the attachment of a single hexose to the fluorescently labeled acceptor peptide, n = 1 independent replicates. d, Tricine–SDS–PAGE analysis of in vitro C-mannosylation reaction in presence of the divalent metal ions MnCl2 and MgCl2 as well as in the absence of divalent metal ions and with CeDPY19 preincubated with the metal ion chelator EDTA, demonstrating that CMT activity is unaffected by the absence of divalent metal ions, n = 1 independent replicates. Source data
Fig. 2
Fig. 2. Structure and topology of CeDPY19 and evolutionary conservation of the GT-C ‘luminal domain’ fold.
a, Cryo-EM map of substrate-free CeDPY19 in rainbow coloring (blue at N terminus, red at C terminus). The Fv portion of the Fab fragment used for cryo-EM studies is colored gray. ER, endoplasmic reticulum. b, Schematic representation of CeDPY19 topology, with transmembrane (TM) helices and external loops (EL) numbered and colored as in a. A pink sphere indicates the proposed catalytic residue Glu71. Red spheres indicate Tyr395 and Tyr578 that are part of the ‘peptide sensor’ in the active site. Yellow bars indicate disulfide bonds. Regions that were disordered in the structures are indicated with dashed lines. c, Structures of the luminal dome of representative GT-C members are aligned to the luminal dome of CeDPY19. The structurally conserved core is highlighted in red, orange and yellow with descending structural conservation.
Fig. 3
Fig. 3. Structural basis of acceptor sequon recognition in unfolded proteins.
a, Cryo-EM map of peptide-bound CeDPY19 at 2.7 Å resolution. The conserved and variable GT-C modules are colored blue and green, the luminal dome in orange, CMT2-Fab in gray and the bound acceptor peptide in magenta. The locations of the acceptor sequon residues W(0) and W(+3) are labeled and dashed lines illustrate the trajectories of the unfolded N and C terminus of the peptide. The chemical structure of the peptide used for the structure determination of peptide-bound CeDPY19 is shown on the right. The inset shows the binding pocket of the acceptor peptide, with residues in contact with bound substrate shown as sticks and labeled. The locations of the presumed catalytic base Glu71 and the sequon specificity dictating residue Leu474 are indicated by pink asterisks. b, Predicted acceptor peptide recognition sites of human CMT-paralog AlphaFold models HsDPY19L1, HsDPY19L2, HsDPY19L3 and HsDPY19L4 are shown oriented in the same orientation as in a (inset), colored white and with the equivalent residues of Glu71 and Leu474 indicated by pink asterisks.
Fig. 4
Fig. 4. Key residues in CMT-catalyzed tryptophan mannosylation.
Normalized occupancy of the sole tryptophan C-mannosylation site in human RNase2 when coexpressed with wild type (WT) or mutant CeDPY19 in P. pastoris, as determined by LC–MS analysis. Note that P. pastoris does not possess any native CMT activity. Normalization is based on the relative abundance of glycosylated and nonglycosylated peptides, as determined by LC–MS with parallel reaction monitoring analyses. Data are presented as mean values ±s.e.m. for n = 3 independent replicates. Bars are colored according to the location of the mutation in CeDPY19: blue for residues in the conserved GT-C module, green for residues in the variable GT-C module and orange for residues in the luminal dome. Source data
Fig. 5
Fig. 5. A trapped ternary complex explains donor-substrate recruitment and activation.
a, Surface representation of Dol25-P-Man-bound CeDPY19 structure colored as in Fig. 3a, with Dol25-P-Man (chemical structure on the right, top) in stick representation (cyan). The front of CeDPY19 was clipped for clarity. The inset shows the phosphate and mannose moieties of Dol25-P-Man, and the blue mesh depicts the EM density map. The anomeric C1 of the mannose moiety is indicated by an arrow. b, Backbone structure of loop LDLβ2-α3 (His575-Arg584, colored orange) in the four CeDPY19 structures. Bound substrates are shown in sticks and labeled. Residue Tyr395 likely acting as a peptide sensor is shown in sticks and labeled. c, Surface representation of the ternary complex structure containing the phosphonate analog Dol25-P-C-Man (chemical structure on the right, top) and acceptor peptide, both shown as sticks. The inset shows bound ligands, with the EM density map shown as a blue mesh. d, Reorientation of the donor substrate in response to peptide binding to the enzyme. Left shows the Dol25-P-Man-bound CeDPY19 structure. Right shows the ternary complex structure. Red spheres indicate ordered water molecules. Selected side chains, as well as the substrates, are shown as sticks. Bound ligands are shown as sticks and labeled. Dashed yellow lines indicate distances from 2.5 to 3.8 Å.
Fig. 6
Fig. 6. Catalytic mechanism.
a, Stereo view of CeDPY19 ternary complex, with bound peptide colored magenta, bound Dol25-P-C-Man colored in cyan and key residues shown as sticks and labeled. An asterisk depicts the carbon atom of the phosphonate analog Dol25-P-C-Man. Dashed yellow lines indicate distances between key atoms in Å. b, Schematic of the proposed catalytic mechanism for CMT. See text for explanation.
Extended Data Fig. 1
Extended Data Fig. 1. Functional characterization of CeDPY19.
a, Tricine-SDS-PAGE analysis of in vitro activity of purified, detergent reconstituted CeDPY19 for mannosylation of peptides with different sequences, n = 1 independent replicates. b, LC-MS analysis of in vitro activity of purified, detergent reconstituted CeDPY19 for mannosylation of the peptide WEHI-188197, with Dol25-P-Glc as donor instead of Dol25-P-Man, in presence of CMT2–Fab, and for the peptide WEHI‐1886494, n = 1 independent replicates. Source data
Extended Data Fig. 2
Extended Data Fig. 2. Purification, Fab generation, and structure determination of substrate-free CeDPY19–CMT2-Fab–anti-Fab Nb complex.
a, Preparative SEC of purified, detergent reconstituted CeDPY19. b, Preparative SEC of purified, detergent reconstituted CeDPY19 in complex with CMT2-Fab and anti-Fab nanobody (left) and SDS-PAGE analysis of peak fractions (right). c, SEC-TM analysis of purified, detergent reconstituted CeDPY19. A Tm of 35.82 °C was calculated. d, Analytical SEC of purified, detergent reconstituted CeDPY19 pre-incubated for 10 min at either 4 °C or at 36 °C in the presence or absence of CMT2-Fab. e, Overview of the EM data processing and structure determination pipeline using RELION 3.1. f, Representative cryo-EM micrograph. g, Spatial distribution of particles in the final iteration of 3D refinement. h, Refined, and B-factor sharpened EM map, colored by local resolution estimation as calculated in RELION 3.1. i, Resolution estimation of final map via Fourier shell correlation, as calculated in RELION 3.1. Source data
Extended Data Fig. 3
Extended Data Fig. 3. Molecular interactions at the interface of CeDPY19 and CMT2-Fab.
The cryo-EM structure of apo-CeDPY19 in complex with CMT2-Fab and anti-Fab Nb is depicted. CeDPY19 is shown in ribbon representation with rainbow coloring, starting in blue at the N-terminus and transitioning to red at the C-terminus. CMT2-Fab is shown in surface representation in black (heavy chain) and red (light chain). The anti-Fab Nb is shown in yellow. The upper insets show a zoomed view of the Fab binding interface with selected residues shown in stick representation.
Extended Data Fig. 4
Extended Data Fig. 4. Sequence alignment of CMT homologs and paralogs.
Alignment of amino acid sequences of CMT homologs C. elegans DPY19, zebrafish DPY19L1, and the human CMT paralogs HsDPY19L1–4, generated with Clustal Omega (Uniprot identifiers: P34413, Q6DRN1, Q2PZI1, Q6NUT2, Q6ZPD9, and Q7Z388). Secondary structure elements of CeDPY19 are depicted and labeled above the sequence. The dashed lines indicate regions that are disordered in the CeDPY19 structures. Cytosolic regions are labeled ‘cyto’ and ER-luminal regions are labeled ‘ER-lumen’. A pink dot indicates the presumed catalytic base Glu71. Black dots indicate every tenth amino acid in the sequence of CeDPY19.
Extended Data Fig. 5
Extended Data Fig. 5. Cryo-EM structure determination of acceptor peptide-bound, donor substrate-bound, and ternary complex of CeDPY19.
a-e, structure determination of acceptor peptide-bound CeDPY19–CMT2-Fab–anti-Fab Nb complex. a, Overview of the EM data processing and structure determination pipeline using RELION 3.1 and, if indicated, cryoSPARC v3.2. b, Representative cryo-EM micrograph. c, Spatial distribution of particles in the final iteration of 3D refinement. d, Resolution estimation of final map via Fourier shell correlation, as calculated in cryoSPARC v3.2. e, Resolution estimation of final map via Fourier shell correlation, as calculated in RELION 3.1. f-j, structure determination of Dol25-P-Man-bound CeDPY19–CMT2-Fab–anti-Fab Nb complex. f, Overview of the EM data processing and structure determination pipeline using RELION 3.1. g, Representative cryo-EM micrograph. h, Spatial distribution of particles in the final iteration of 3D refinement. i, Resolution estimation of final map via Fourier shell correlation, as calculated in RELION 3.1. j, Refined, and B-factor sharpened EM map, colored by local resolution estimation as calculated in RELION 3.1. k-o, Structure determination of acceptor peptide and Dol25-P-C-Man bound CeDPY19–CMT2-Fab–anti-Fab Nb complex. k, Overview of the EM data processing and structure determination pipeline using RELION 3.1 and if indicated cryoSPARC v3.2. l, Representative cryo-EM micrograph. m, Spatial distribution of particles in the final iteration of 3D refinement. n, Resolution estimation of final map via Fourier shell correlation, as calculated in cryoSPARC v3.2. o, Resolution estimation of final map via Fourier shell correlation, as calculated in RELION 3.1. Source data
Extended Data Fig. 6
Extended Data Fig. 6. Donor substrate recruitment by CMT CeDPY19.
CeDPY19 and its substrates are colored as in Fig. 5 and depicted in wall-eyed stereo representation. CeDPY19 is shown in ribbon representation. The substrates and selected close residues are shown in stick representation. Arrows depict the C2 carbon of the mannose moiety. a, Mannose recognition in the structures of Dol25-P-Man-bound CeDPY19 (top) and Dol25-P-C-Man- plus acceptor peptide-bound CeDPY19 (bottom). b, Dolichyl recognition in the structure of Dol25-P-Man-bound CeDPY19.

References

    1. Schjoldager KT, Narimatsu Y, Joshi HJ, Clausen H. Global view of human protein glycosylation pathways and functions. Nat. Rev. Mol. Cell Bio. 2020;21:729–749. doi: 10.1038/s41580-020-00294-x. - DOI - PubMed
    1. Hofsteenge J, et al. New type of linkage between a carbohydrate and a protein: C-glycosylation of a specific tryptophan residue in human RNase Us. Biochemistry. 1994;33:13524–13530. doi: 10.1021/bi00250a003. - DOI - PubMed
    1. Julenius K. NetCGlyc 1.0: prediction of mammalian C-mannosylation sites. Glycobiology. 2007;17:868–876. doi: 10.1093/glycob/cwm050. - DOI - PubMed
    1. Shcherbakova, A. et al. C-mannosylation supports folding and enhances stability of thrombospondin repeats. eLife10.7554/eLife.52978 (2019). - PMC - PubMed
    1. Shcherbakova A, Tiemann B, Buettner FF, Bakker H. Distinct C-mannosylation of netrin receptor thrombospondin type 1 repeats by mammalian DPY19L1 and DPY19L3. Proc. Natl Acad. Sci. USA. 2017;114:2574–2579. doi: 10.1073/pnas.1613165114. - DOI - PMC - PubMed

Publication types