. 2023 Jan;25(1):92-107.
doi: 10.1038/s41556-022-01039-y. Epub 2023 Jan 5.

OASL phase condensation induces amyloid-like fibrillation of RIPK3 to promote virus-induced necroptosis

Affiliations

OASL phase condensation induces amyloid-like fibrillation of RIPK3 to promote virus-induced necroptosis

Shin-Ae Lee et al. Nat Cell Biol. 2023 Jan.

Abstract

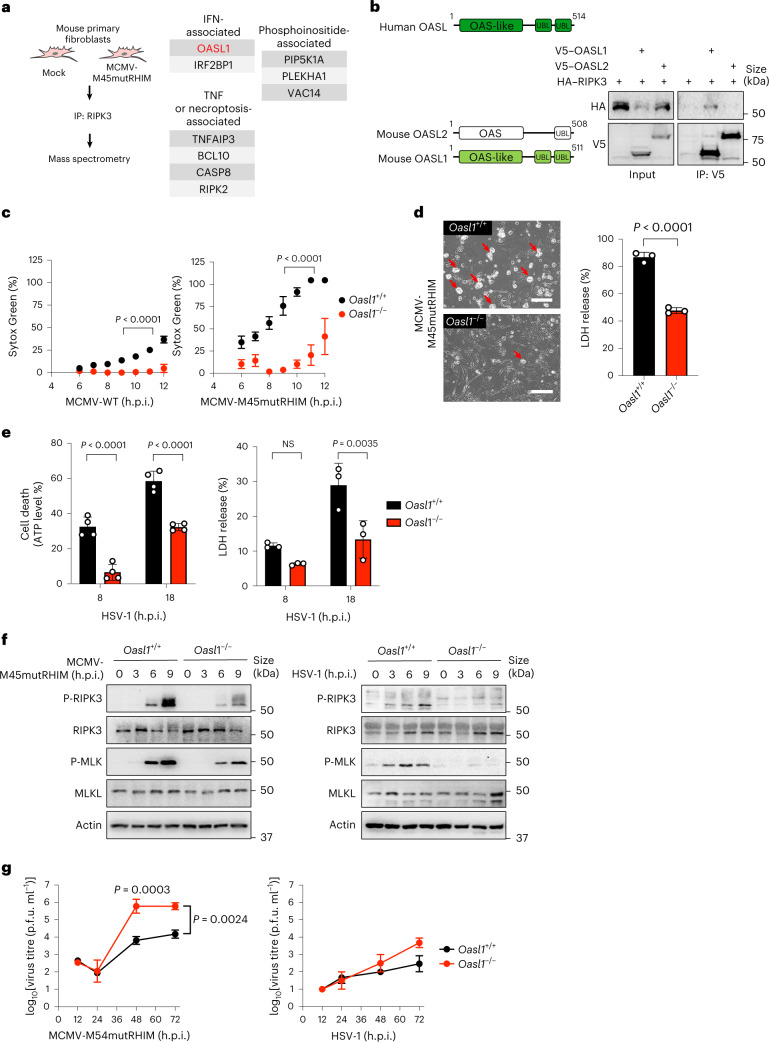
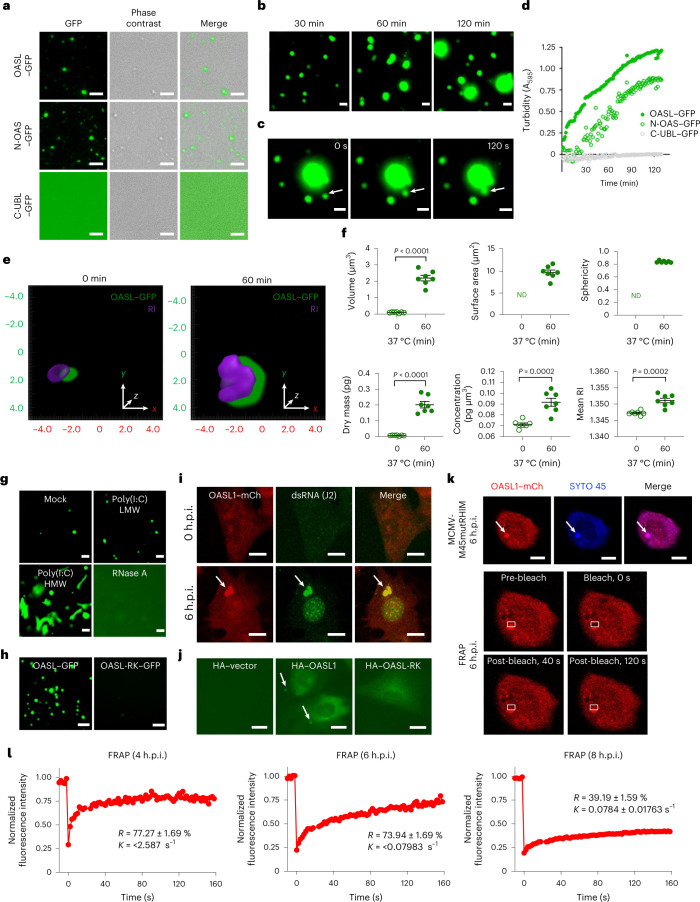
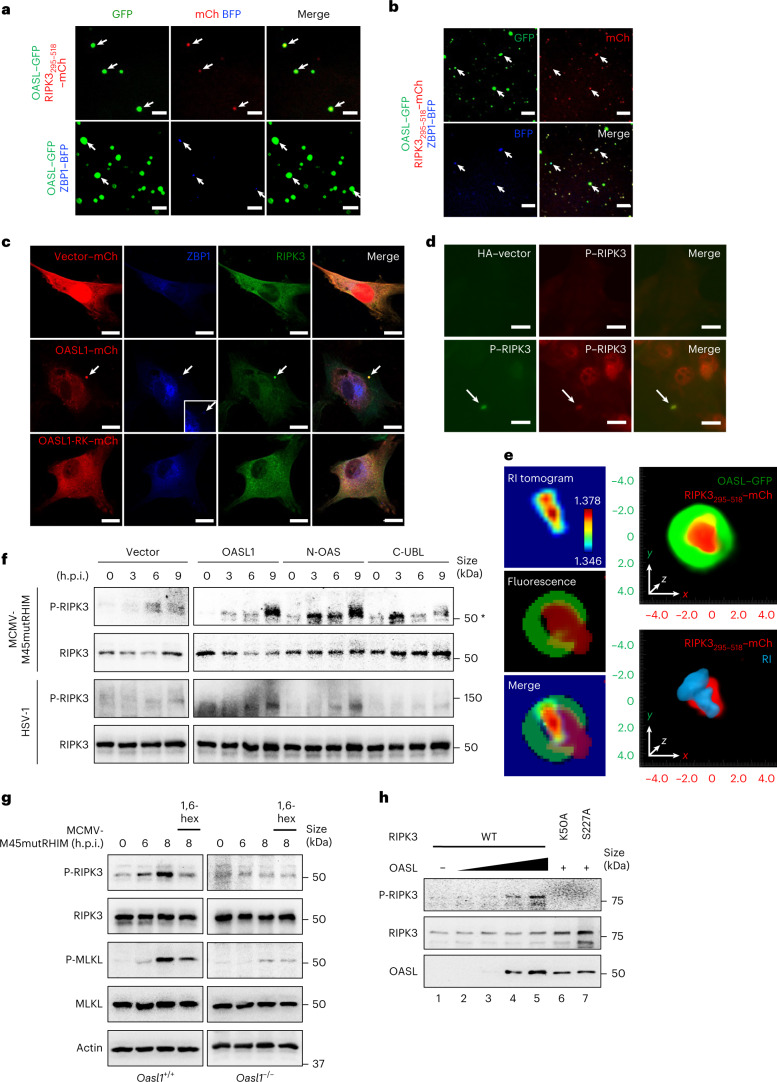
RIPK3-ZBP1-MLKL-mediated necroptosis is a proinflammatory cell death process that is crucial for antiviral host defence. RIPK3 self-oligomerization and autophosphorylation are prerequisites for executing necroptosis, yet the underlying mechanism of virus-induced RIPK3 activation remains elusive. Interferon-inducible 2'-5' oligoadenylate synthetase-like (OASL) protein is devoid of enzymatic function but displays potent antiviral activity. Here we describe a role of OASL as a virus-induced necroptosis promoter that scaffolds the RIPK3-ZBP1 non-canonical necrosome via liquid-like phase condensation. This liquid-like platform of OASL recruits RIPK3 and ZBP1 via protein-protein interactions to provide spatial segregation for RIPK3 nucleation. This process facilitates the amyloid-like fibril formation and activation of RIPK3 and thereby MLKL phosphorylation for necroptosis. Mice deficient in Oasl1 exhibit severely impaired necroptosis and attenuated inflammation after viral infection, resulting in uncontrolled viral dissemination and lethality. Our study demonstrates an interferon-induced innate response whereby OASL scaffolds RIPK3-ZBP1 assembly via its phase-separated liquid droplets to facilitate necroptosis-mediated antiviral immunity.


Conflict of interest statement

The authors declare no competing interests.

Figures

Fig. 1
Fig. 1. The IFN-stimulated protein OASL is required for efficient virus-induced necroptosis.
a, Mouse primary fibroblasts were mock-infected or infected with MCMV-M45mutRHIM virus (multiplicity of infection (m.o.i.) = 5) for 6 h. RIPK3 protein complexes were enriched and immunoprecipitated (IP) using RIPK3 antibody-conjugated agarose beads and analysed by mass spectrometry. Functional-related or biological-related proteins are grouped in boxes. b, HEK 293T cells were transfected with the indicated constructs, and cell lysates were immunoprecipitated with V5-specific antibody. Immunoprecipitates and whole cell extracts (input) were analysed by immunoblotting with the indicated antibodies. c, Cell death kinetics of Oasl1+/+ and Oasl1–/– primary fibroblasts infected with MCMV-WT or MCMV-M45mutRHIM (m.o.i. = 5). Necrotic cell death was measured on the basis of the uptake of Sytox Green and quantified in real-time from 4 to 12 h.p.i. (n = 4 biological replicates). d, Left: microscopy analysis of cell death in Oasl1+/+ and Oasl1–/– primary fibroblasts infected with MCMV-M45mutRHIM at 16 h.p.i. Arrows indicate cells with necrotic features after infection. Scale bar, 20 μm. Right: quantification of necrotic cell death by measuring the release of LDH from Oasl1+/+ and Oasl1–/– primary fibroblasts infected with MCMV-M45mutRHIM (m.o.i. = 5) for 8 h. e, Quantification of necrotic cell death by measuring intracellular ATP levels (n = 4) and LDH release (n = 3) in supernatants of Oasl1+/+ and Oasl1–/– primary fibroblasts infected with HSV-1 (m.o.i. = 5). f, Immunoblot analysis of RIPK3 and MLKL phosphorylation (P-RIPK3 and P-MLKL, respectively) in Oasl1+/+ and Oasl1–/– primary fibroblasts infected with MCMV-M45mutRHIM (left) or HSV-1 (right) at m.o.i. = 5 for the indicated hours. Infected cells were collected and subjected to immunoblotting with the indicated antibodies. g, Viral replication of MCMV-M45mutRHIM and HSV-1 in Oasl1+/+ (n = 4 for MCMV-M45mutRHIM, n = 3 for HSV-1) and Oasl1–/– (n = 2) primary fibroblasts were determined by plaque assays by titrating culture supernatants at the indicating time points. Data are representative of two (b,f,g) or three (ce) independent experiments. For ce,g, data are presented as the mean ± s.e.m. Statistical analyses were performed using two-tailed unpaired t-test (d) or two-way analysis of variance (ANOVA) (ce,g). NS, not significant. Source data
Fig. 2
Fig. 2. OASL chaperones the assembly of the RIPK3–ZBP1 necrosome complex.
a, Oasl1+/+ and Oasl1–/– primary fibroblasts were infected with MCMV-M45mutRHIM (m.o.i. = 5) for 0 or 8 h. Whole-cell lysates were immunoprecipitated using an anti-RIPK3 antibody, followed by immunoblot analysis using the indicated anti-ZBP1, anti-OASL1, anti-RIPK3 or anti-PKR antibody. b,c, In situ PLA using anti-RIPK3 and anti-ZBP1 antibodies in Oasl1+/+ and Oasl1–/– primary fibroblasts infected with MCMV-M45mutRHIM (m.o.i. = 5) for 0 or 6 h. Fluorescence microscopy was used to detect the discrete fluorescent PLA signals (red dots). Representative images of dots indicate the interaction of endogenous RIPK3 and ZBP1. Scale bar, 10 μm. c, Quantification of the dot signals of b per cell (n = 32 cells). Each dot indicates a single cell. d,e, HEK 293T cells were transfected with the indicated Flag, HA, V5 or untagged constructs, and cell lysates were immunoprecipitated with anti-RIPK3 (d) or anti-HA antibodies (e). Immunoprecipitates and whole cell extracts (input) were analysed by immunoblotting with the indicated antibodies. f, AH109 yeasts were transformed with pGBKT7-OASL1 or pACT2-ZBP1 constructs. Interactions were determined by triple dropout (Trp-Leu-His-) synthetic medium or secreted α-galactosidase activity assay using X-Gal. g, OASL1-mediated phosphorylation of the necroptosis effector MLKL. Oasl1–/– primary fibroblasts were complemented with empty vector (Vector), HA-tagged full-length OASL1, N-OAS domain or C-UBL domain and infected with MCMV-M45mutRHIM or HSV-1 (m.o.i. = 5) for the indicated times. Total cell lysates were subjected to immunoblot analysis with the indicated antibodies. h, Measurement of necrotic cell death on the basis of released LDH in Oasl1–/– primary fibroblasts reconstituted with empty vector or the indicated OASL1 constructs infected with HSV-1 (m.o.i. = 5) at various time points. Data are representative of two (bf) or three (a,g,h) independent experiments. For c,h, data are presented as the mean ± s.e.m. and statistical analysis was performed using two-way ANOVA. Source data
Fig. 3
Fig. 3. OASL undergoes LLPS during virus-induced necroptosis.
a, Fluorescence images of droplet formation by GFP-tagged full-length OASL, and the N-OAS and C-UBL domains of OASL in vitro 30 min after induction. b, LLPS of GFP-tagged OASL over time in vitro. c, Time-lapse images of the coalescence of OASL liquid droplets over 120 s (indicated by the arrow). d, Turbidity measurement of GFP-tagged full-length OASL, and the N-OAS and C-UBL domains of OASL over time in vitro. e, Representative 3D RI distribution and fluorescence of OASL droplets before and after incubation at physiological conditions (green, GFP fluorescence; purple, RI tomogram; n = 50 condensates per condition). f, Statistical analyses of morphological (top) and biochemical (bottom) parameters of e (n = 7 condensates per condition). ND, not detected. g, Representative images of OASL–GFP (0.05 μM) phase separation mixed with poly(I:C) LMW (50 μg ml–1), poly(I:C) HMW (50 μg ml–1) or RNase A (300 μg ml–1) for 60 min. h, Droplet formation of full-length OASL–GFP and the dsRNA-binding mutant OASL-RK–GFP. i, Representative images of Oasl1–/– primary fibroblasts reconstituted with OASL1–mCherry (OASL1–mCh) and infected with MCMV-M45mutRHIM. Viral dsRNA was immunostained with J2 antibody. j, Representative images of Oasl1–/– primary fibroblasts reconstituted with HA–vector, HA–OASL1 or HA–OASL-RK and infected with MCMV-M45mutRHIM. Arrows indicate discrete OASL1 foci in the cytosol. k, Top: arrows indicate the SYTO-45-stained OASL1–mCherry area chosen for photobleaching. Bottom: representative images of OASL1–mCherry foci before and after photobleaching (n = 3 cells). Rectangle frames represent the bleached and recovered area within the targeted area. l, Quantitative FRAP of OASL1 and SYTO 45 foci for 160 s in Oasl1–/– fibroblasts reconstituted with OASL1–mCherry and infected with MCMV-M45mutRHIM for 4, 6 or 8 h. Calculated exponential constant (K) and normalized plateau after fluorescence recovery (R) are the mean ± s.e.m. (n = 2 OASL1 and SYTO 45 foci). Images are representative of five (ac,g,h), three (df,i,j) or two (k,l) independent experiments. For f, data are presented as the mean ± s.e.m. and statistical analysis was performed using two-tailed unpaired t-test. Scale bars, 10 μm (ac,g,ik) or 30 μm (h). Source data
Fig. 4
Fig. 4. OASL liquid droplets recruit RIPK3 and ZBP1 to activate RIPK3.
a, Phase separation of OASL–GFP (0.05 μM) incubated with RIPK3295–518–mCherry (top; 2 μM) or ZBP1–BFP (bottom; 1 μM). b, Representative images of OASL–GFP, RIPK3295–518–mCherry and ZBP1–BFP phase separation 1 h after induction. a,b, Arrows indicate colocalized droplets. c, Oasl1–/– fibroblasts reconstituted with mCherry-tagged vector, OASL1 or OASL1-RK, infected with MCMV-M45mutRHIM and immunostained for endogenous ZBP1 and RIPK3. Arrows indicate complex stained positive for OASL1, ZBP1 and RIPK. Inset represents a zoomed view of cytosolic ZBP1 foci. d, MCMV-M45mutRHIM-infected Oasl1–/– primary fibroblasts reconstituted with empty vector or HA-tagged full-length OASL1. Arrow indicates OASL1 and P-RIPK3 foci in the cytosol. e, Left: 2D RI tomogram of RIPK3295–518–mCherry and fluorescence image of OASL–GFP and RIPK3295–518–mCherry. Right, top: 3D fluorescence image of OASL–GFP and RIPK3295–518–mCherry. Right, bottom: 3D fluorescence and RI tomogram of RIPK3295–518–mCherry. f, Immunoblot of Oasl1–/– primary fibroblasts complemented with HA-tagged vector, OASL1, N-OAS or C-UBL and infected with MCMV-M45mutRHIM or HSV-1 (m.o.i. = 5) for the indicated times (asterisk indicates a nonspecific band). g, Immunoblot of RIPK3 and MLKL phosphorylation in Oasl1+/+ and Oasl1–/– primary fibroblasts infected with MCMV-M45mutRHIM (m.o.i. = 5) for the indicated hours and pretreated with or without 1% 1,6-hexanediol (1,6-hex) for 2 h. h, In vitro kinase reactions were conducted by incubating with purified human WT RIPK3 or a kinase-dead mutant (K50A) or a phosphorylation-deficient mutant (S227A) of human RIPK3 with increasing amounts of purified human OASL protein. Reactions were subjected to SDS–PAGE, and the Ser227 autophosphorylation and input levels of RIPK3 and OASL were evaluated. Data are representative of five (a,b,e) or three (c,d,f,g,h) independent experiments, with similar results obtained. Scale bars, 10 μm (ad). Source data
Fig. 5
Fig. 5. OASL phase condensates nucleate RIPK3 and promote RIPK3 activation and amyloid formation.
a, Oasl1+/+ and Oasl1–/– primary fibroblasts infected with MCMV-M45mutRHIM and immunostained for endogenous RIPK3 (anti-RIPK3) and amyloid-like structure (ThT). Arrow indicates foci positive for RIPK3 and ThT. b, Filamentous structure formation after mixing RIPK3295–518–mCherry with high concentrations (2.5 μM) of purified OASL, N-OAS or C-UBL. c, Top: TEM images of OASL–GFP alone, with RIPK3295–518–mCherry or with RIPK3295–518–mCherry and ZBP1–BFP after phase-separation induction for 2 h. Bottom: magnified images of the red square area for each image showing fibril-like structures (red arrows) inside the OASL droplet. d, Electron tomogram of RIPK3295–518–mCherry amyloids alone, with ZBP1–BFP, OASL–GFP, or with ZBP1–BFP and OASL–GFP. First row: 2D projections of the amyloid fibrils. Arrows indicate gold particles used for image alignment. Second row: virtual sections through the tomogram at different z axis positions. Third row: overlay of virtual sections and 3D models. Fourth row: reconstructed 3D model of the amyloid fibrils. e, Quantitative analysis of 3D tomograms of RIPK3–mCherry after incubation with ZBP1 or with ZBP1 and OASL at the indicated times (n = 15). f, Top: Oasl1–/– fibroblasts reconstituted with OASL1–mCherry, infected with MCMV-M45mutRHIM and immunostained for amyloid-like structures. Arrows indicate foci positive for OASL1, RIPK3 and ThT. Bottom: quantification of ThT mean fluorescence intensity per time point (n = 12). g, In vitro kinase reactions of purified OASL–GFP, GST–RIPK3, ZBP1–BFP and MLKL. OASL–RIPK3–ZBP1 were induced for phase separation, subjected to kinase reaction and immunoblotted for Ser227 autophosphorylation of RIPK3 and Ser358 phosphorylation of MLKL (asterisk indicates a nonspecific band). Data are representative of three (a,b,eg) independent experiments, with similar results obtained. For c,d, TEM images are representative of at least eight fields with four independent experiments. For e,f, data are presented as the mean ± s.e.m. and statistical analyses were performed using two-way (e) or one-way (f) ANOVA. Scale bars, 100 nm (d), 200 nm (c, bottom), 500 nm (c, top) or 10 μm (a,b,f). Source data
Fig. 6
Fig. 6. OASL1-mediated necroptosis restricts MCMV viral replication and inflammation in vivo.
a,b, Time course measurement of footpad swelling caused by subcutaneous footpad injection of age-matched and sex-matched Oasl1+/+ and Oasl1–/– mice with 106 p.f.u. MCMV-WT (a) (Oasl1+/+, n = 8; Oasl1–/–, n = 6 for 0–10 d.p.i., n = 2 for 12 d.p.i.) or MCMV-M45mutRHIM (b) (Oasl11+/+, n = 8 for 0–6 d.p.i., n = 4 for 8–12 d.p.i.; Oasl1–/–, n = 8, except n = 2 for 6 d.p.i.). The thickness of the footpads was measured using a digital caliper. Data are presented as the percent increase in thickness relative to the pre-injection measurement and plotted as mean values at the indicated times (n = 9 mice per genotype). c, Virus titres in SGs of Oasl1+/+ and Oasl1–/– mice at 12 d.p.i. of MCMV-WT or MCMV-M45mutRHIM were determined by plaque assay. log10(2) is the limit of detection owing to the toxicity of SG homogenates in NIH3T3 cells (n = 3 mice per genotype). d, IL-1α levels in the serum of Oasl1+/+ and Oasl1–/– mice at 12 d.p.i. of MCMV-WT or MCMV-M45mutRHIM were determined by ELISA (n = 5 mice per genotype). e, Haematoxylin and eosin staining for histological analysis of footpads from mice infected with MCMV-WT (day 6) or MCMV-M45mutRHIM (day 2). f,g, Left: footpad sections corresponding to e (MCMV-WT (f) and MCMV-M45mutRHIM (g)) were subjected to immunohistochemistry staining of RIPK3, P-RIPK3, MLKL and P-MLKL. Positive staining appears brown with haematoxylin counterstain. Right: quantification of the areas stained by P-RIPK3 and P-MLKL in mice infected with MCMV-WT (f, n = 30 for P-RIPK3, n = 15 for P-MLKL) or MCMV-M45mutRHIM (g, n = 8 for P-RIPK3, n = 9 for P-MLKL) in mouse footpads with the indicated genotypes using ImageJ (Fiji) software. All data are pooled from three independent experiments. For ad,f,g, data are presented as the mean ± s.e.m. Statistical analyses were performed using two-tailed unpaired t-test (f,g) or two-way ANOVA (ad). Scale bars, 20 μm (f,g) or 50 μm (e). Source data
Fig. 7
Fig. 7. OASL1-driven necroptosis promotes antiviral activity during other viral infections.
a, Body weight changes of age-matched and sex-matched Oasl1+/+ (n = 8 for 0–6 d.p.i., n = 4 for 7–12 d.p.i.) and Oasl1–/– (n = 6 for 0–6 d.p.i., n = 2 for 7–8 d.p.i., n = 4 for 9–12 d.p.i.) littermate mice after intraperitoneal injection of 107 p.f.u. of the HSV-1 strain KOS. b, Viral DNA in spleens from HSV-1-infected Oasl1+/+ and Oasl1–/– littermate mice were determined by genomic DNA quantitative PCR (n = 7 mice per genotype). Data were normalized against a host housekeeping gene. c, IL-1α levels in the sera of Oasl1+/+ and Oasl1–/– mice infected with HSV-1 were determined by ELISA (n = 5 mice per genotype). d, Survival analysis of age-matched and sex-matched Oasl1+/+ and Oasl1–/– littermate mice intranasally infected with 100 p.f.u. of the IAV strain PR8 (n = 11 for Oasl1+/+, n = 14 for Oasl1–/–). e, Body weight changes of mice (Oasl1+/+, n = 10 for 0–6 d.p.i., n = 6 for 7–9 d.p.i., n = 3 for 10–11 d.p.i.; Oasl1–/–, n = 14 for 0–6 d.p.i., n = 11 for 7–8 d.p.i., n = 2 for 9–11 d.p.i.) in d. f, Virus titres and viral RNA loads in lungs from IAV-infected Oasl1+/+ and Oasl1–/– littermate mice were determined by plaque assay (left) and quantitative PCR with reverse transcription (right) (n = 6 mice per genotype). g, IL-1α levels in the sera of Oasl1+/+ and Oasl1–/– mice infected with IAV were determined by ELISA (n = 5 mice per genotype). All data are pooled from two independent experiments. For ac,eg, data are presented as the mean ± s.e.m. Statistical analyses were performed using two-tailed unpaired t-test (b,c) or two-way ANOVA (a,eg). Data for d are presented as a Kaplan–Meier plot. For b,c and f,g, each symbol represents one mouse, and horizontal lines represent the mean value. h, Representative model of OASL-mediated virus-induced necroptosis. OASL undergoes LLPS and recruits RIPK3 and ZBP1 via protein–protein interactions to scaffold the assembly. OASL phase condensation induces RIPK3 nucleation and amyloid-like fibril formation, which in turn leads to RIPK3 autophosphorylation. Consequently, activated RIPK3 induces high levels of necroptosis and proinflammatory responses during virus-induced necroptosis. Source data
Extended Data Fig. 1
Extended Data Fig. 1. Generation of Oasl1-/- mouse using the CRISPR-Cas9 system and the function of Oasl1 in virus-induced necroptosis.
a, Schematic of the genomic target in OASL1 gene and OASL1 exon 2 sgRNA. The sgRNA sequence (designed in http://chopchop.cbu.uib.no) is marked in green and the protospacer adjacent motif (PAM) sequence is marked in red. Blue arrow points the predicted cleavage site. b, Mouse Oasl1 genomic sequences from Oasl1+/+ and Oasl1-/- littermate mice. PAM sequence is marked in red. 5 base pairs deletion was shown in Oasl1-/- mice. c,d, Immunoblot analysis of OASL1 expression in Oasl1+/+ and Oasl1-/- primary fibroblasts infected with MCMV (c) or treated with IFN-β (d) for the indicated times. e, Quantification of necrotic cell death by measuring the intracellular ATP levels in Oasl1+/+ and Oasl1-/- primary fibroblasts upon TNF-α (50 ng/ml) and/or zVAD (20 mM) treatment. f, Measurement of lactate dehydrogenase (LDH) release to the medium in Oasl1+/+ or Oasl1-/- primary fibroblasts infected with MCMV-WT (m.o.i. = 5) for 8 h. g, Immunoblot analysis of RIPK3 and MLKL phosphorylation in Oasl1+/+ or Oasl1-/- primary fibroblasts infected with MCMV-WT (m.o.i. = 5) for the indicated hours. h, MCMV-WT titer in Oasl1+/+ and Oasl1-/- primary fibroblasts were determined by plaque assays by titrating culture medium at the indicating time points (n = 4 for Oasl1+/+, n = 2 for Oasl1-/-). i, (Left) Immunoblot analysis of CRISPR Cas9-mediated knockout of human OASL in A549 cells upon mock or Sendai virus (SeV) infection (Asterisk, non-specific band). Quantification of necrotic cell death by measuring the intracellular ATP levels in WT and hOASL KO A549 cells infected with (middle) HSV-GFP (m.o.i. = 10) upon IFN-β stimulation (n = 3) or (right) VACV (m.o.i. = 5) (n = 2). c,d,g, Data are representative of two independent experiments. e,f, Data are presented as mean ± SEM from three independent experiments. Statistical analyses were performed using a two-tailed unpaired t-test (f) or two-way analysis of variance (ANOVA) (e,h,i). ns, not significant. Source data
Extended Data Fig. 2
Extended Data Fig. 2. OASL interacts with RIPK3 and ZBP1 through its N-OAS and C-UBL domain, respectively.
a, In situ proximity ligation assay (PLA) of RIPK3 and ZBP1 in Oasl1+/+ and Oasl1-/- primary fibroblasts infected with mock or MCMV-M45mutRHIM (m.o.i. = 5) for the indicated hours. Fluorescence microscope was used to detect the discrete fluorescent PLA signals (red dots). Representative images of dots indicate the interaction of endogenous RIPK3 and ZBP1. b, Quantification of dot signals of a per cell (n = 30 cells). Each dot indicates single cell. c, HEK 293 T cells were transfected with the indicated FLAG or untagged constructs, and cell lysates were immunoprecipitated with anti-FLAG antibody. Immunoprecipitates and whole cell extracts (input) were analyzed by immunoblotting with the indicated antibodies. d, AH109 yeasts were transformed with the indicated pGBKT7 or pACT2 constructs. Interactions were measured by triple dropout (Trp-Leu-His-) synthetic medium or secreted α-galactosidase activity assays using X-αGal. e, Schematic of the interaction of OASL with RIPK3 and ZBP1 through its N-terminus and C-terminus domains, respectively. a-d, Data are representative of two independent experiments with similar results. b, Data are presented as mean ± SEM and statistical analysis was performed using two-way ANOVA. Source data
Extended Data Fig. 3
Extended Data Fig. 3. Liquid-liquid phase separation properties of OASL, RIPK3, and ZBP1.
a, Graph of putative intrinsically disordered regions of human OASL, RIPK3, and ZBP1 as calculated by PONDR (VSL2) algorithm. b, Failure of liquid droplet formation of purified mCherry-tagged full-length RIPK3 or C-terminal RIPK3295-518. Scale bar, 10 μm. c, Failure of liquid droplet formation of purified BFP-tagged full-length ZBP1. Scale bar, 10 μm. d, In vitro droplet formation by GFP-tagged full-length OASL, N-OAS, or C-UBL protein in a concentration-dependent manner. Incubation was carried out at physiological temperature and buffer for 1 h. Scale bar, 10 μm. b-d, Histogram represent distribution of quantified droplet amounts and diameters of the liquid droplets. e, Effect of KCl concentration on the formation of OASL liquid droplets. Scale bar, 10 μm. f, OASL-GFP droplets treated with increasing concentration of 1,6-hexanediol. Scale bar, 5 μm. g, Increase of Mg2+ concentration leads to enlargement of OASL droplets. Scale bar, 10 μm. h, In vitro liquid droplet formation of GFP-tagged mouse OASL (OASL1) treated with mock or poly(I:C) HMW (50 μg/ml) for 1 h. Scale bar, 10 μm. i, (Left) Schematic diagram of Sortase A-mediated labeling of FITC at the C-terminus of OASL with Sortase A-recognition motif (LPETGG). (Right) In vitro phase separation of FITC-labeled OASL treated with mock or poly(I:C) HMW (50 μg/ml). Scale bar, 10 μm. j,k, Representative FRAP images of OASL1 foci observed at (j) 4 h.p.i. and (l) 8 h.p.i. (l). SYTO 45-stained OASL1-Cherry foci were chosen for photobleaching. White rectangle box indicates the photobleached and recovered area within the foci. Scale bar, 10 μm. Data are representative of three (b-i) or two (j,k) independent experiments with similar results. Source data
Extended Data Fig. 4
Extended Data Fig. 4. OASL liquid phase separation during virus-induced necroptosis.
a, (Left) Representative images of liquid droplet formation of GFP-tagged full-length OASL, N-terminus OAS-like domain, or C-terminus UBL domain with mCherry-tagged RIPK3295-518. Scale bar, 5 μm. (Right) Histogram of the size and formation frequency of RIPK3295-518-mCherry droplets with or without the presence of GFP-tagged OASL proteins. b, (Left) Full length RIPK3-mCherry undergoes phase separation in the presence of purified OASL or N-OAS, but not C-UBL. Representative images of liquid droplet formation of mCherry-tagged full-length RIPK3 in the presence of full-length OASL, N-OAS or C-UBL. 2 µM of RIPK3-mCherry was mixed with 0.5 μM of purified OASL proteins. Scale bar, 5 μm. (Right) Histogram of the size and formation frequency of RIPK3 droplets. c, Confocal imaging of mock-infected Oasl1-/- primary fibroblasts reconstituted with mCherry-tagged vector, OASL1, or OASL1RK. Scale bar, 10 μm. d, (Top) OASL1-mCherry merged image of Fig. 4c with line across the condensate. Scale bar, 10 μm. (Bottom) Line profile of fluorescence intensity indicates colocalization of OASL1, ZBP1, and RIPK3 signal in OASL1-mCherry expressing Oasl1-/- primary fibroblasts. e, Quantitative analysis of morphological (top) and biochemical (bottom) parameters of OASL-GFP alone, RIPK3295-518-mCherry alone, and OASL-GFP with RIPK3295-518-Cherry liquid-like droplets before and after incubation at physiological conditions (n = 13 condensates per group). Morphological parameters include volumes, surface areas, and sphericity. Biochemical parameters include dry mass, concentration, and mean RI. ND, not detected. Data are representative of three (a-c) or two (e) independent experiments with similar results. Source data
Extended Data Fig. 5
Extended Data Fig. 5. OASL phase separation promotes RIPK3 amyloid fibrillation.
a, Representative images of mock-infected Oasl1+/+ and Oasl1-/- primary fibroblasts immunostained for endogenous RIPK3 and amyloid-like structure by anti-RIPK3 antibody and Thioflavin T (ThT), respectively. Scale bar, 10 μm. b, Fibrillation of RIPK3295-518-mCherry in vitro with increasing amounts of OASL at physiological (left) KCl or (right) NaCl concentration for 16 h. c, Dose-response curve of OASL inducing RIPK3295-518-mCherry fibrillation assessed by ThT emission. d, Quantification of RIPK3295-518-mCherry and ThT signal colocalization upon incubation with OASL, N-OAS, or C-UBL. Box plots show the minimum, first quartile, median, third quartile, and maximum with n = 150 droplets per group. e, TEM imaging of RIPK3295-518-mCherry fibrils after phase separation with ZBP1-BFP and OASL-GFP, followed by immunogold-labeling with anti-RIPK3 antibody upon (top) normal or (bottom) denatured condition. Prominent immunogold labeling was observed in denatured condition. f, Virtual sections of RIPK3 amyloid fibrils through the tomogram and overlays with 3D-model at different z-axis positions. g, Virtual sections of RIPK3295-518-mCherry fibrils through tomogram at different z-axis positions. h, TEM images of RIPK3295-518-mCherry alone or incubated with OASL or OASL and ZBP1 together after 20 or 120 min of phase separation. Scale bar, 200 nm. Insets: magnified views of the red box regions. e-h, Scale bar, 100 nm. i, Representative 3D refractive index distribution of RIPK3 + ZBP1 or RIPK3 + ZBP1 + OASL at the indicated times. RI tomogram: blue (RIPK3), yellow (ZBP1), purple (OASL). (n = 30 condensates per condition). j,k, 3D tomogram quantitative analysis of ZBP1-BFP (j) and OASL-GFP (k) upon co-incubation with RIPK3 (n = 15 condensates per group). Data are representative of three (a-d) or two (i-k) independent experiments with similar results. e-h, TEM images are representative of at least 8 fields with four independent experiments. j,k, Data are presented as mean ± SEM and statistical analyses were performed using two-way ANOVA. ND, not detected. Source data
Extended Data Fig. 6
Extended Data Fig. 6. Murine OASL1 is required for MCMV infection-induced necroptosis to restrict viral dissemination in vivo.
a, Measurement of footpad swelling caused by subcutaneous footpad injection of Ripk3+/+ or Ripk3-/- mice with 106 PFU (left) MCMV-WT (n = 4 per genotype) or (right) MCMV-M45mutRHIM (Ripk3+/+: n = 5, except n = 3 for 6 d.p.i.; Ripk3-/-: n = 5 for 0-4, 10 d.p.i., n = 3 for 6,8,11 d.p.i.). Data are represented as the percent increase in thickness relative to the pre-injection measurement and plotted for mean values at the indicated times. b,c, Body weight changes of a Ripk3+/+ and Ripk3-/- mice infected with MCMV-WT (n = 4 per genotype) and MCMV-M45mutRHIM infection (n = 5 per genotype) and Fig. 6a,b Oasl1+/+ and Oasl1-/- littermate mice infected with MCMV-WT (n = 8 for Oasl1+/+ and n = 6 for Oasl1-/-) or MCMV-M45mutRHIM (n = 8 mice per genotype). d,e, Viral titers in salivary glands (SG) from Oasl1+/+ and Oasl1-/- littermate mice infected with (d) MCMV-WT (n = 3 mice per genotype) or (e) MCMV-M45mutRHIM (n = 2 for Oasl1+/+ and n = 3 for Oasl1-/-) at the indicated days post-footpad subcutaneous injection. f, IL-1α levels in the sera of Oasl1+/+ and Oasl1-/- mice infected with MCMV-WT or MCMV-M45mutRHIM at the indicated days were determined by ELISA (n = 3 mice per genotype). d-f, Each symbol represents one mouse, horizontal lines represent the mean value. g,h, Quantification of Fig. 6e cell infiltration (n = 8 per genotype for PBS, n = 17 per genotype for MCMV-WT) and footpad epidermal thickness (n = 31 per genotype for PBS, n = 41 per genotype for MCMV-M45mutRHIM) in mice infected with MCMV-WT or MCMV-M45mutRHIM at 2 or 6 d.p.i., respectively. All data are pooled from three independent experiments. d-h Data are presented as mean ± SEM. Statistical analyses were performed using a two-tailed unpaired t-test (d-f) or two-way ANOVA (a,g,h). Source data
Extended Data Fig. 7
Extended Data Fig. 7. OASL1 is required for influenza virus infection-induced immune cell infiltration.
a,b, H&E staining of whole lung sections of Oasl1+/+ and Oasl1-/- littermate mice intranasally-inoculated with (a) PBS or (b) 100 PFU of IAV PR8 at 7 d.p.i. Scale bar, 1 mm. c,d, Representative histology of lung sections of a,b, respectively. Scale bar, 200 μm.

References

    1. Pasparakis M, Vandenabeele P. Necroptosis and its role in inflammation. Nature. 2015;517:311–320. doi: 10.1038/nature14191. - DOI - PubMed
    1. Cho YS, et al. Phosphorylation-driven assembly of the RIP1–RIP3 complex regulates programmed necrosis and virus-induced inflammation. Cell. 2009;137:1112–1123. doi: 10.1016/j.cell.2009.05.037. - DOI - PMC - PubMed
    1. Zhang DW, et al. RIP3, an energy metabolism regulator that switches TNF-induced cell death from apoptosis to necrosis. Science. 2009;325:332–336. doi: 10.1126/science.1172308. - DOI - PubMed
    1. Mocarski ES, Upton JW, Kaiser WJ. Viral infection and the evolution of caspase 8-regulated apoptotic and necrotic death pathways. Nat. Rev. Immunol. 2011;12:79–88. doi: 10.1038/nri3131. - DOI - PMC - PubMed
    1. Upton JW, Kaiser WJ, Mocarski ES. Virus inhibition of RIP3-dependent necrosis. Cell Host Microbe. 2010;7:302–313. doi: 10.1016/j.chom.2010.03.006. - DOI - PMC - PubMed

Publication types