. 2023 Jan;25(1):42-55.
doi: 10.1038/s41556-022-01051-2. Epub 2023 Jan 5.

ZFP462 safeguards neural lineage specification by targeting G9A/GLP-mediated heterochromatin to silence enhancers

Affiliations

ZFP462 safeguards neural lineage specification by targeting G9A/GLP-mediated heterochromatin to silence enhancers

Ramesh Yelagandula et al. Nat Cell Biol. 2023 Jan.

Abstract

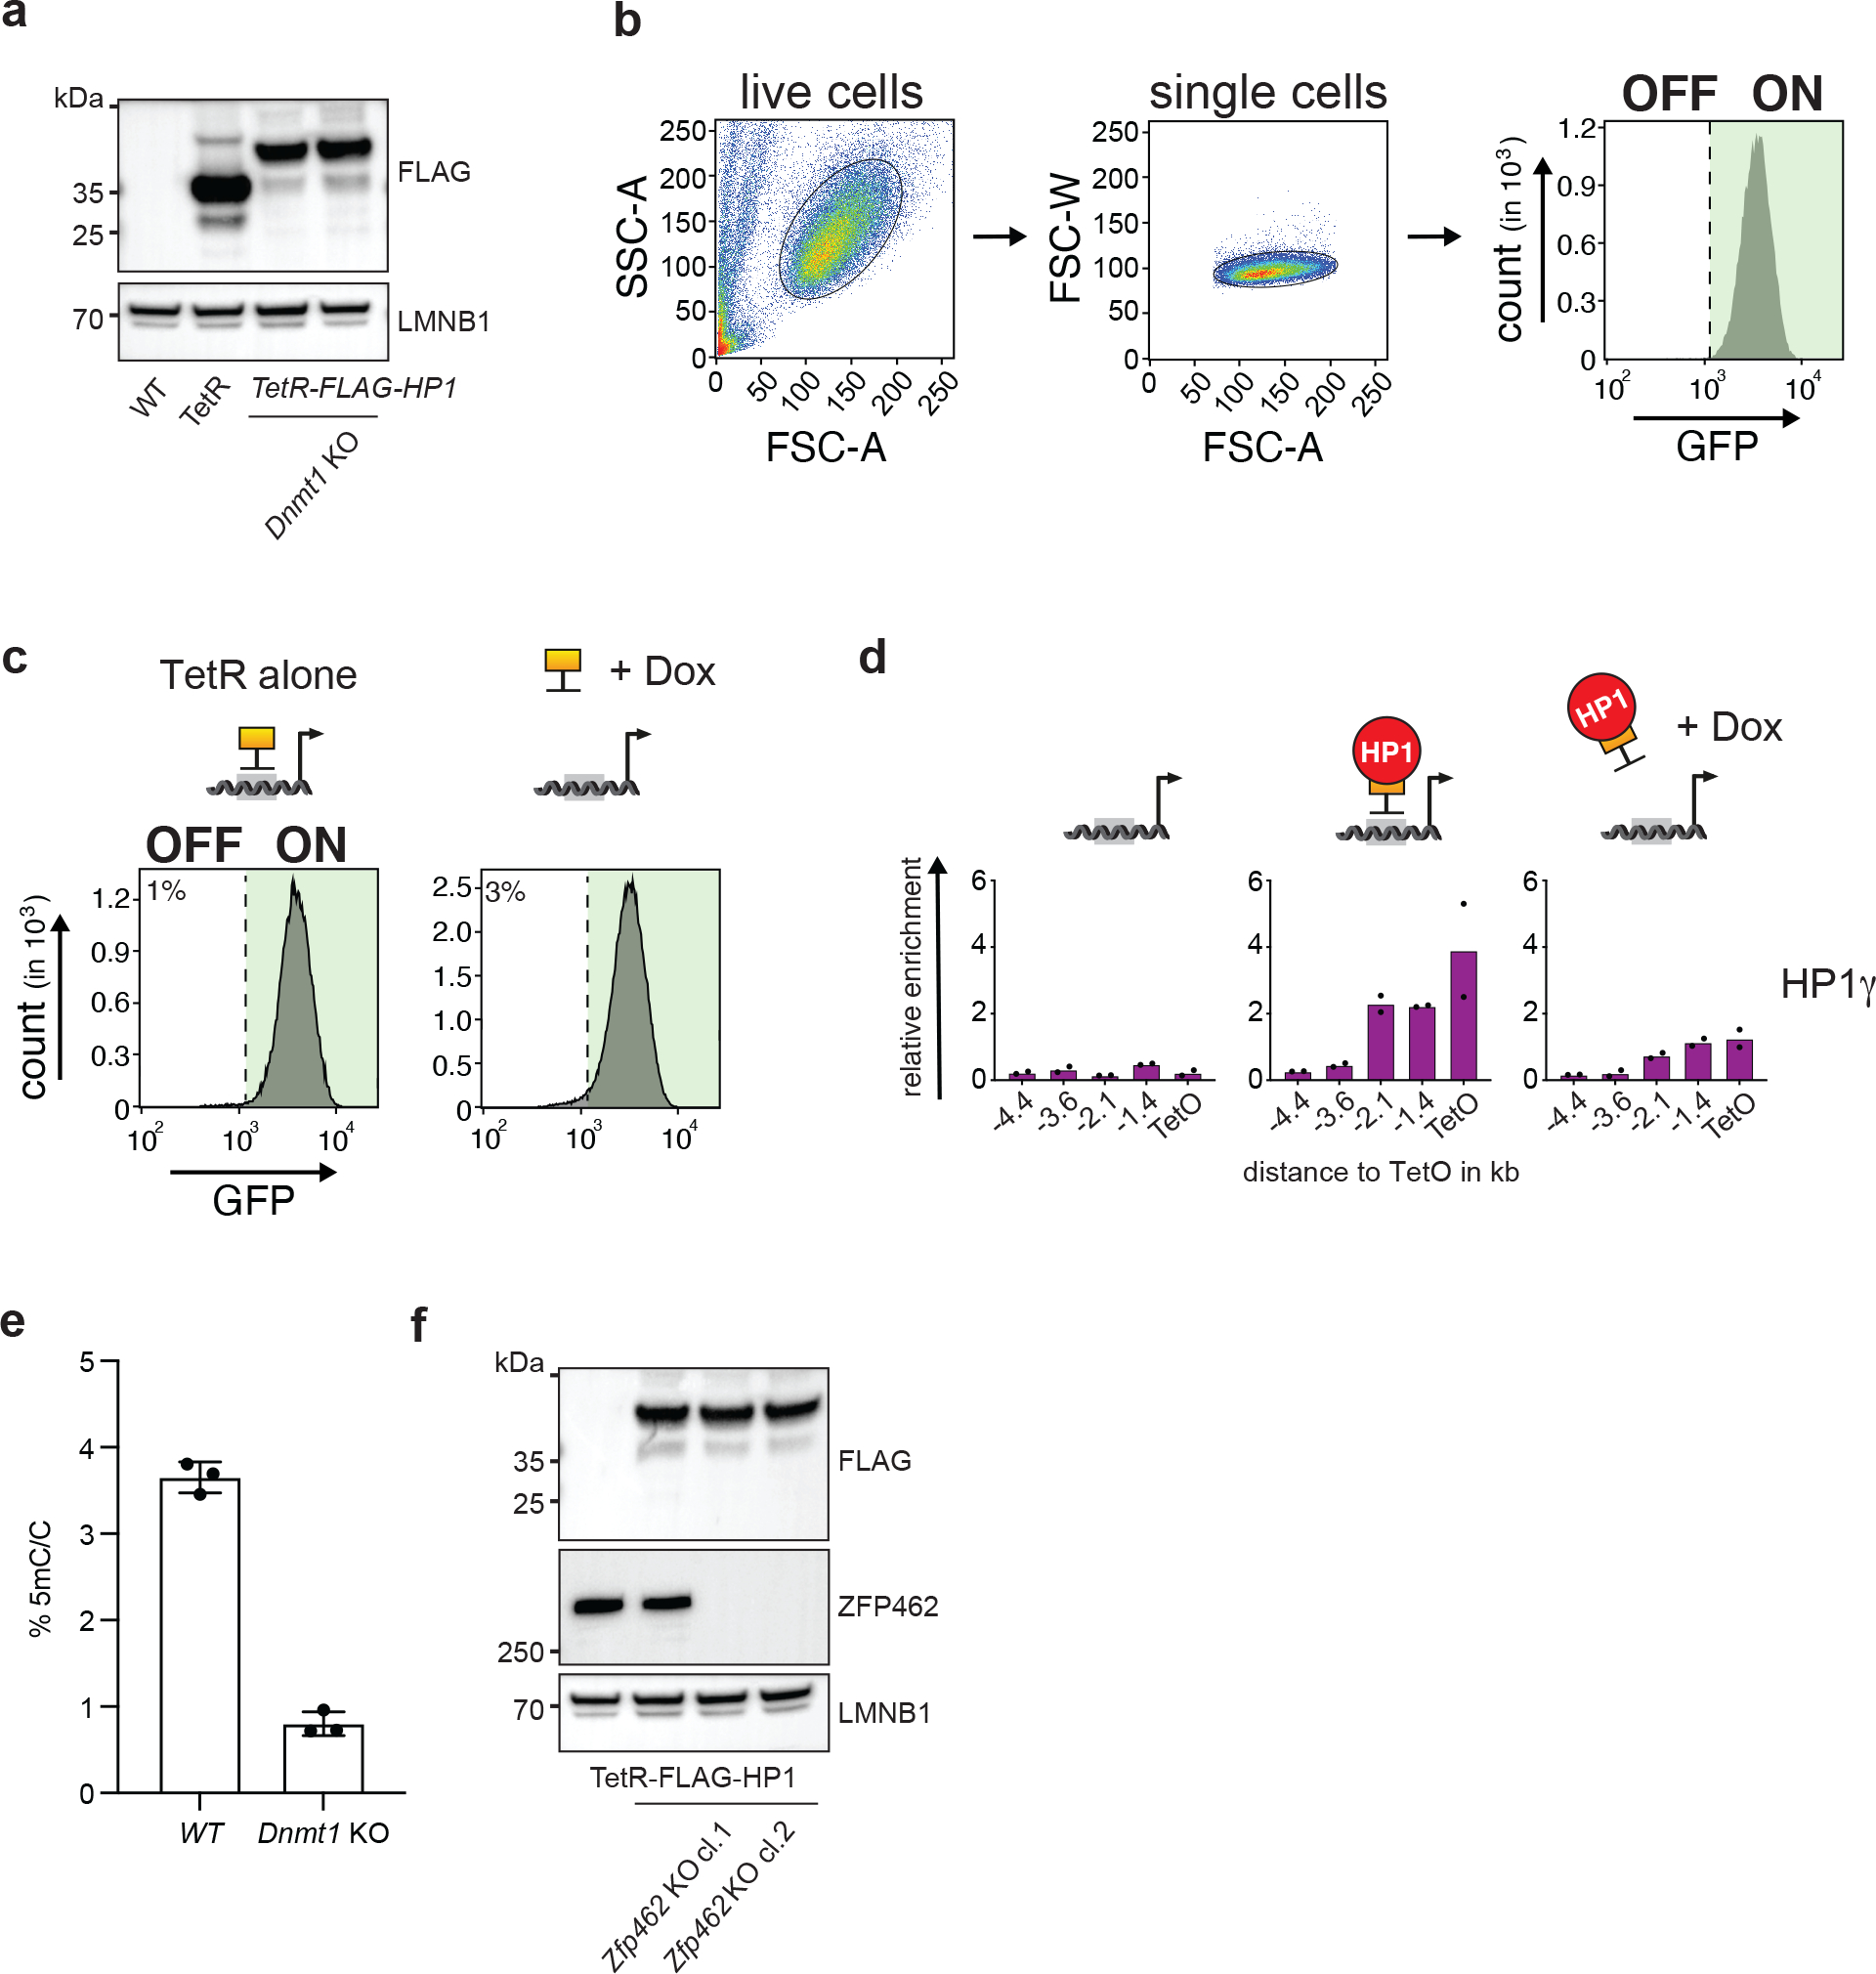
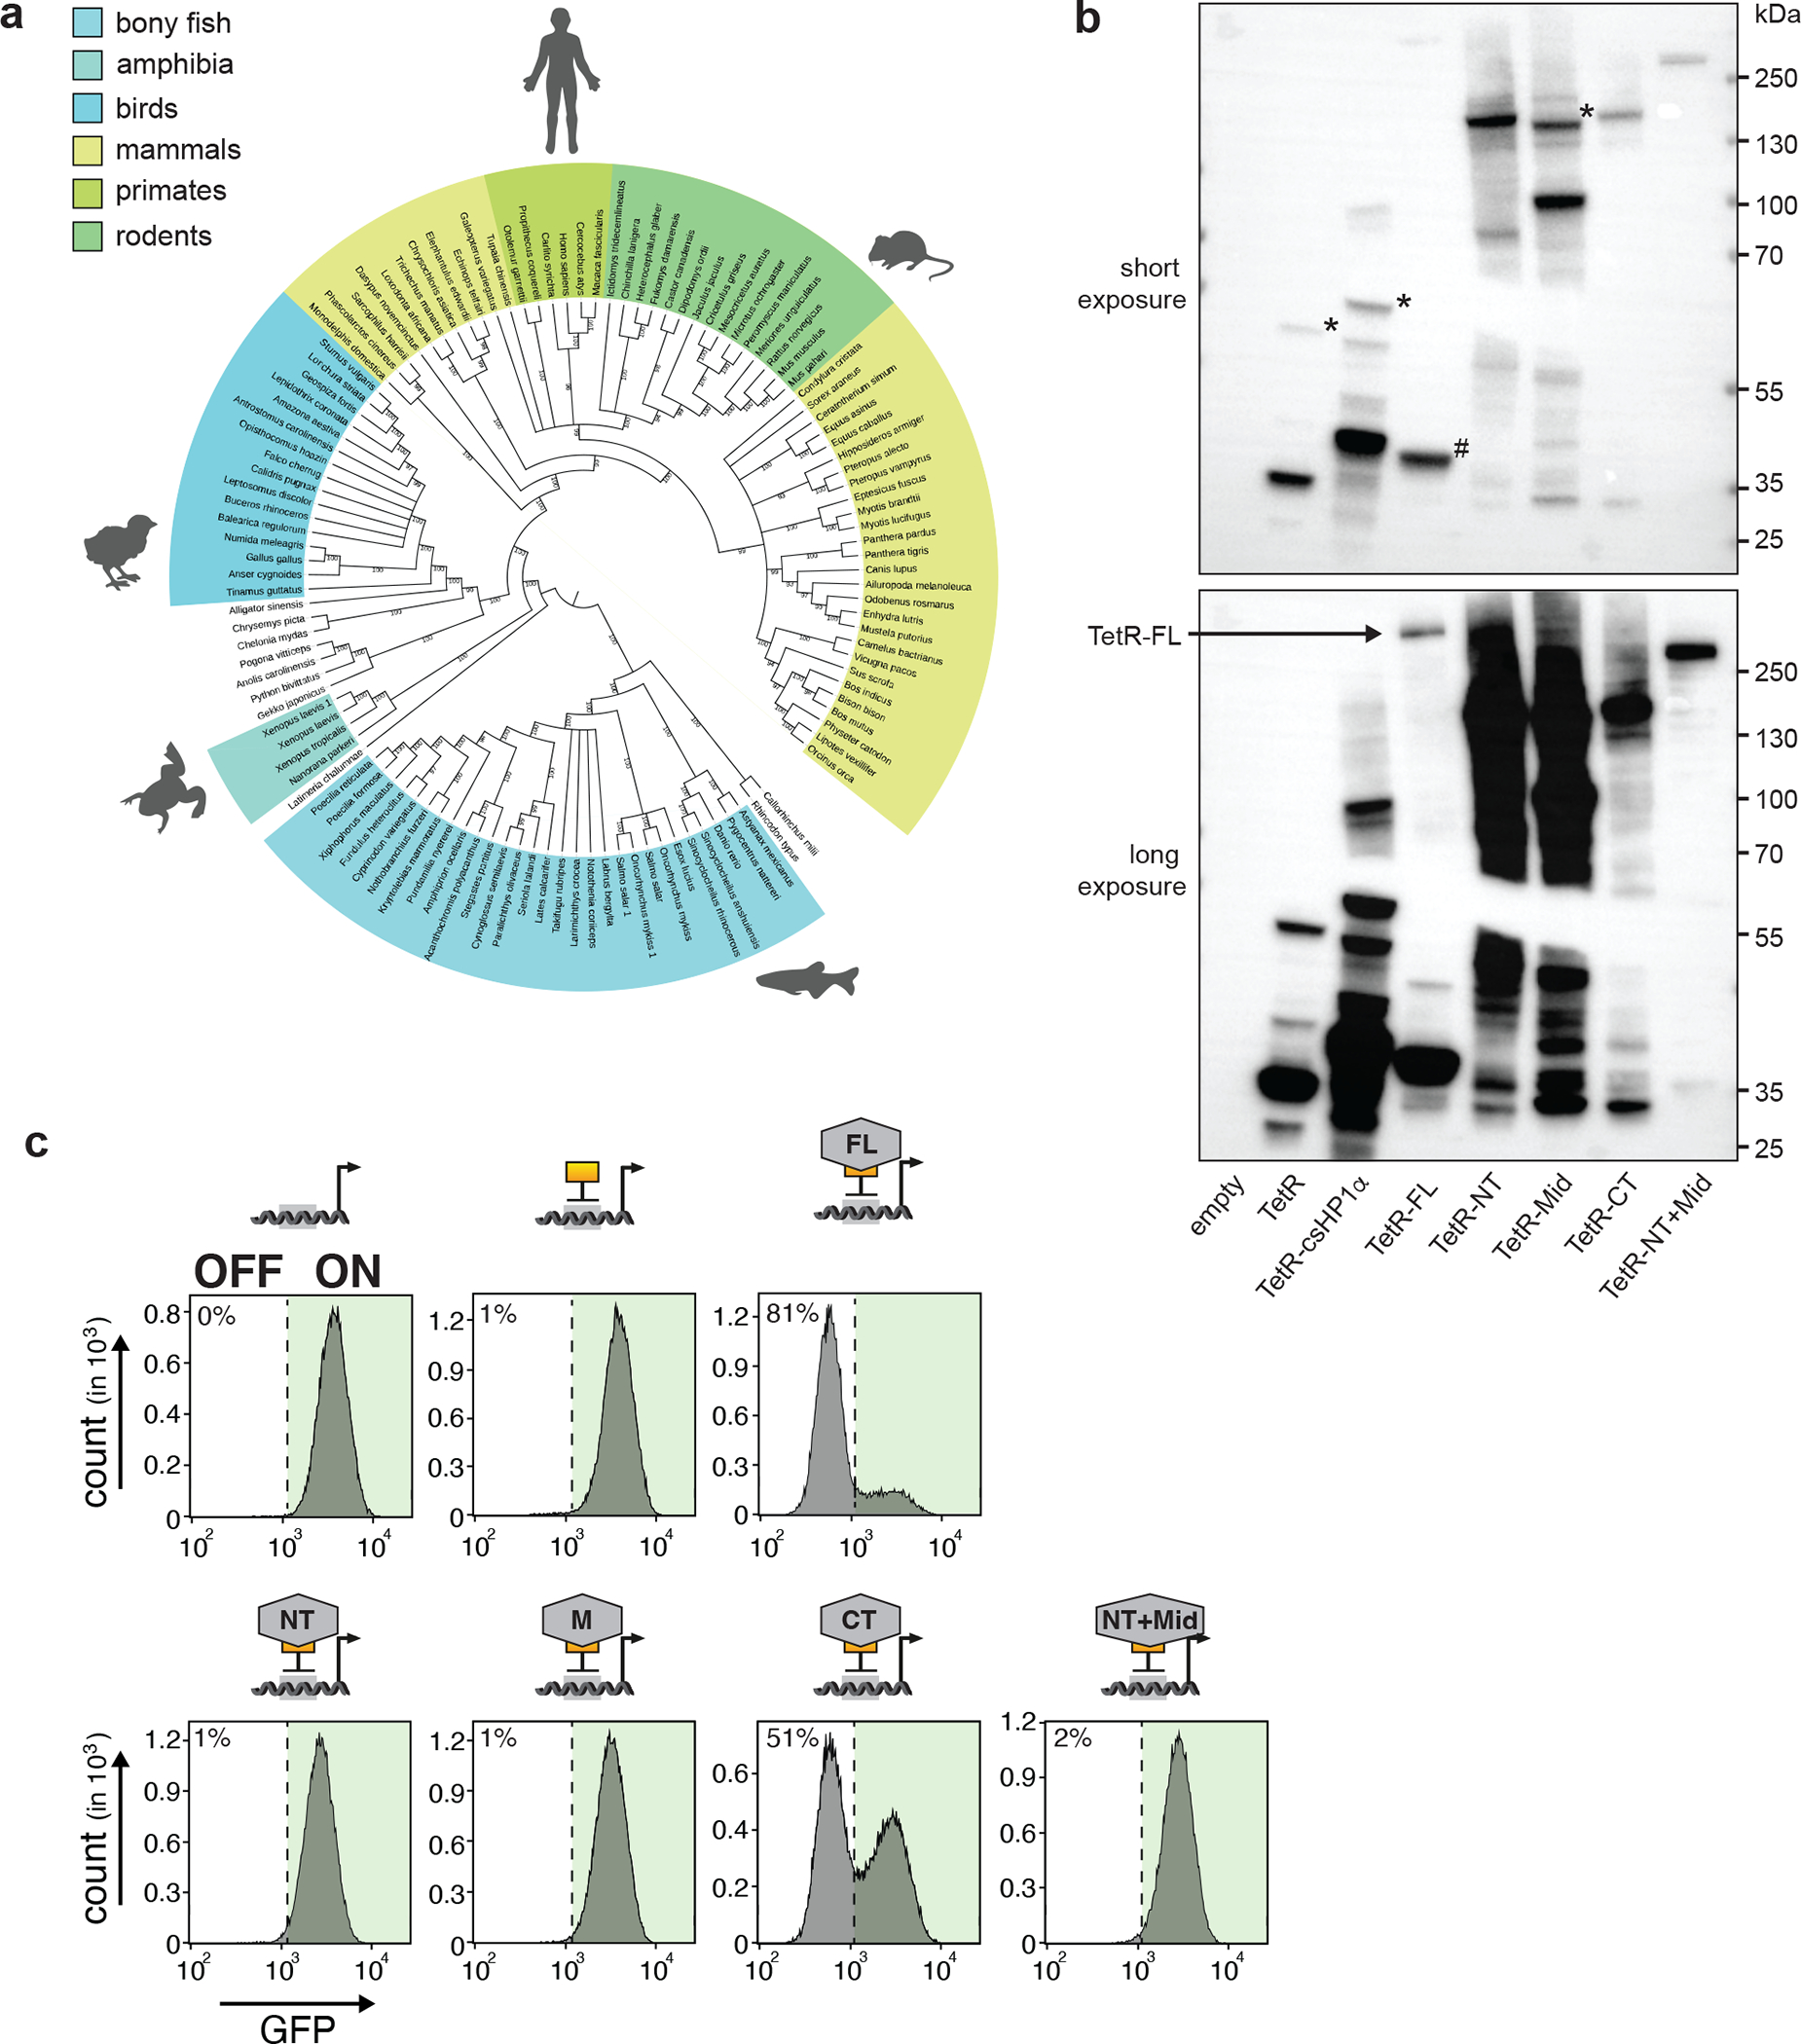
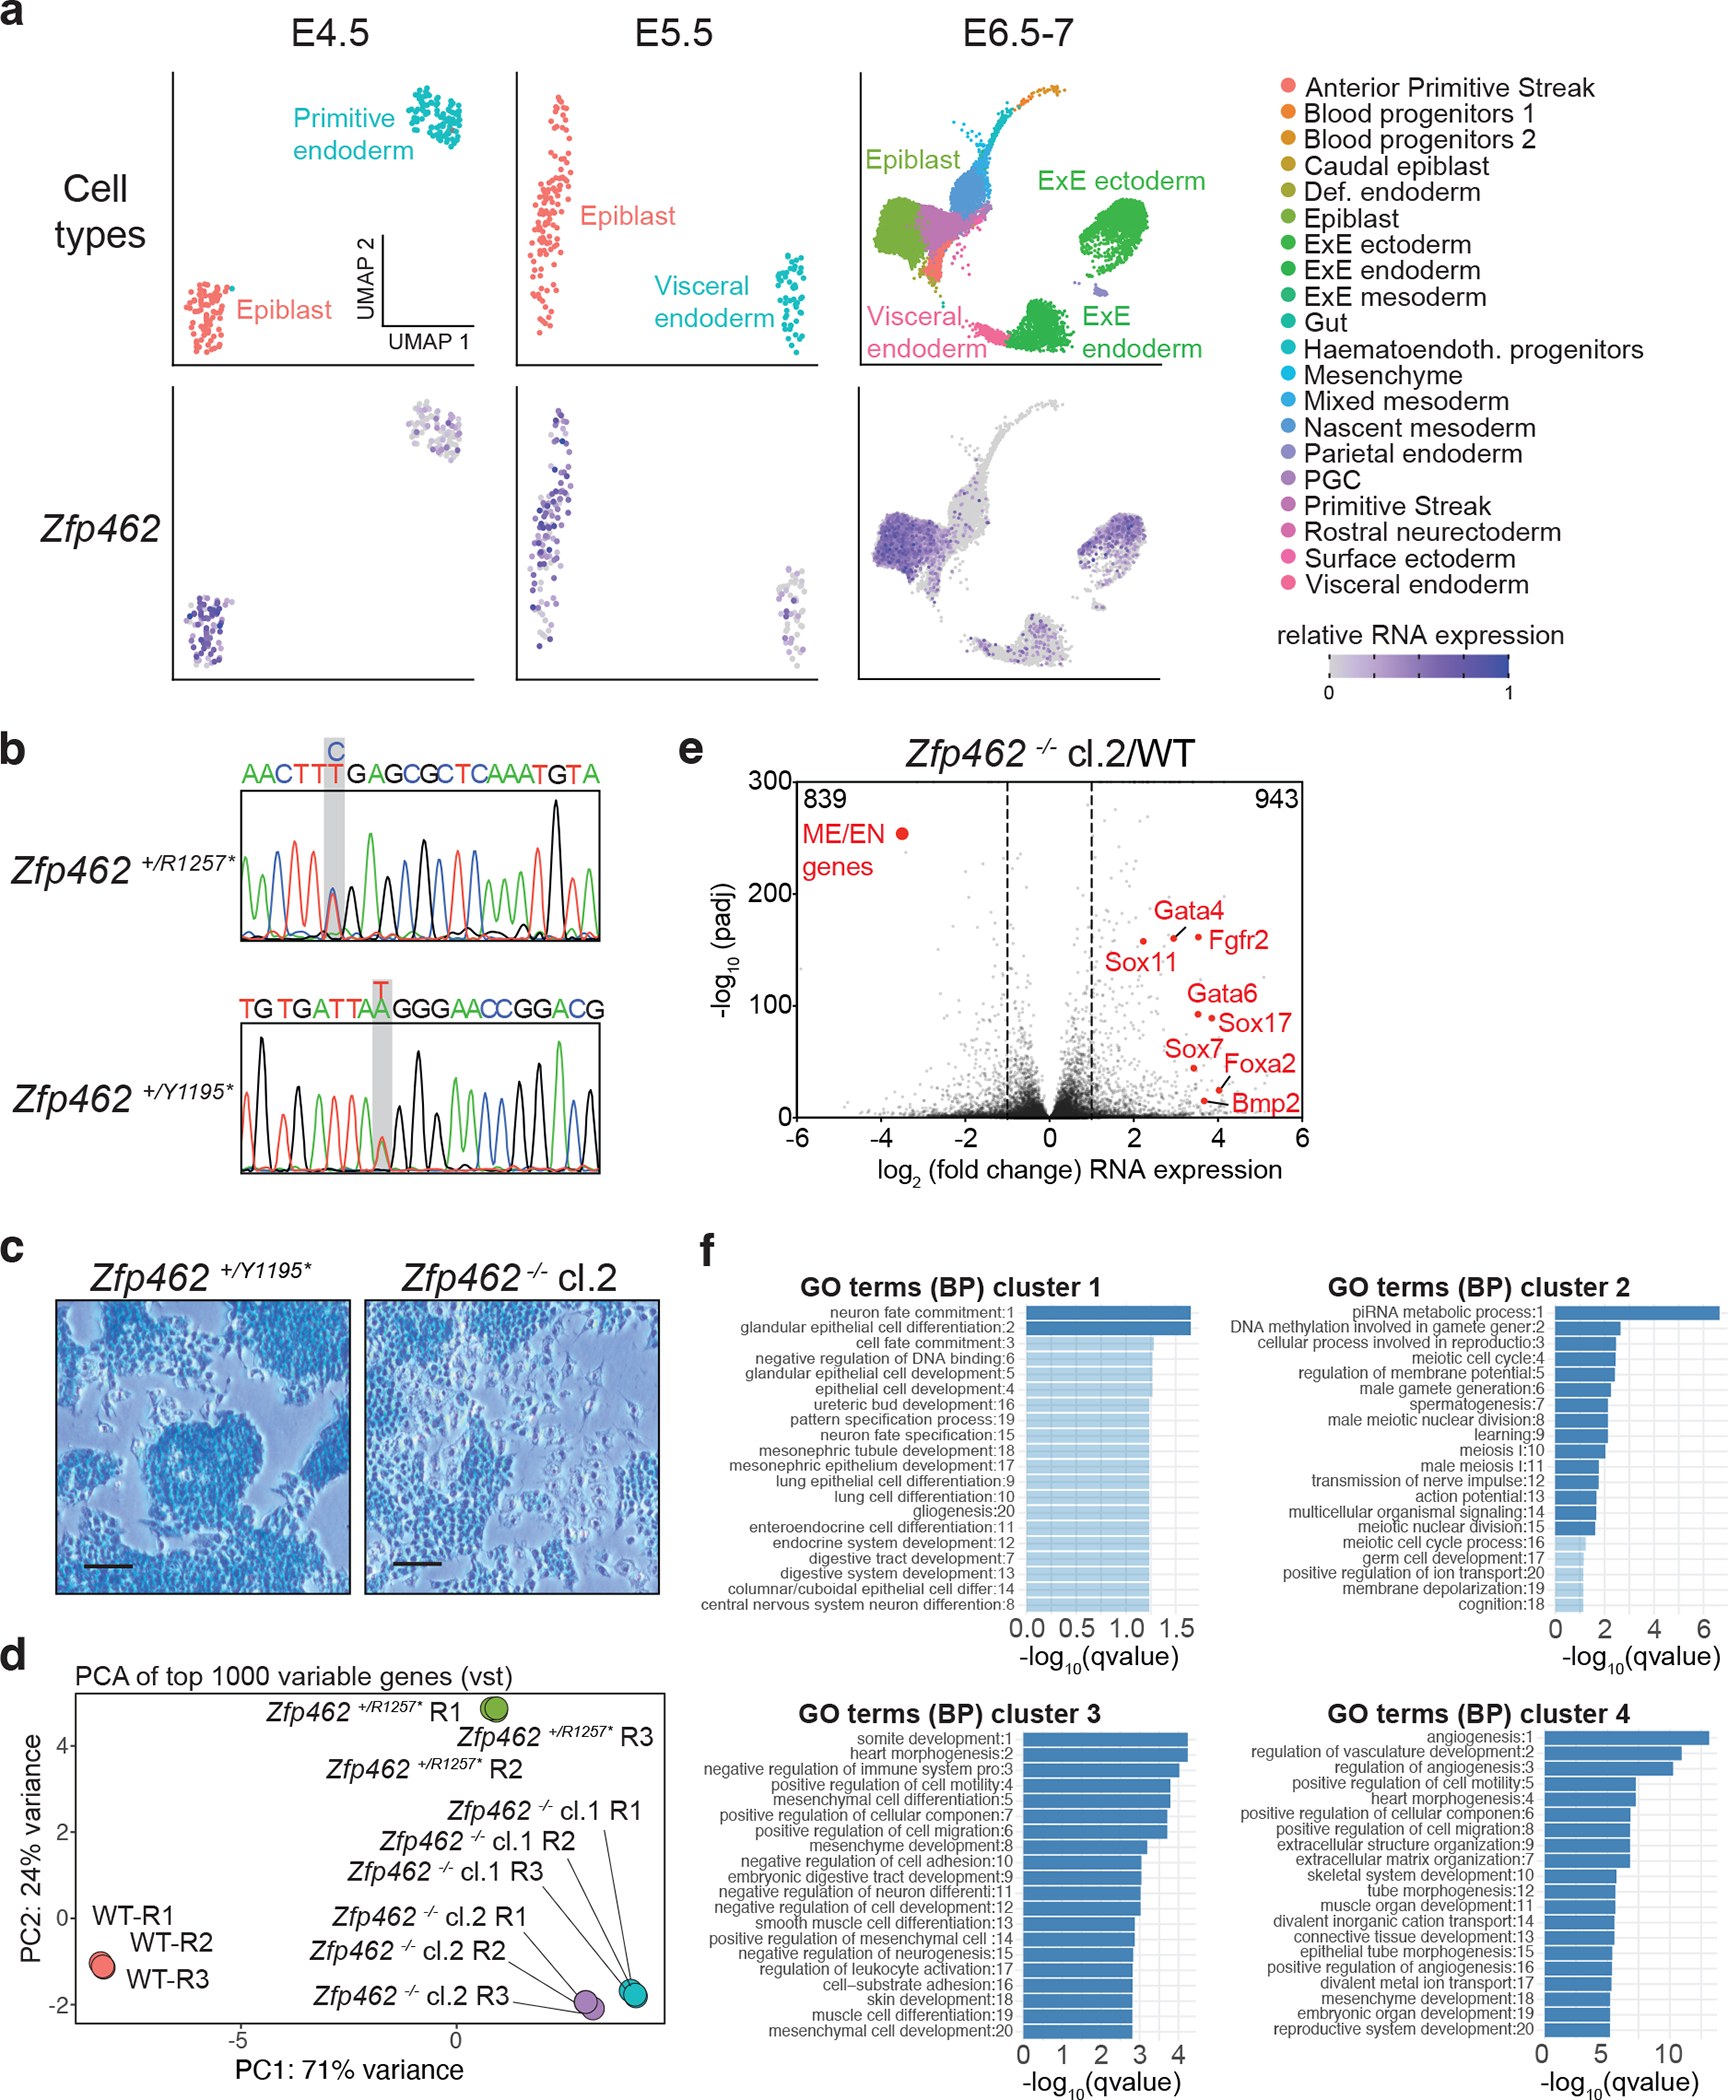
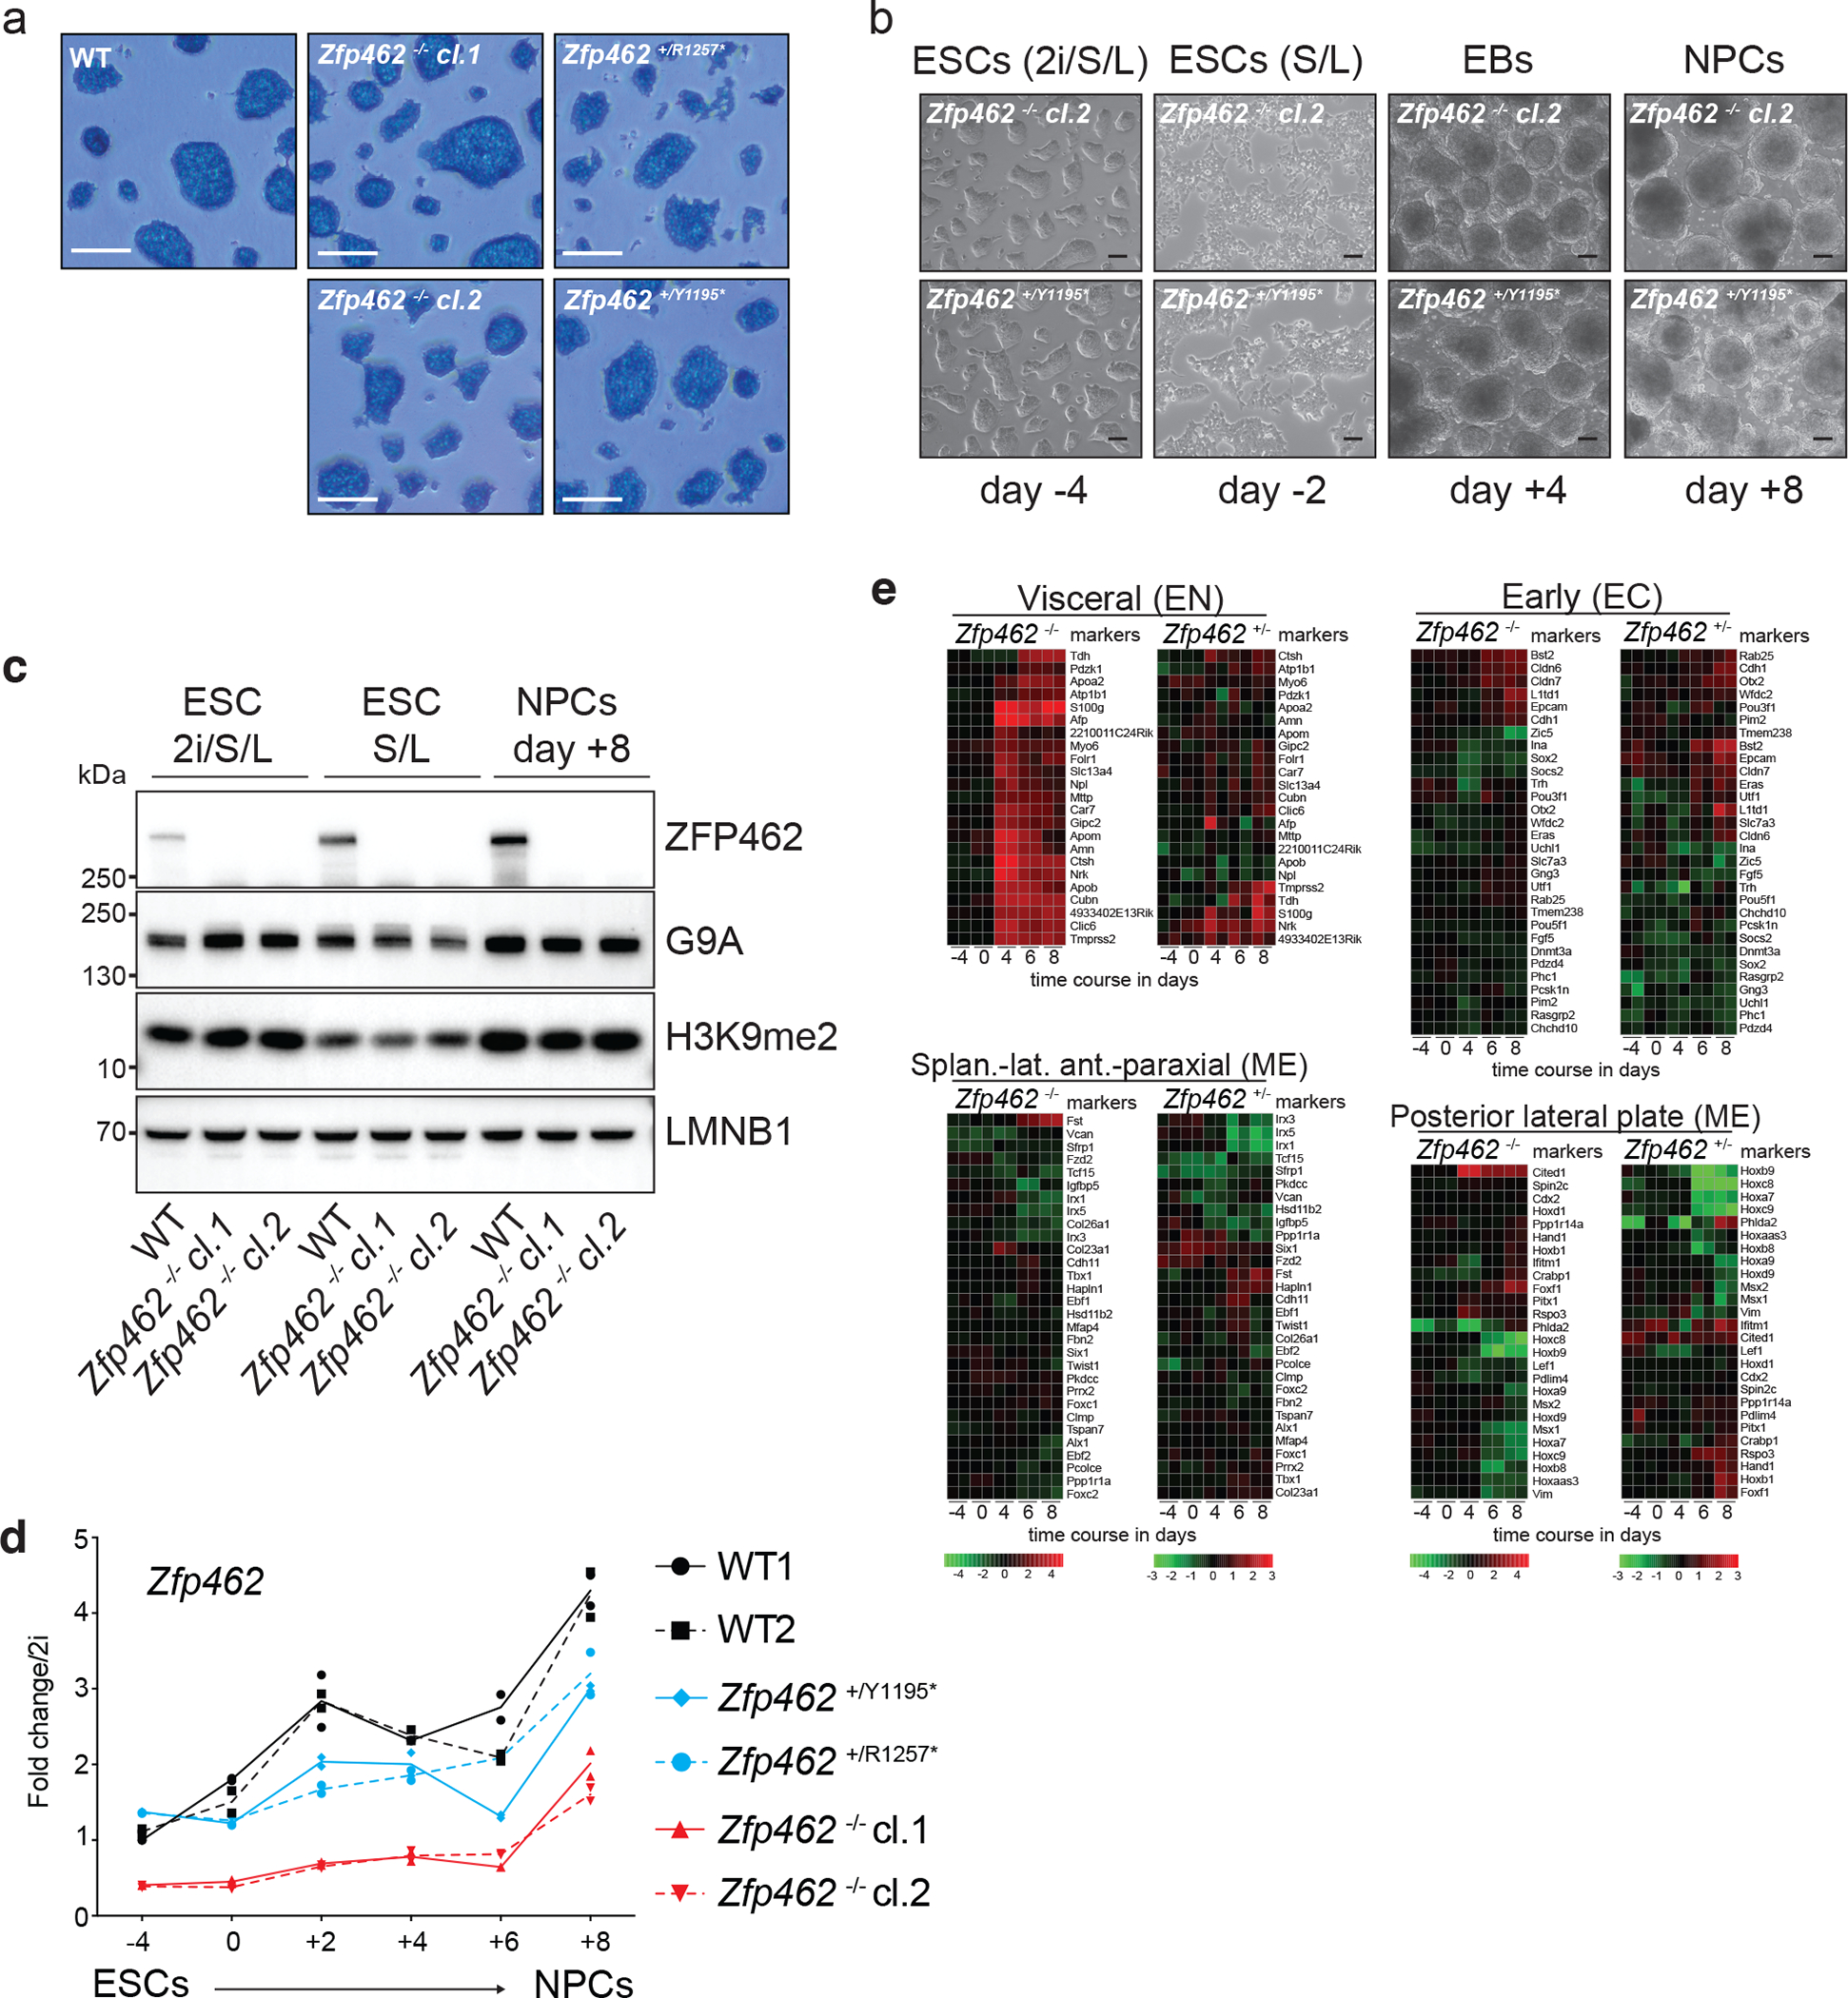
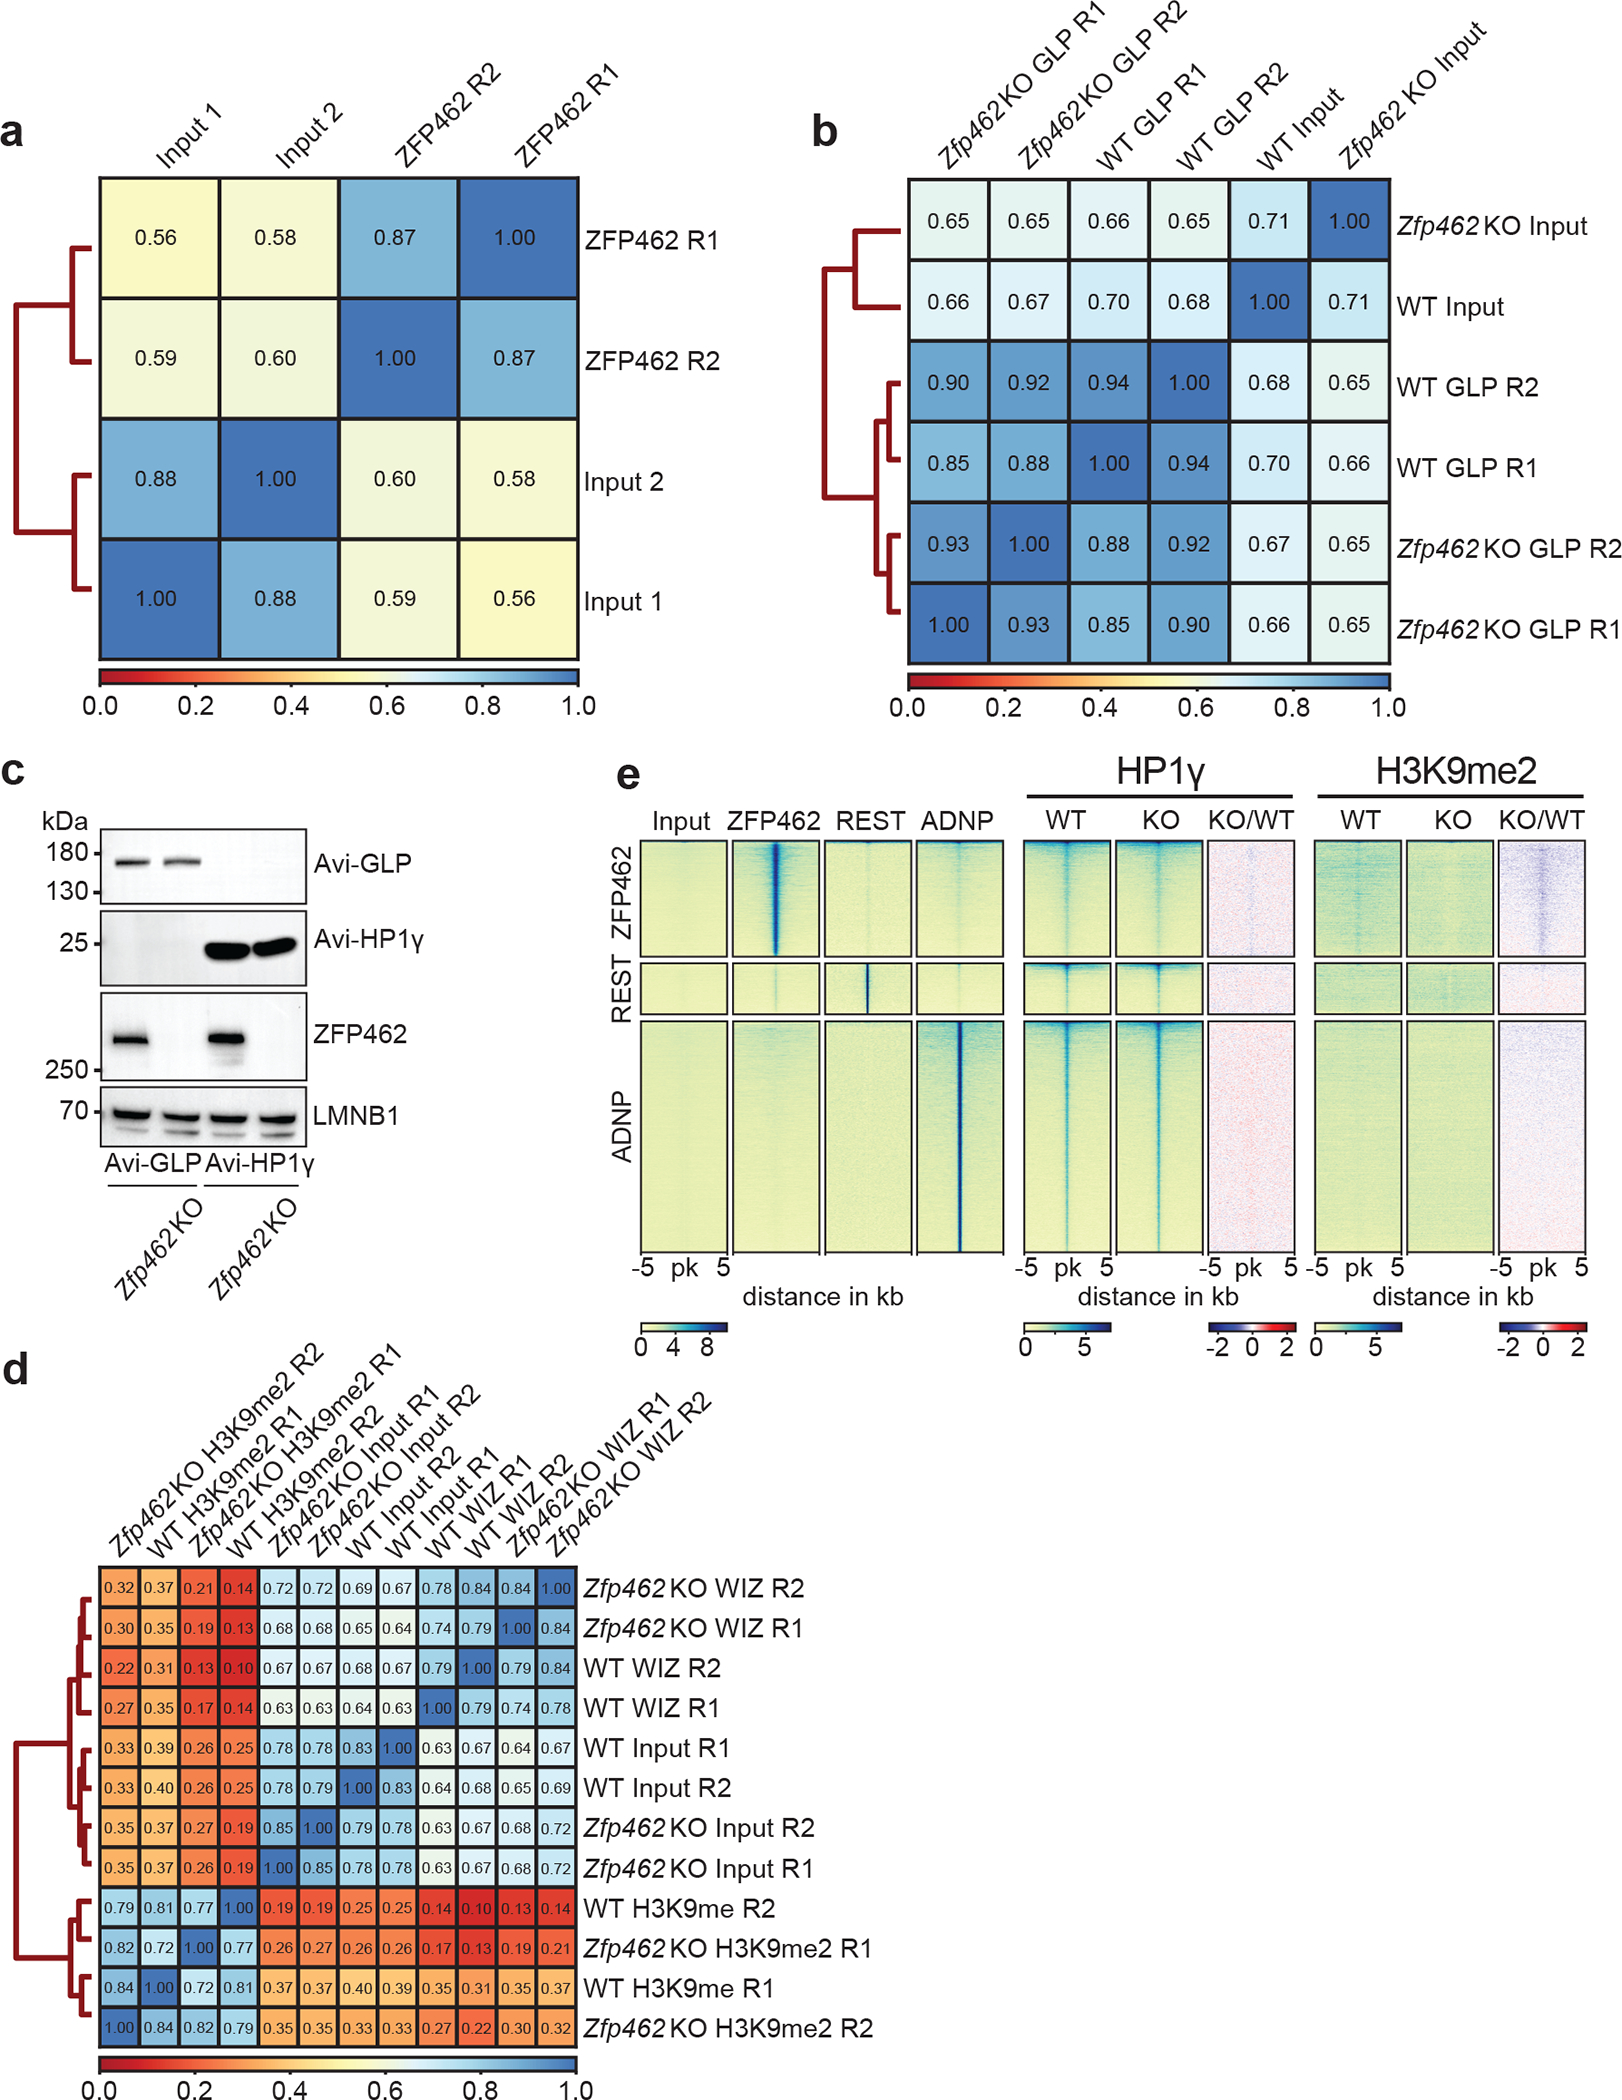
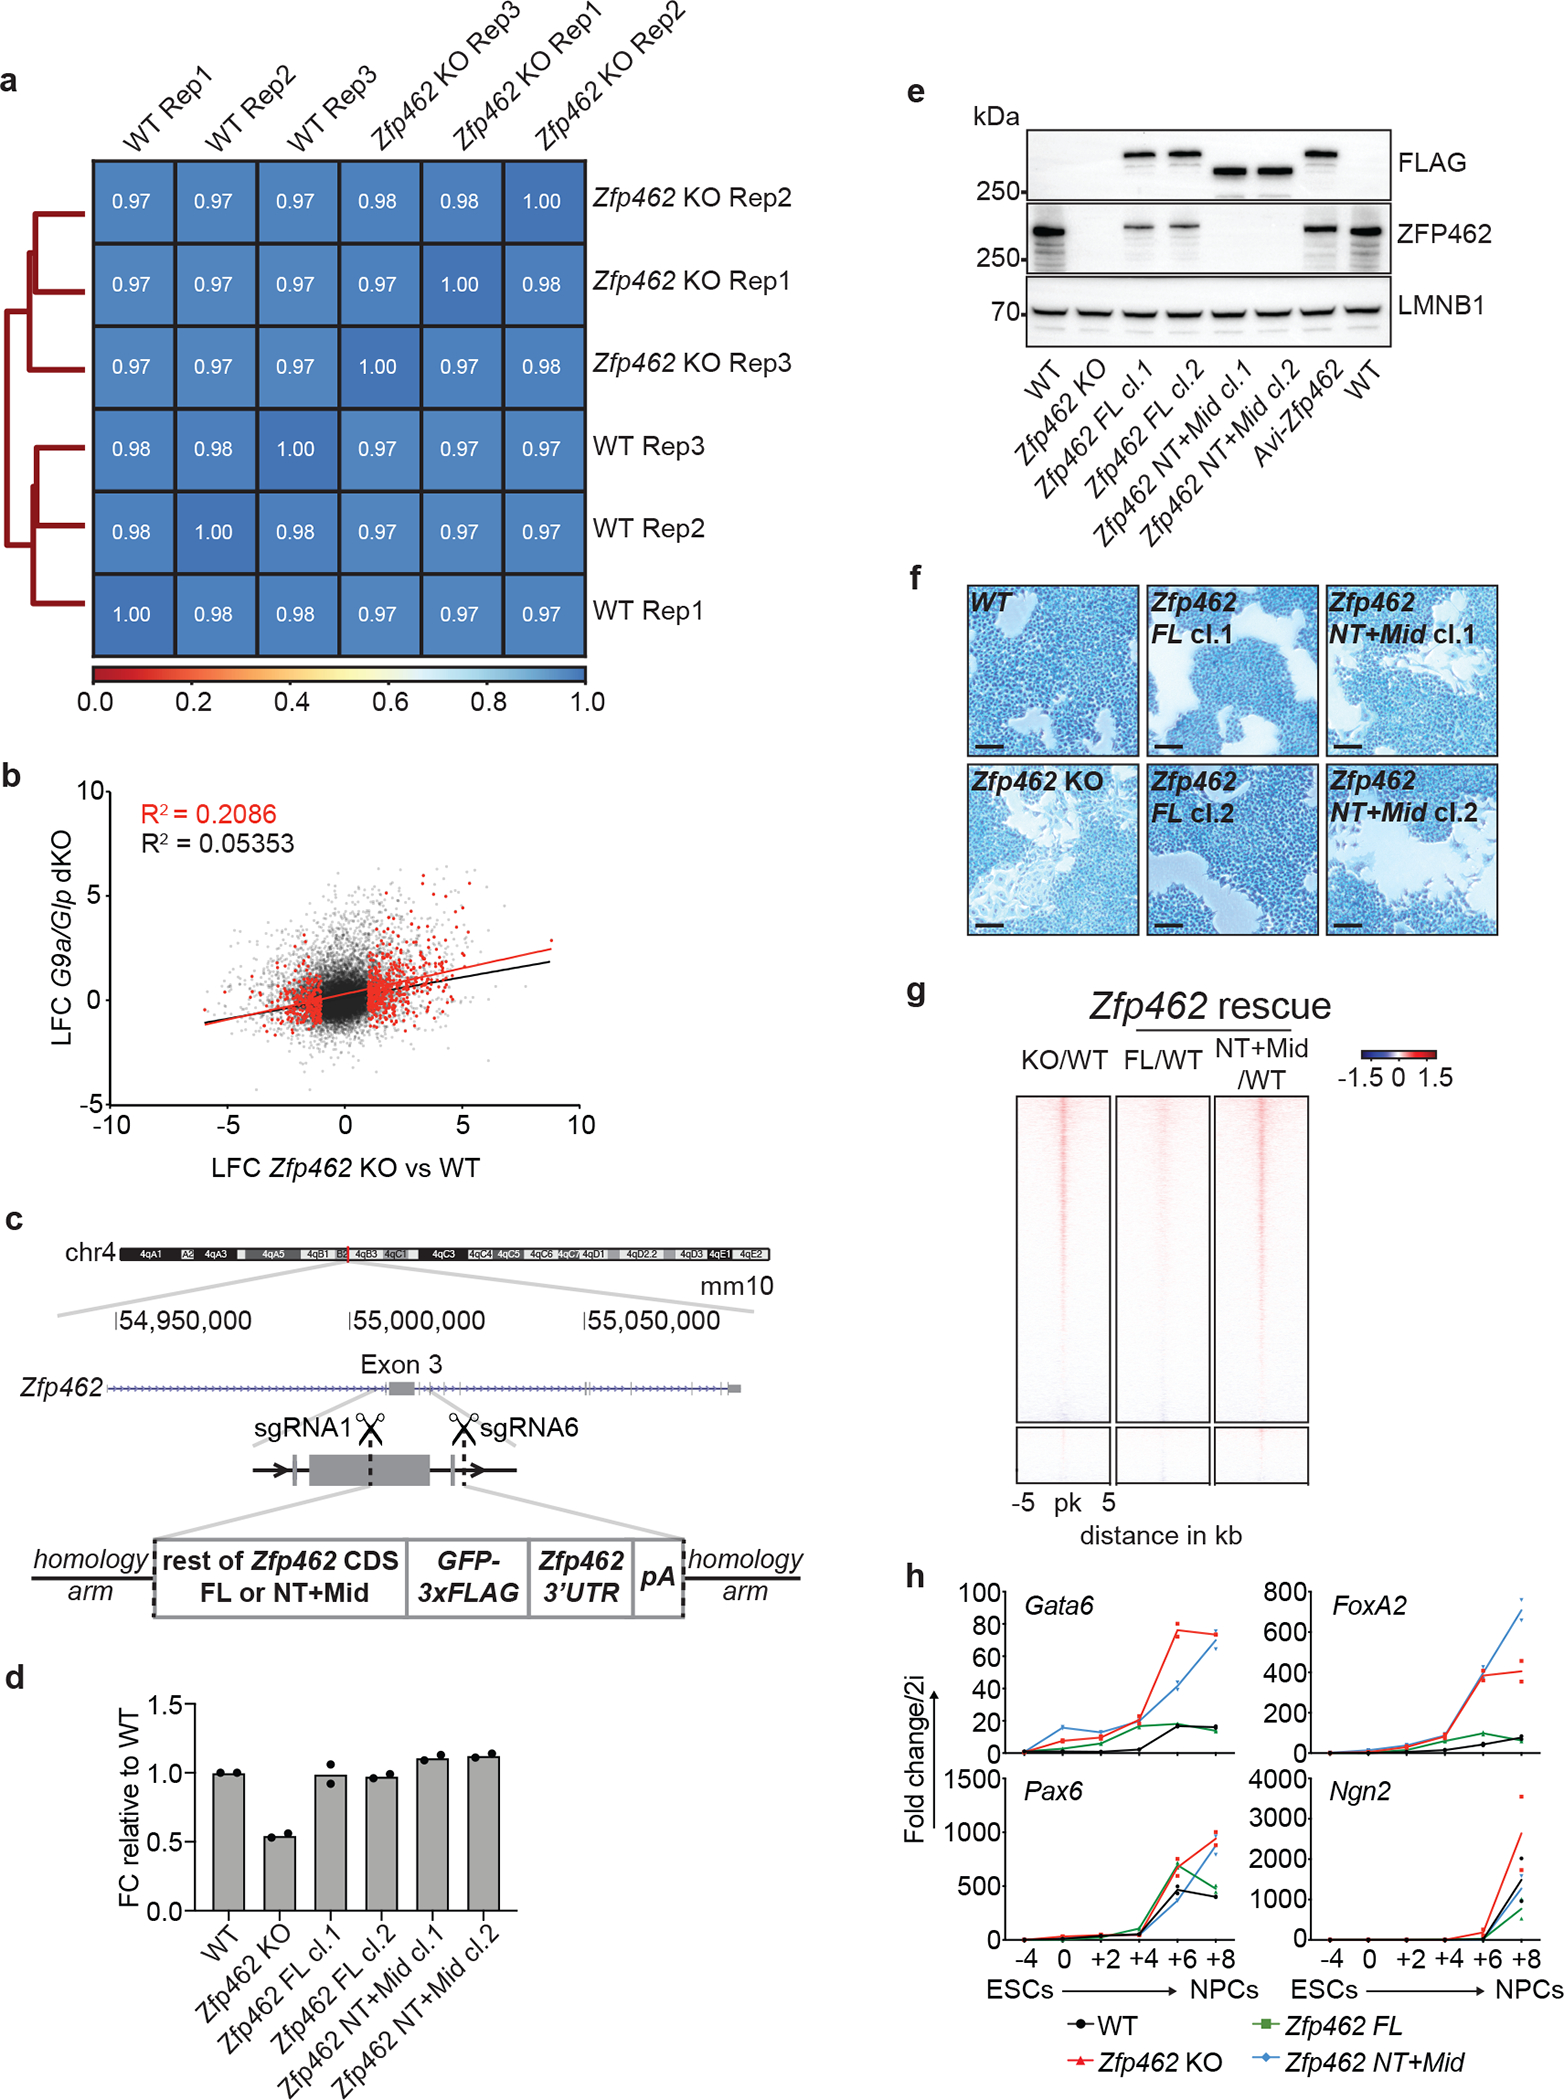
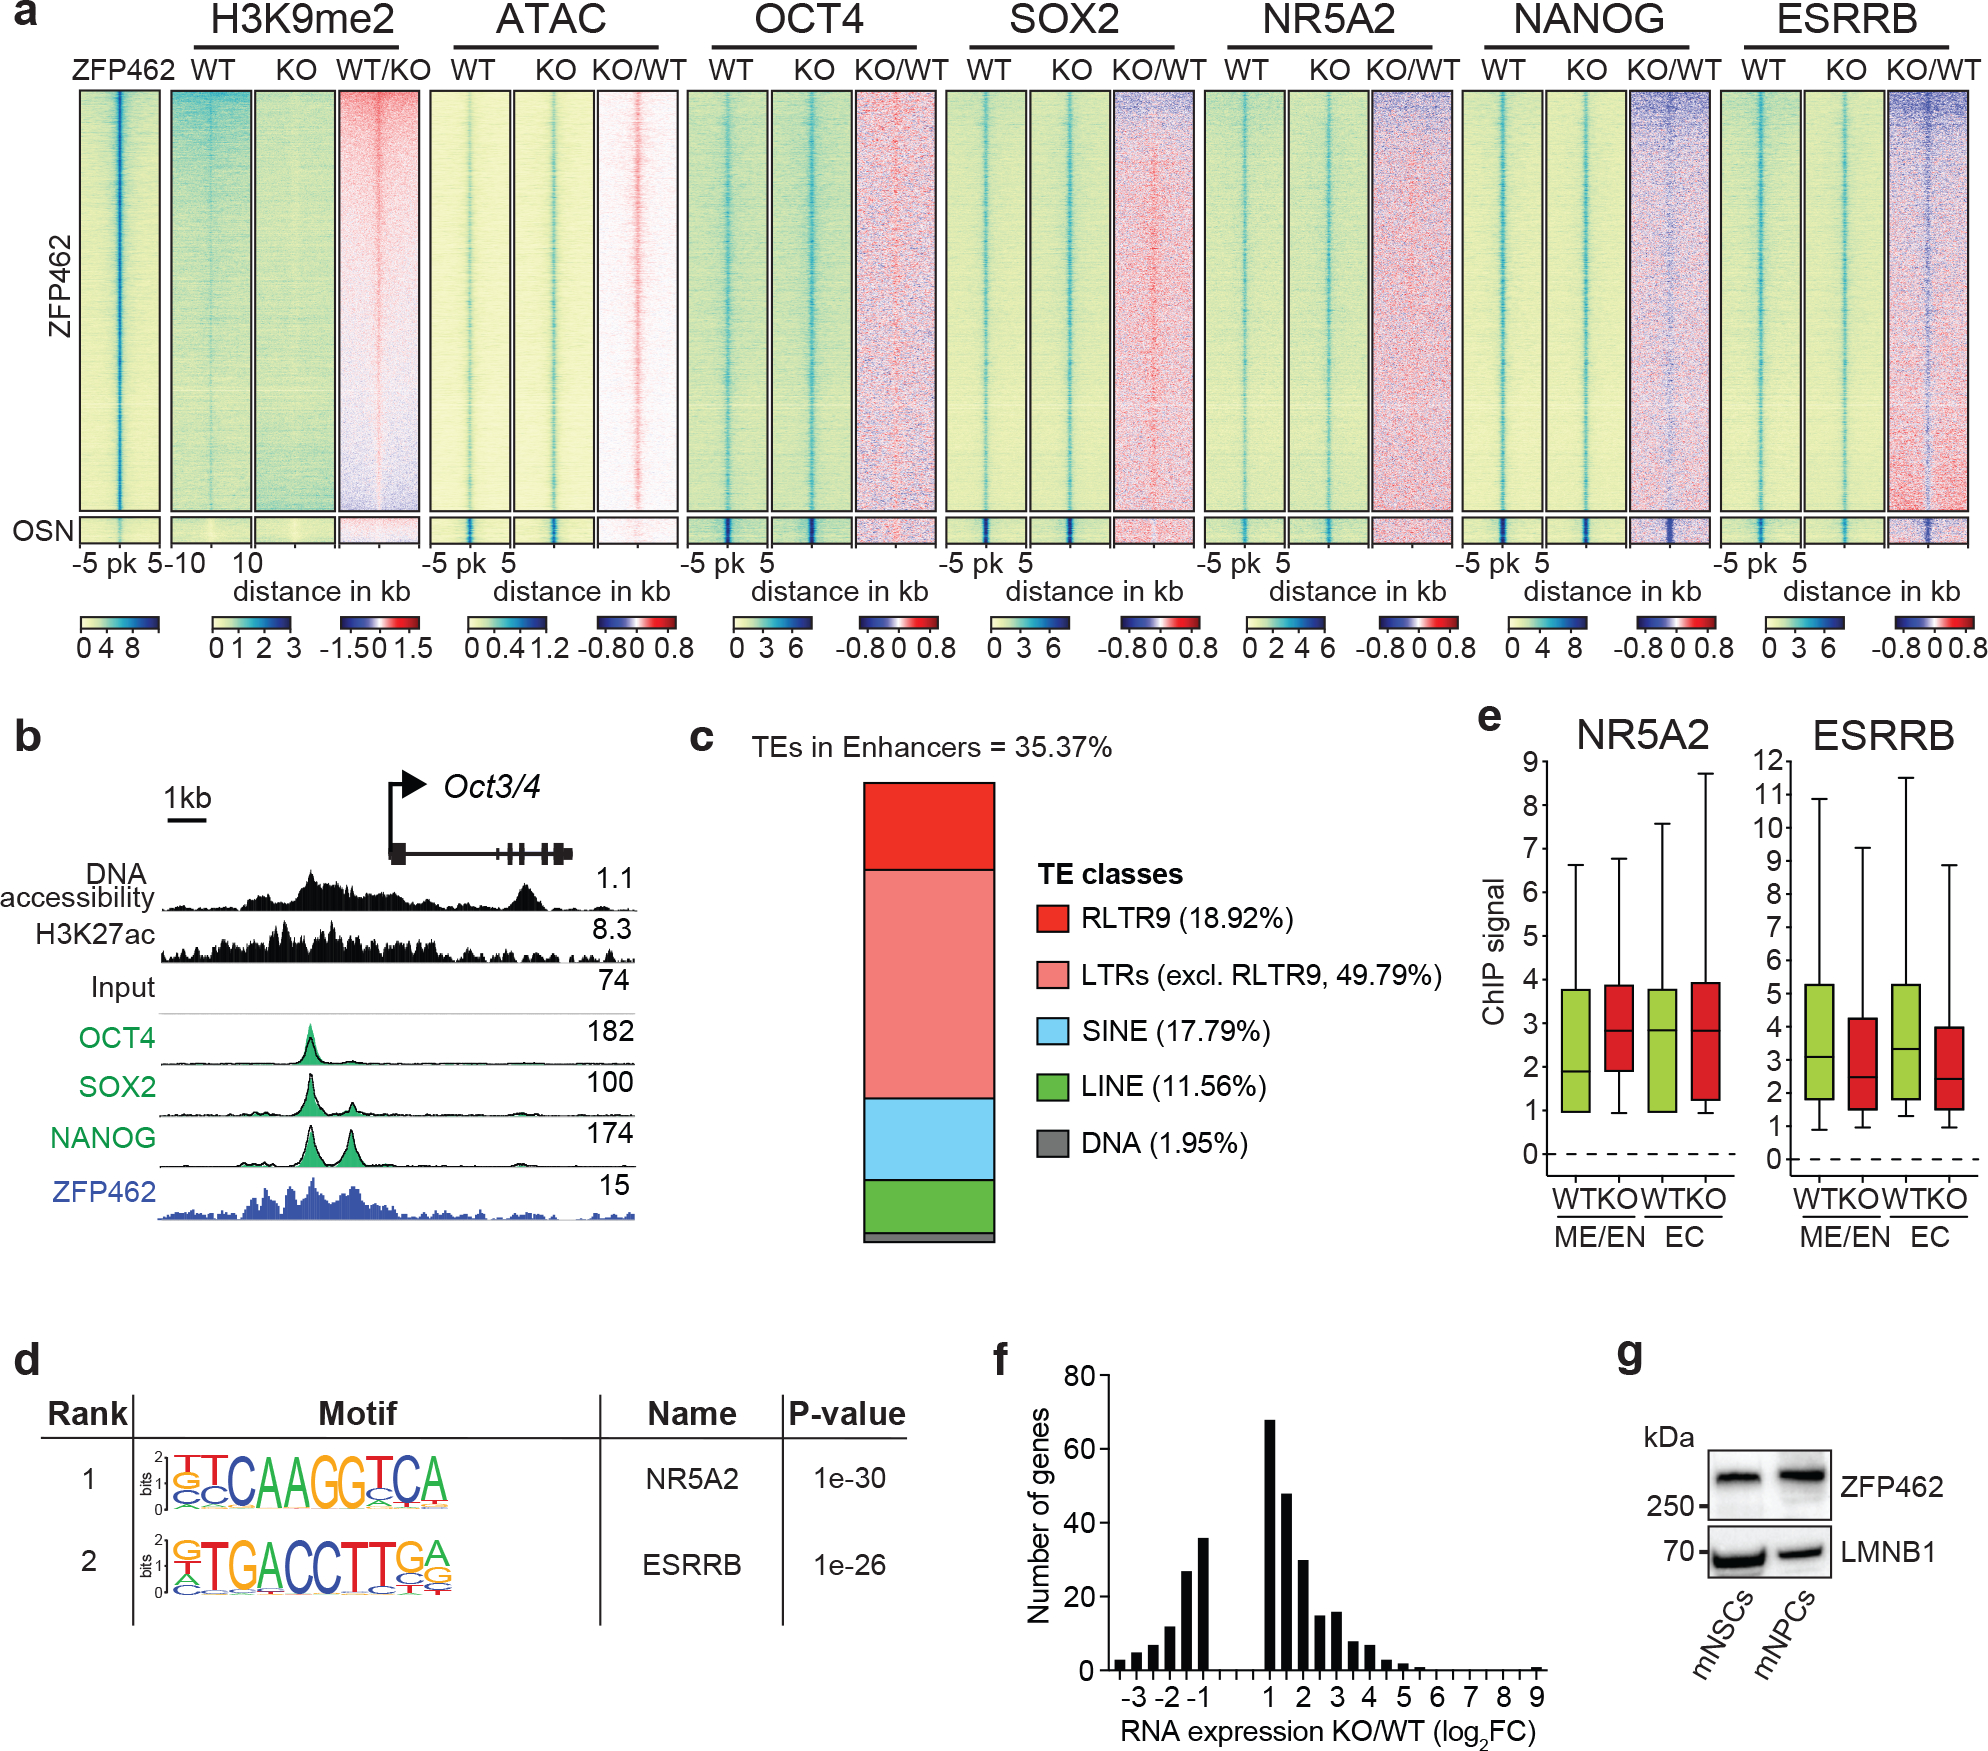
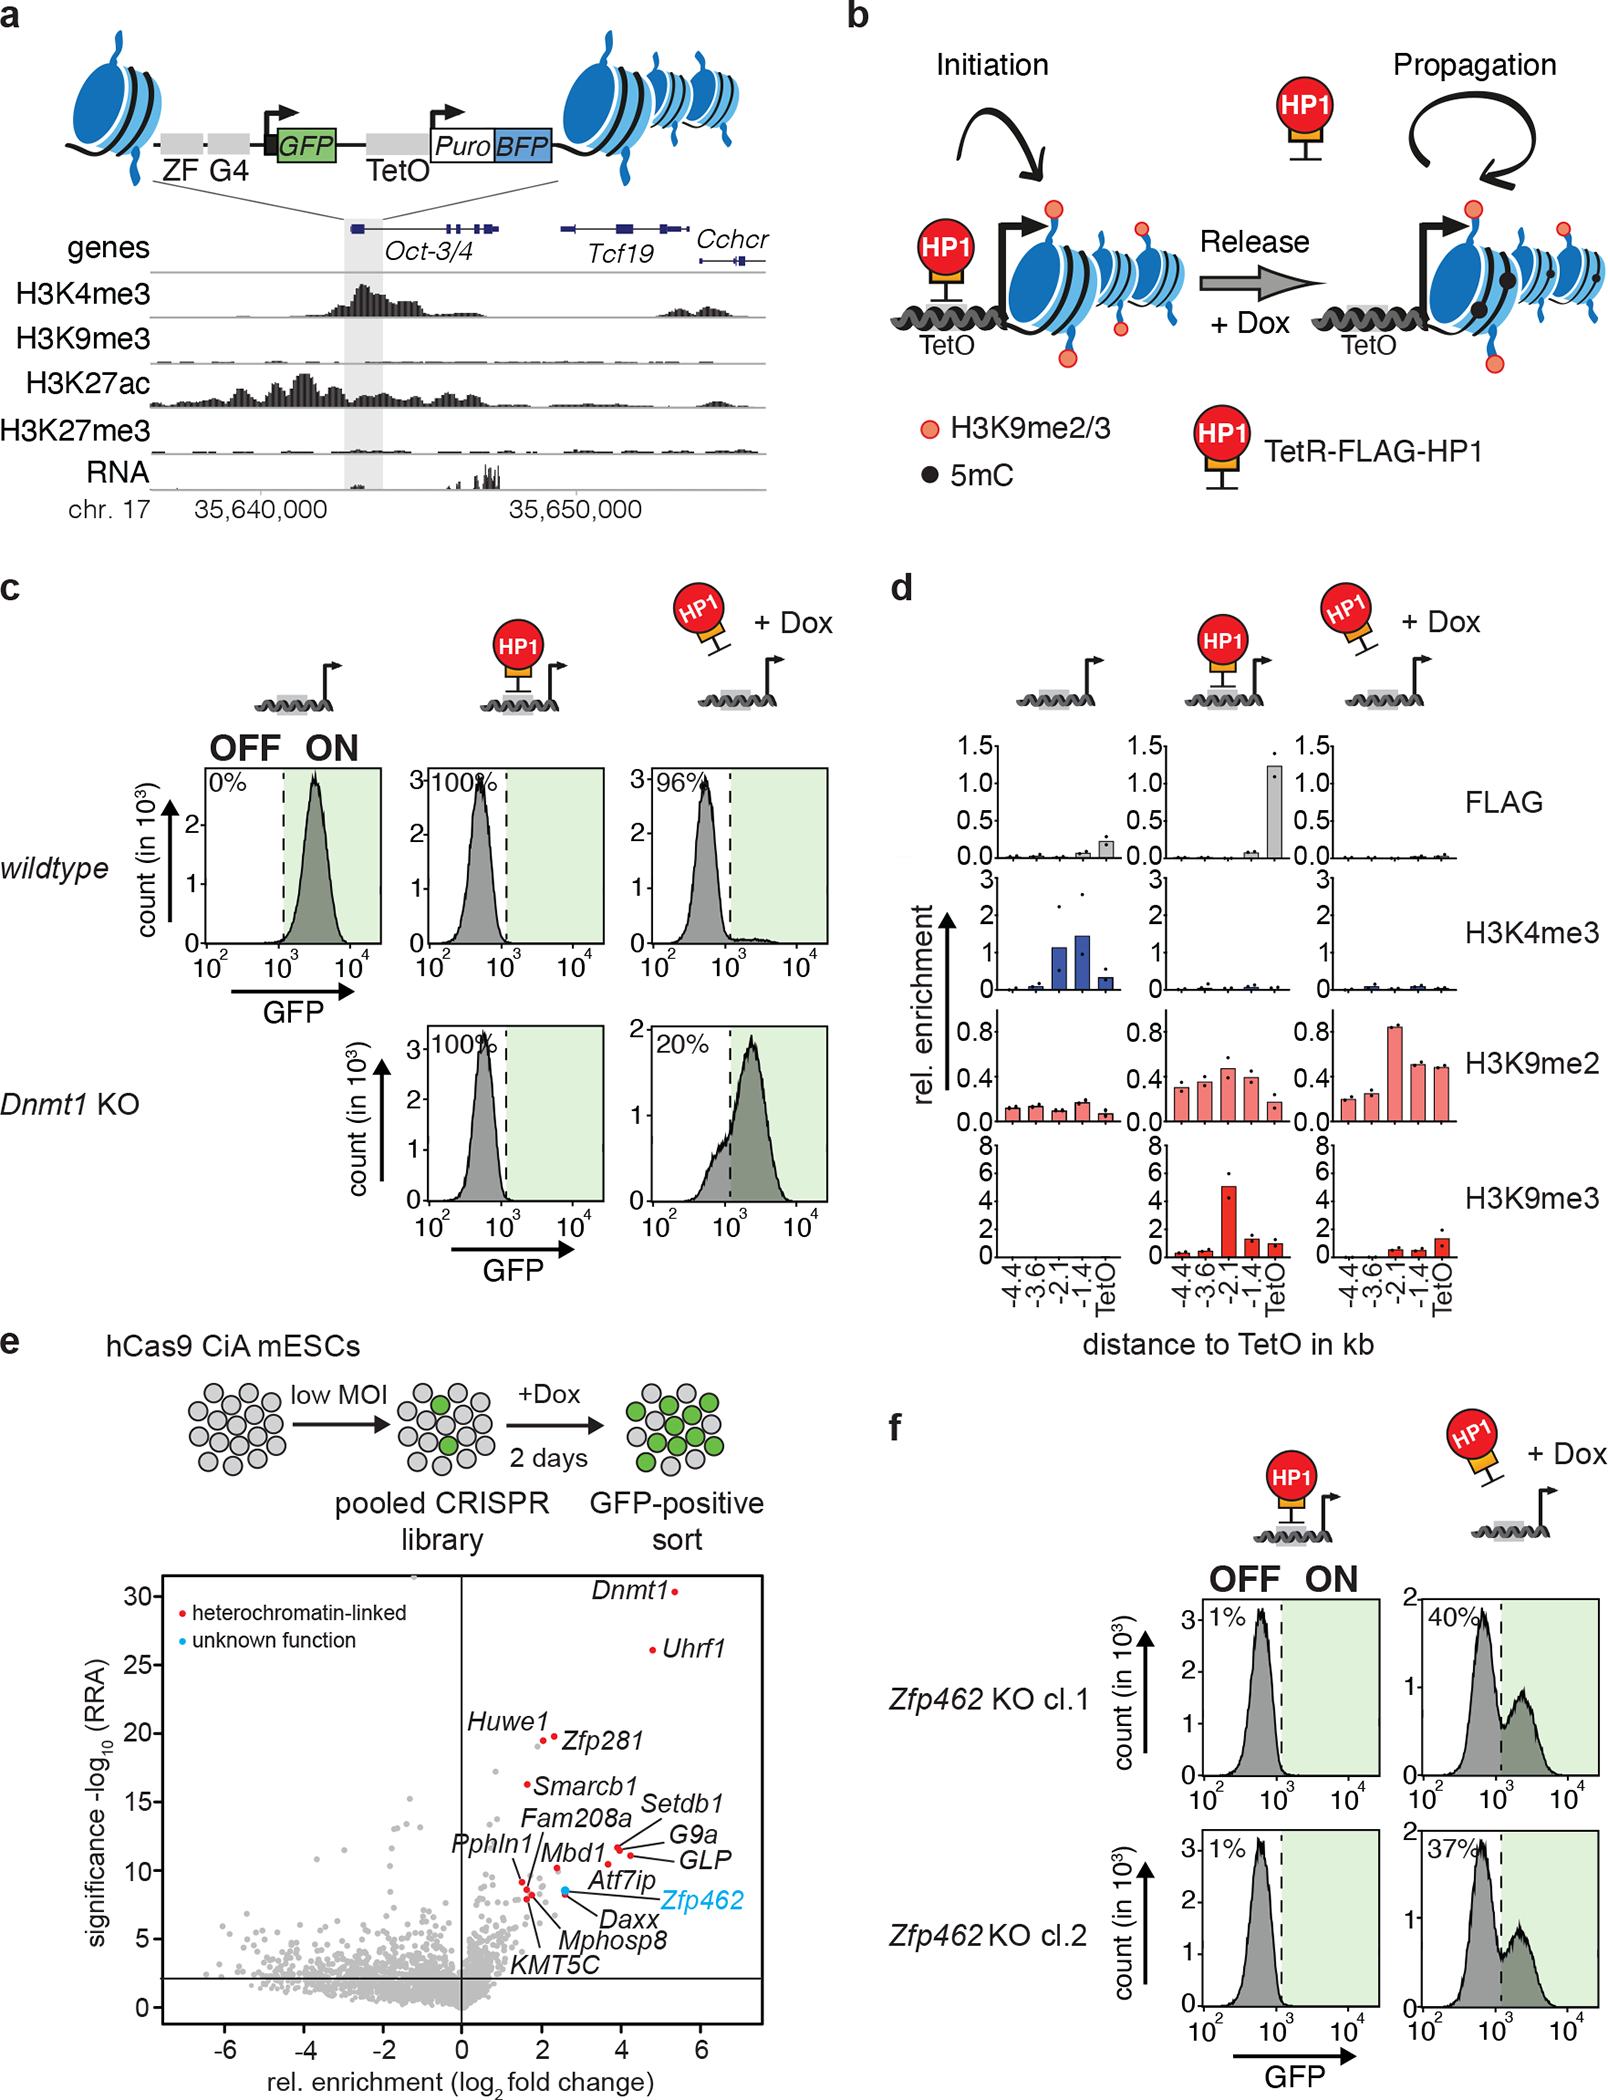
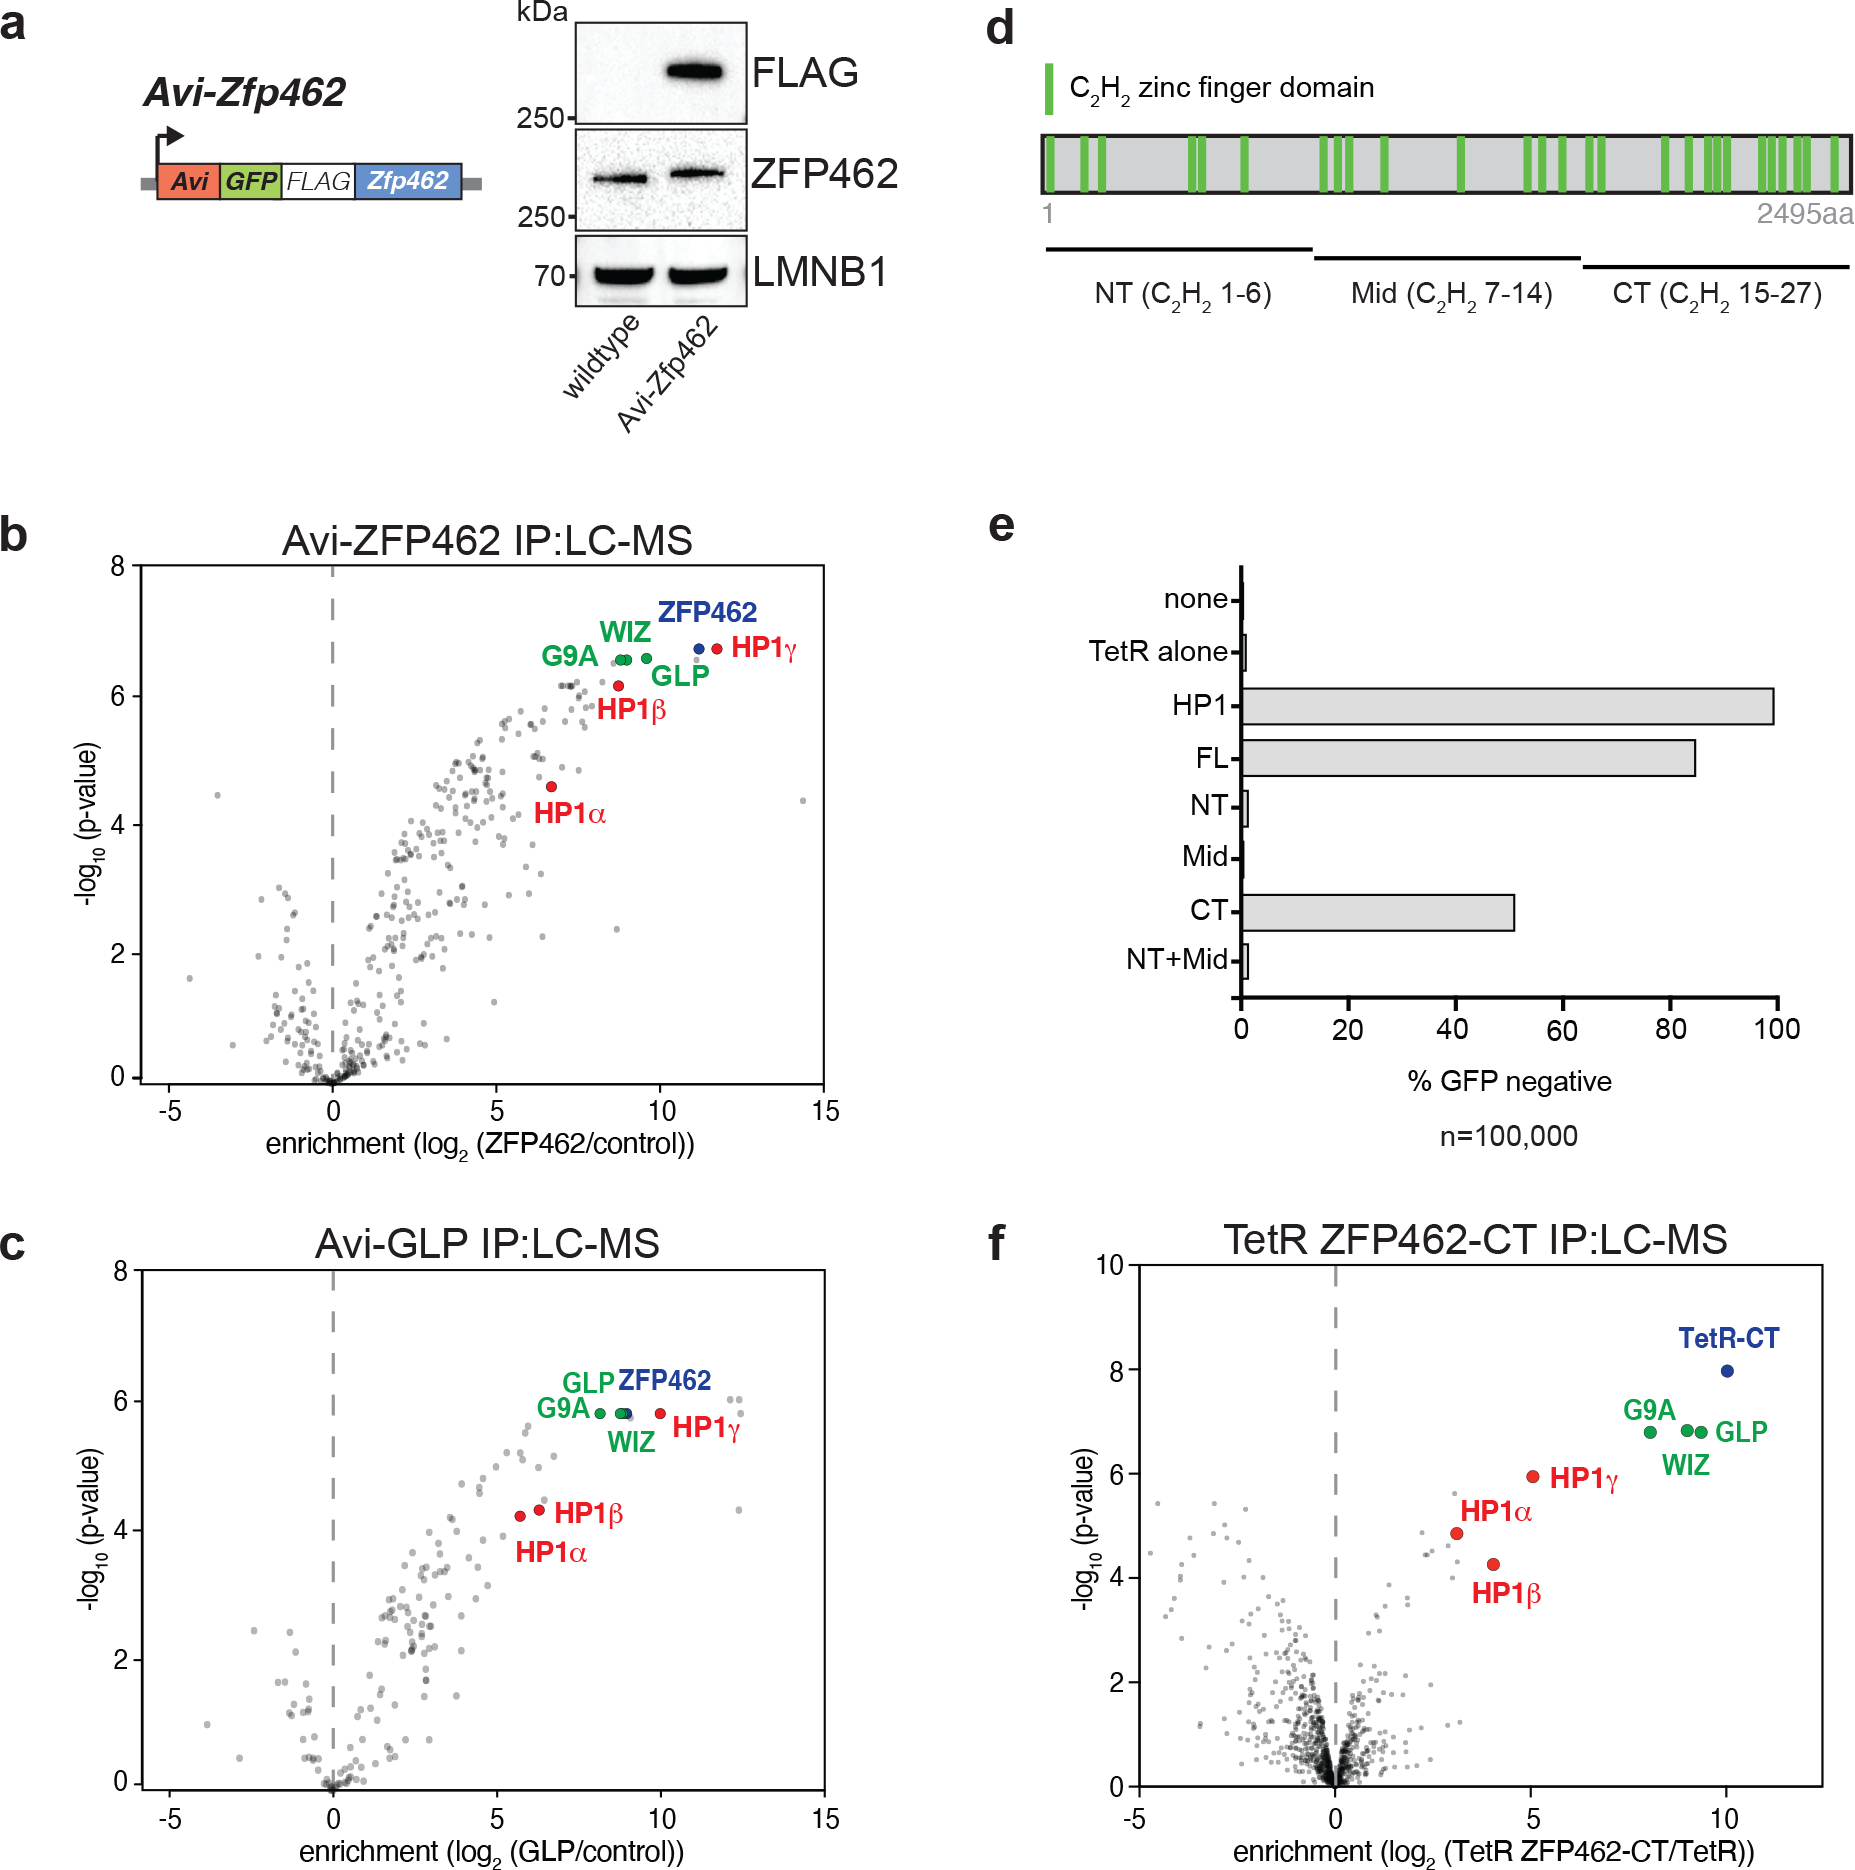
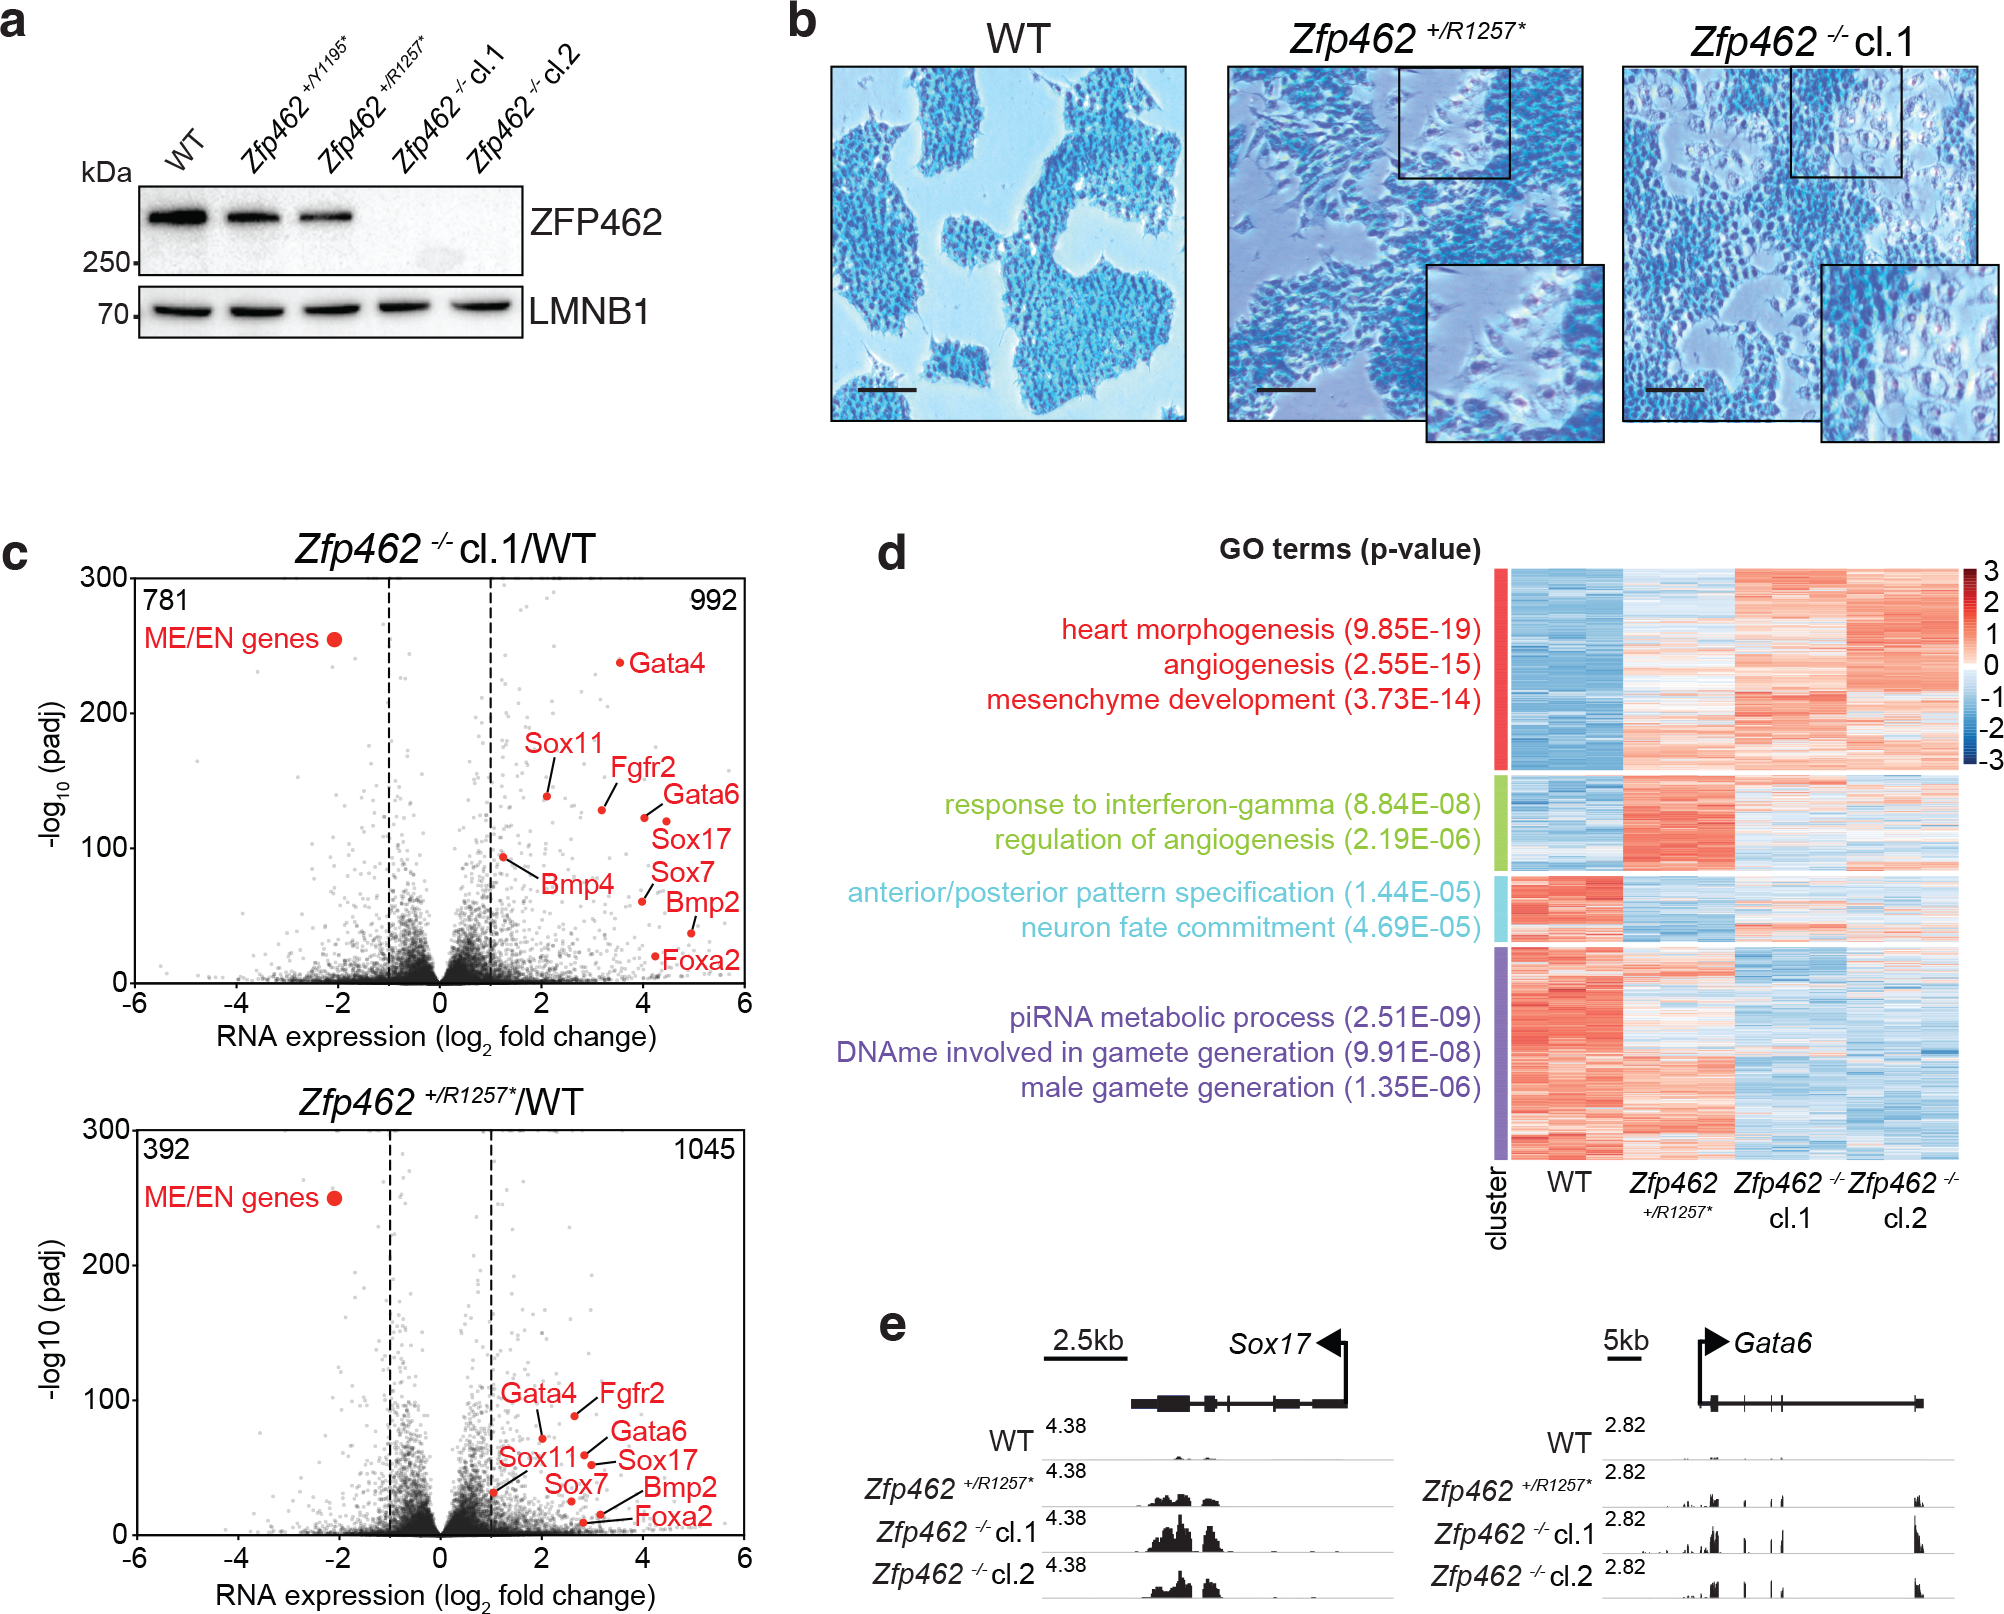
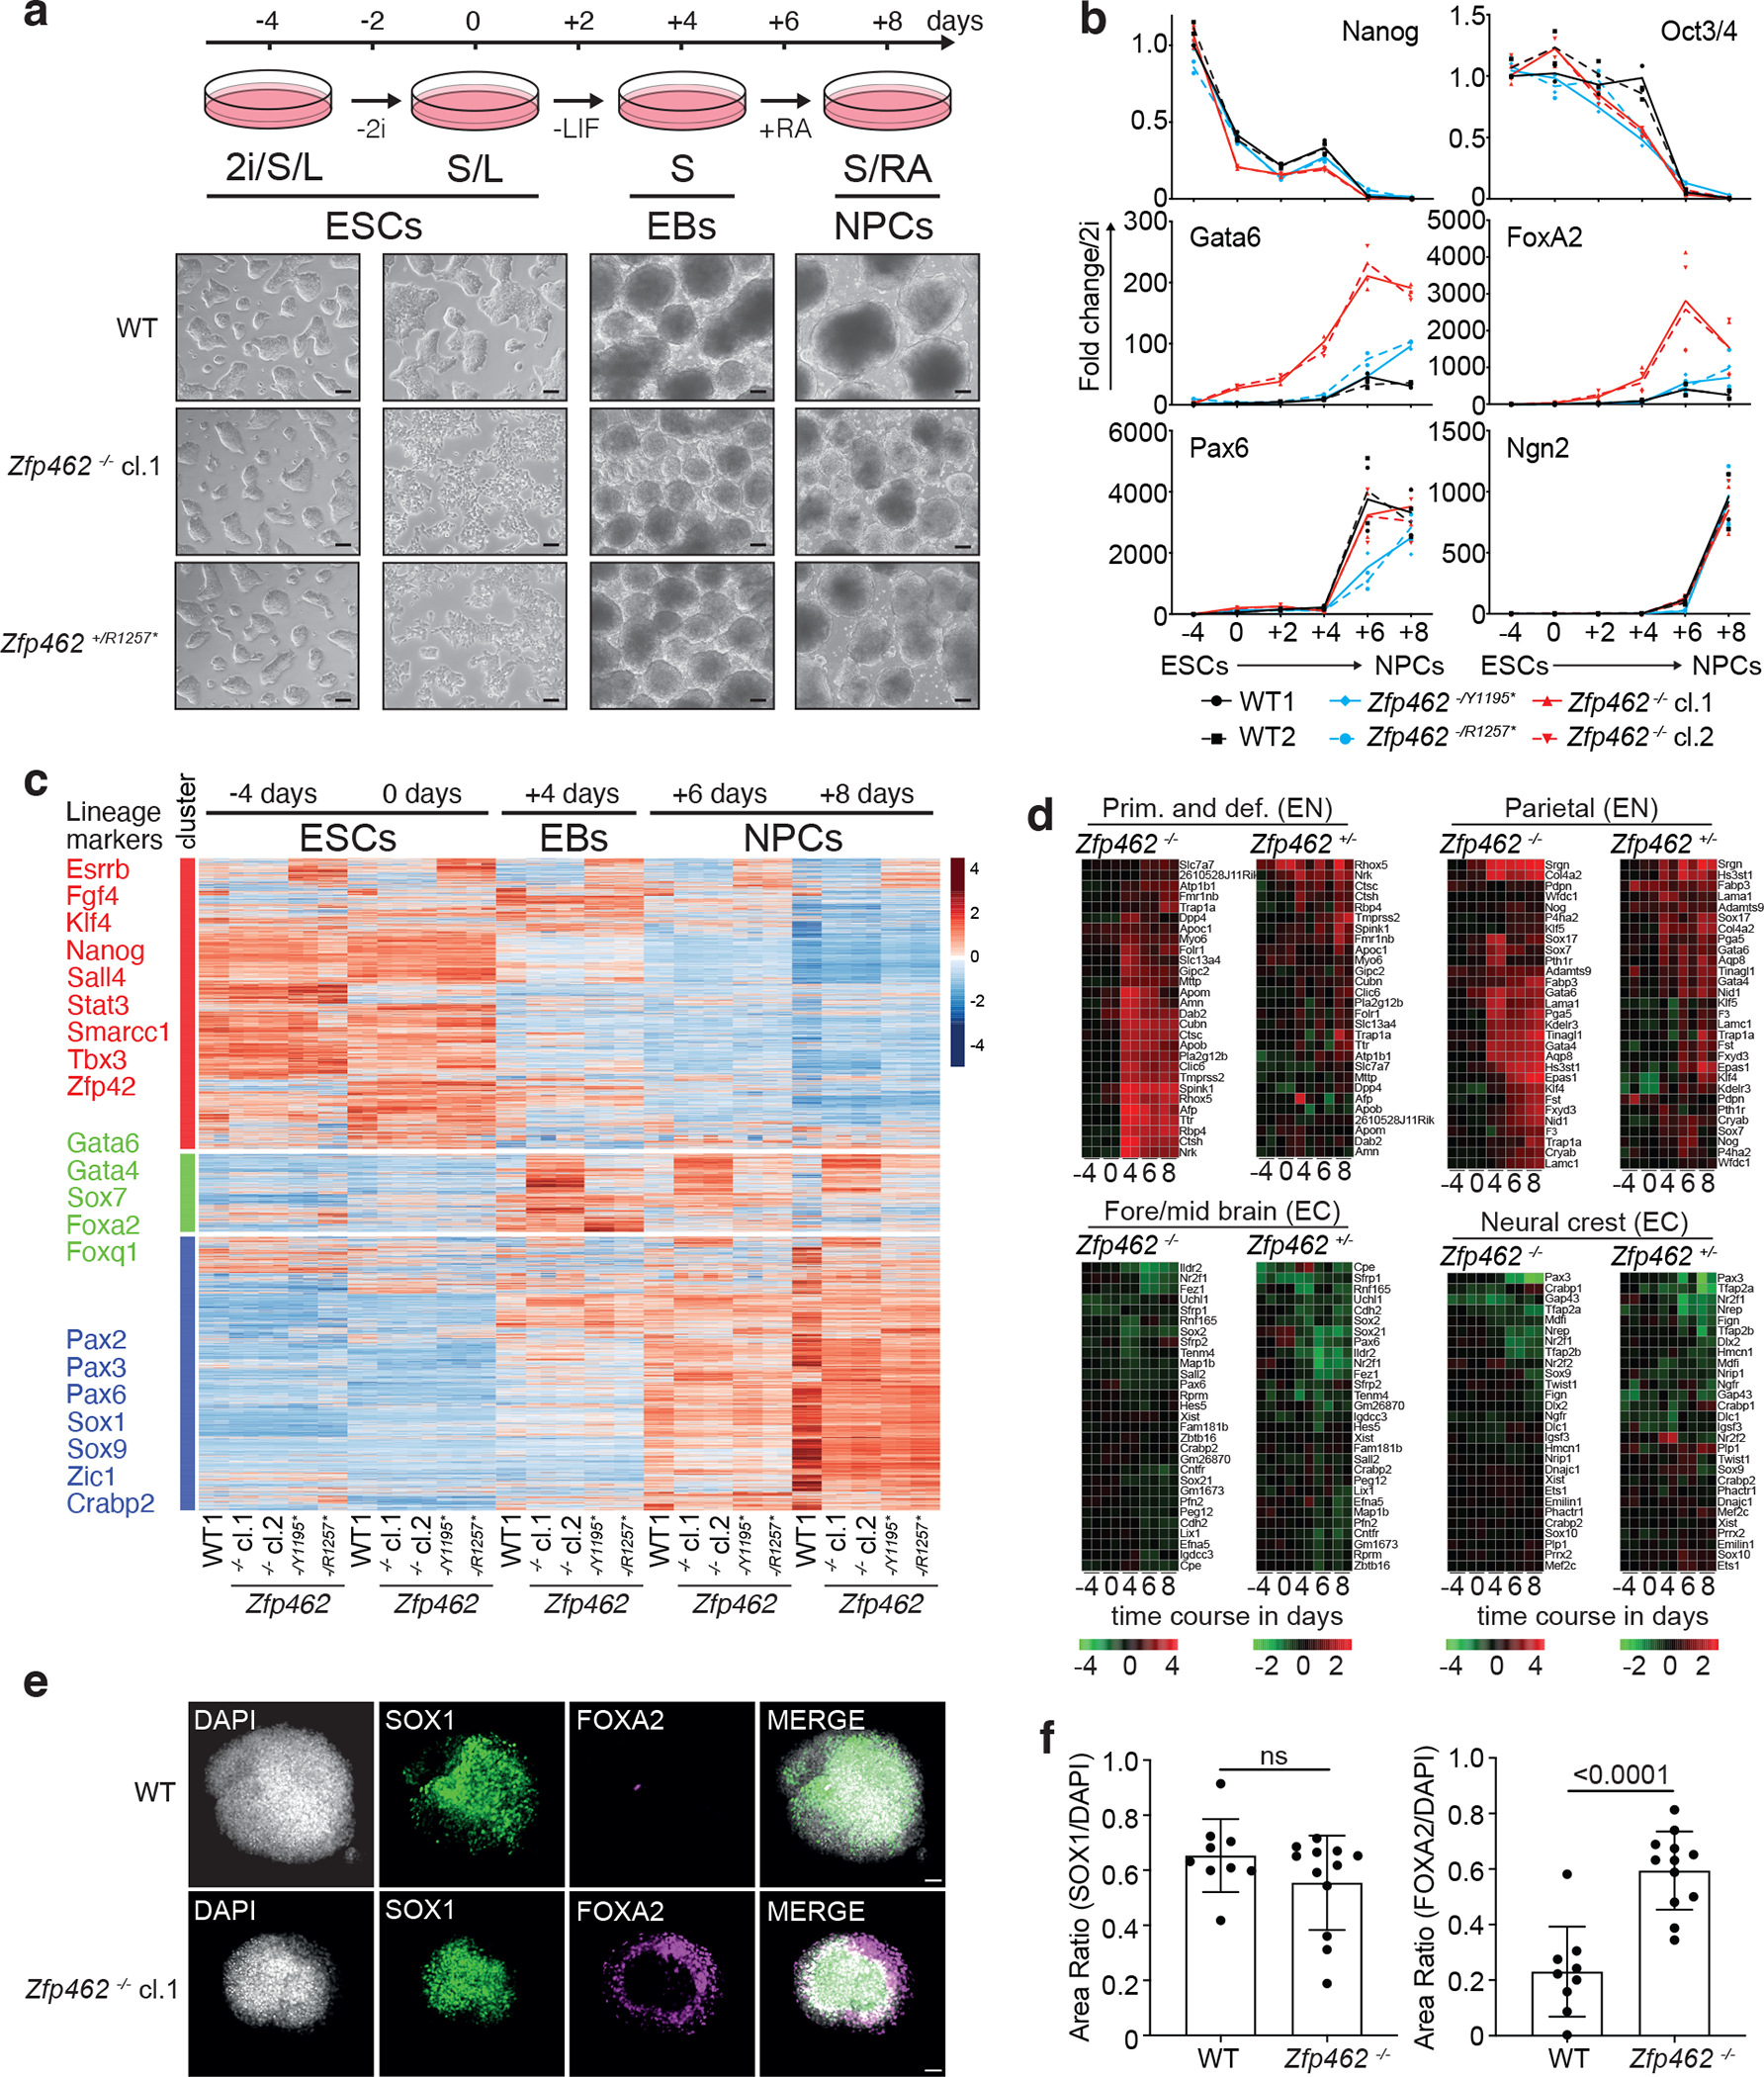
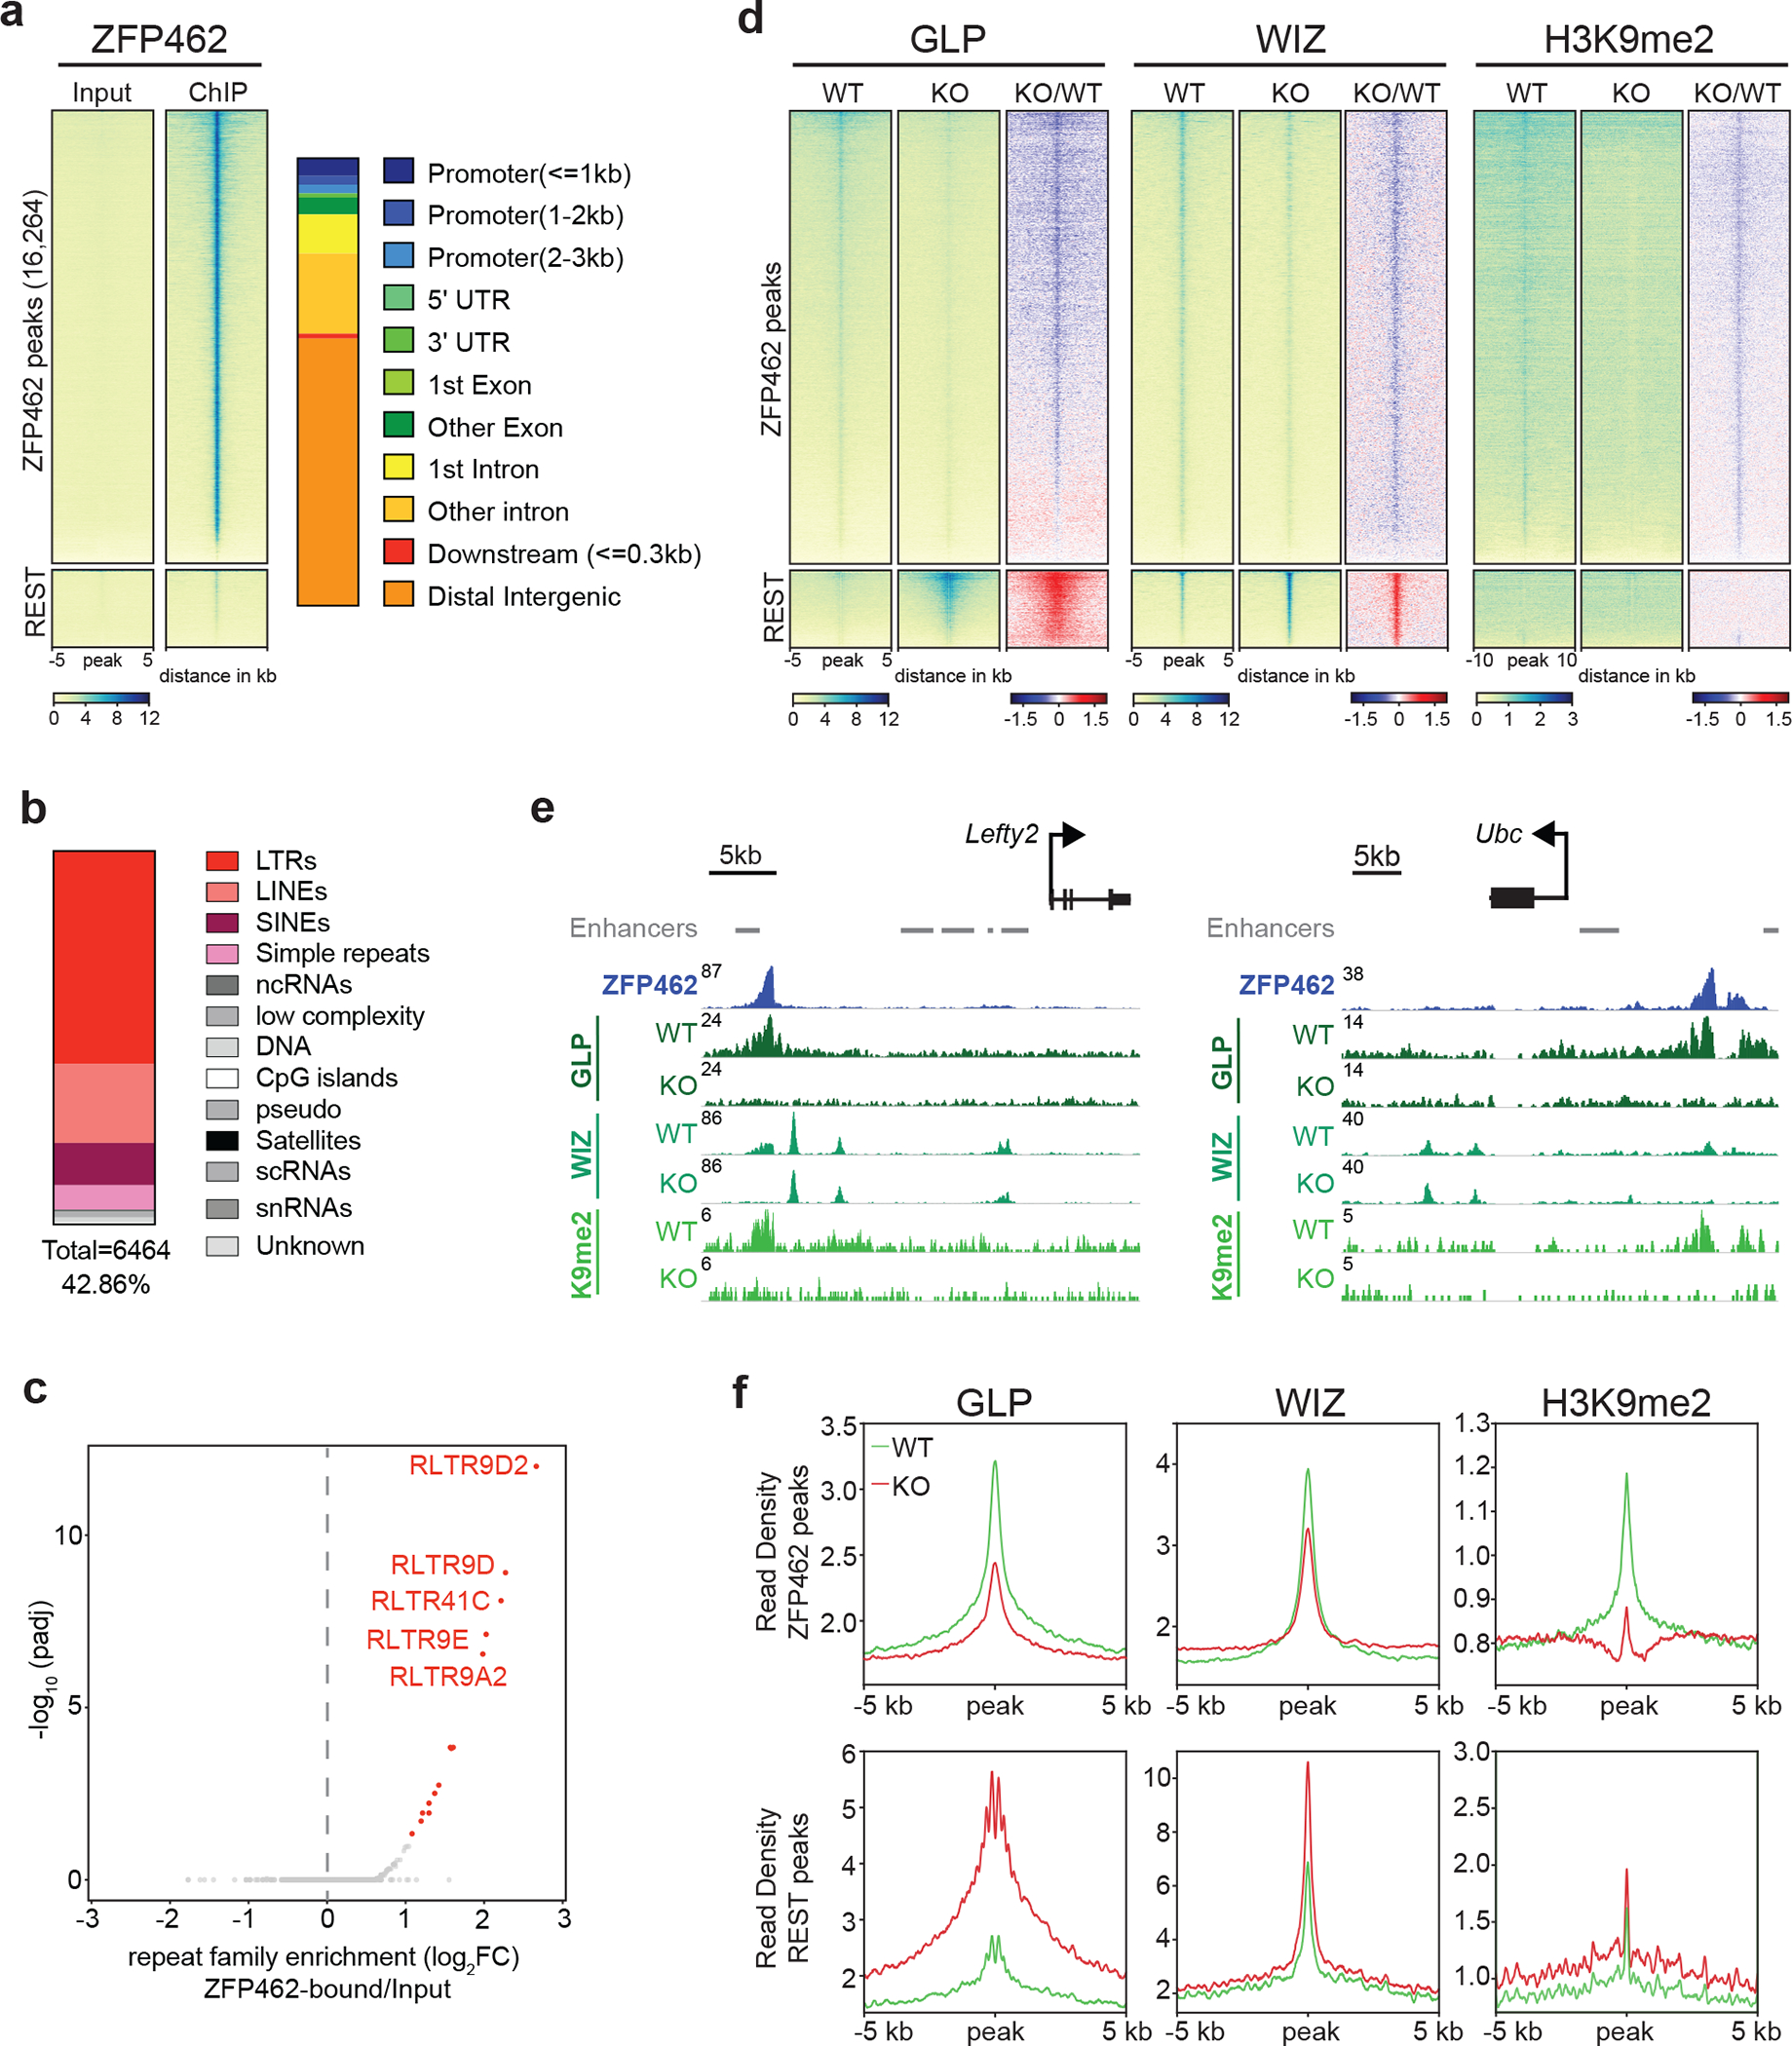
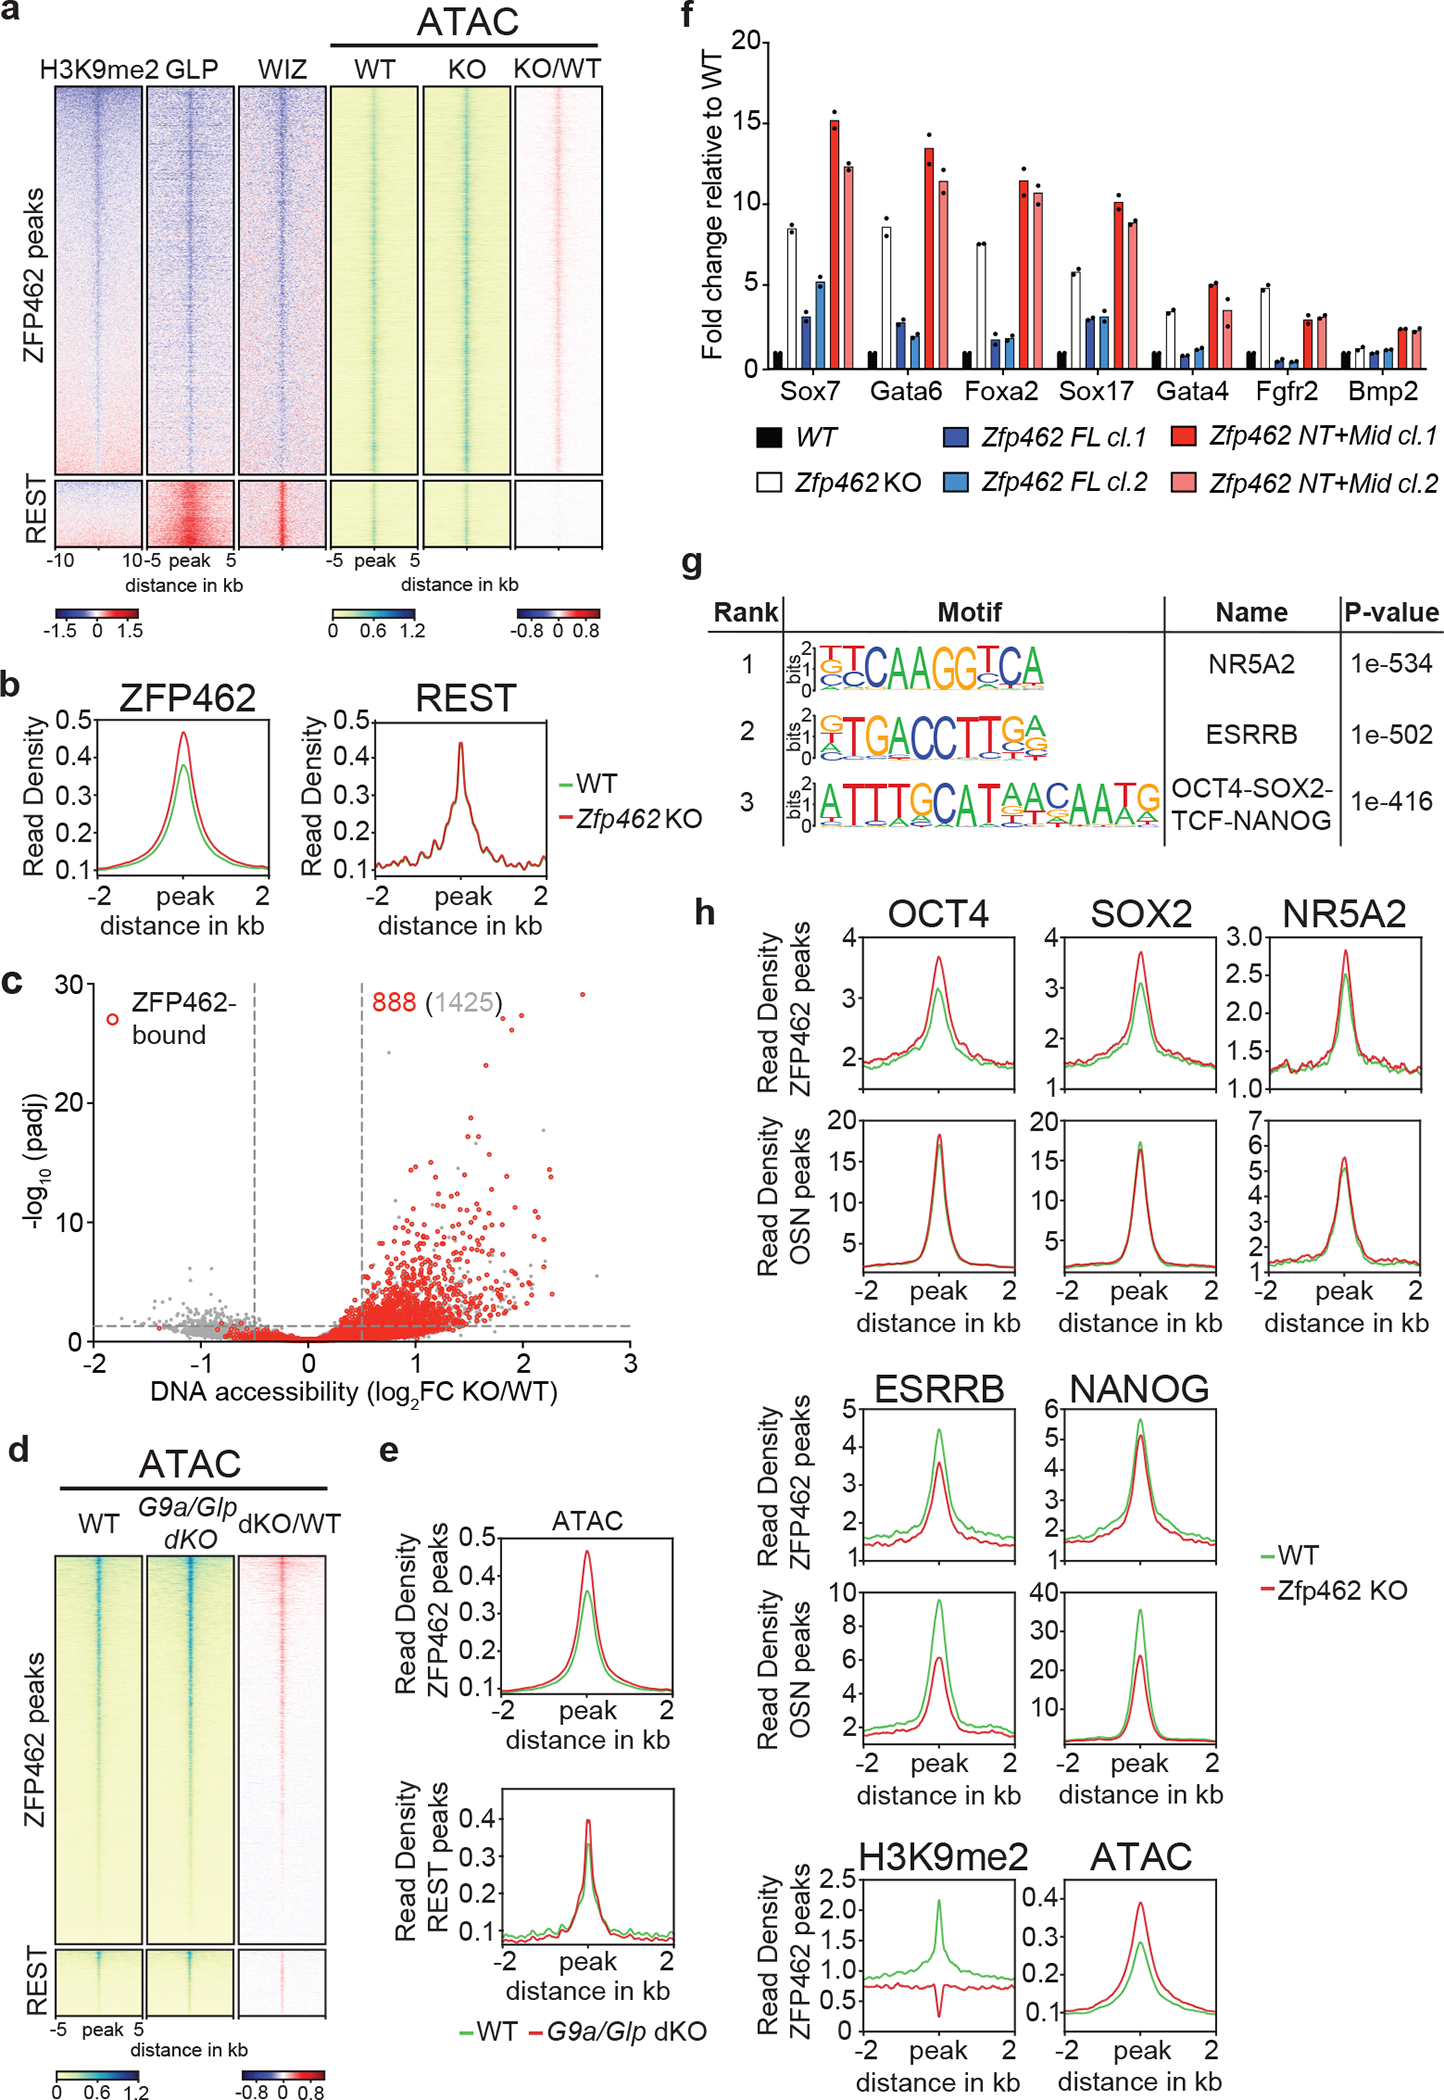
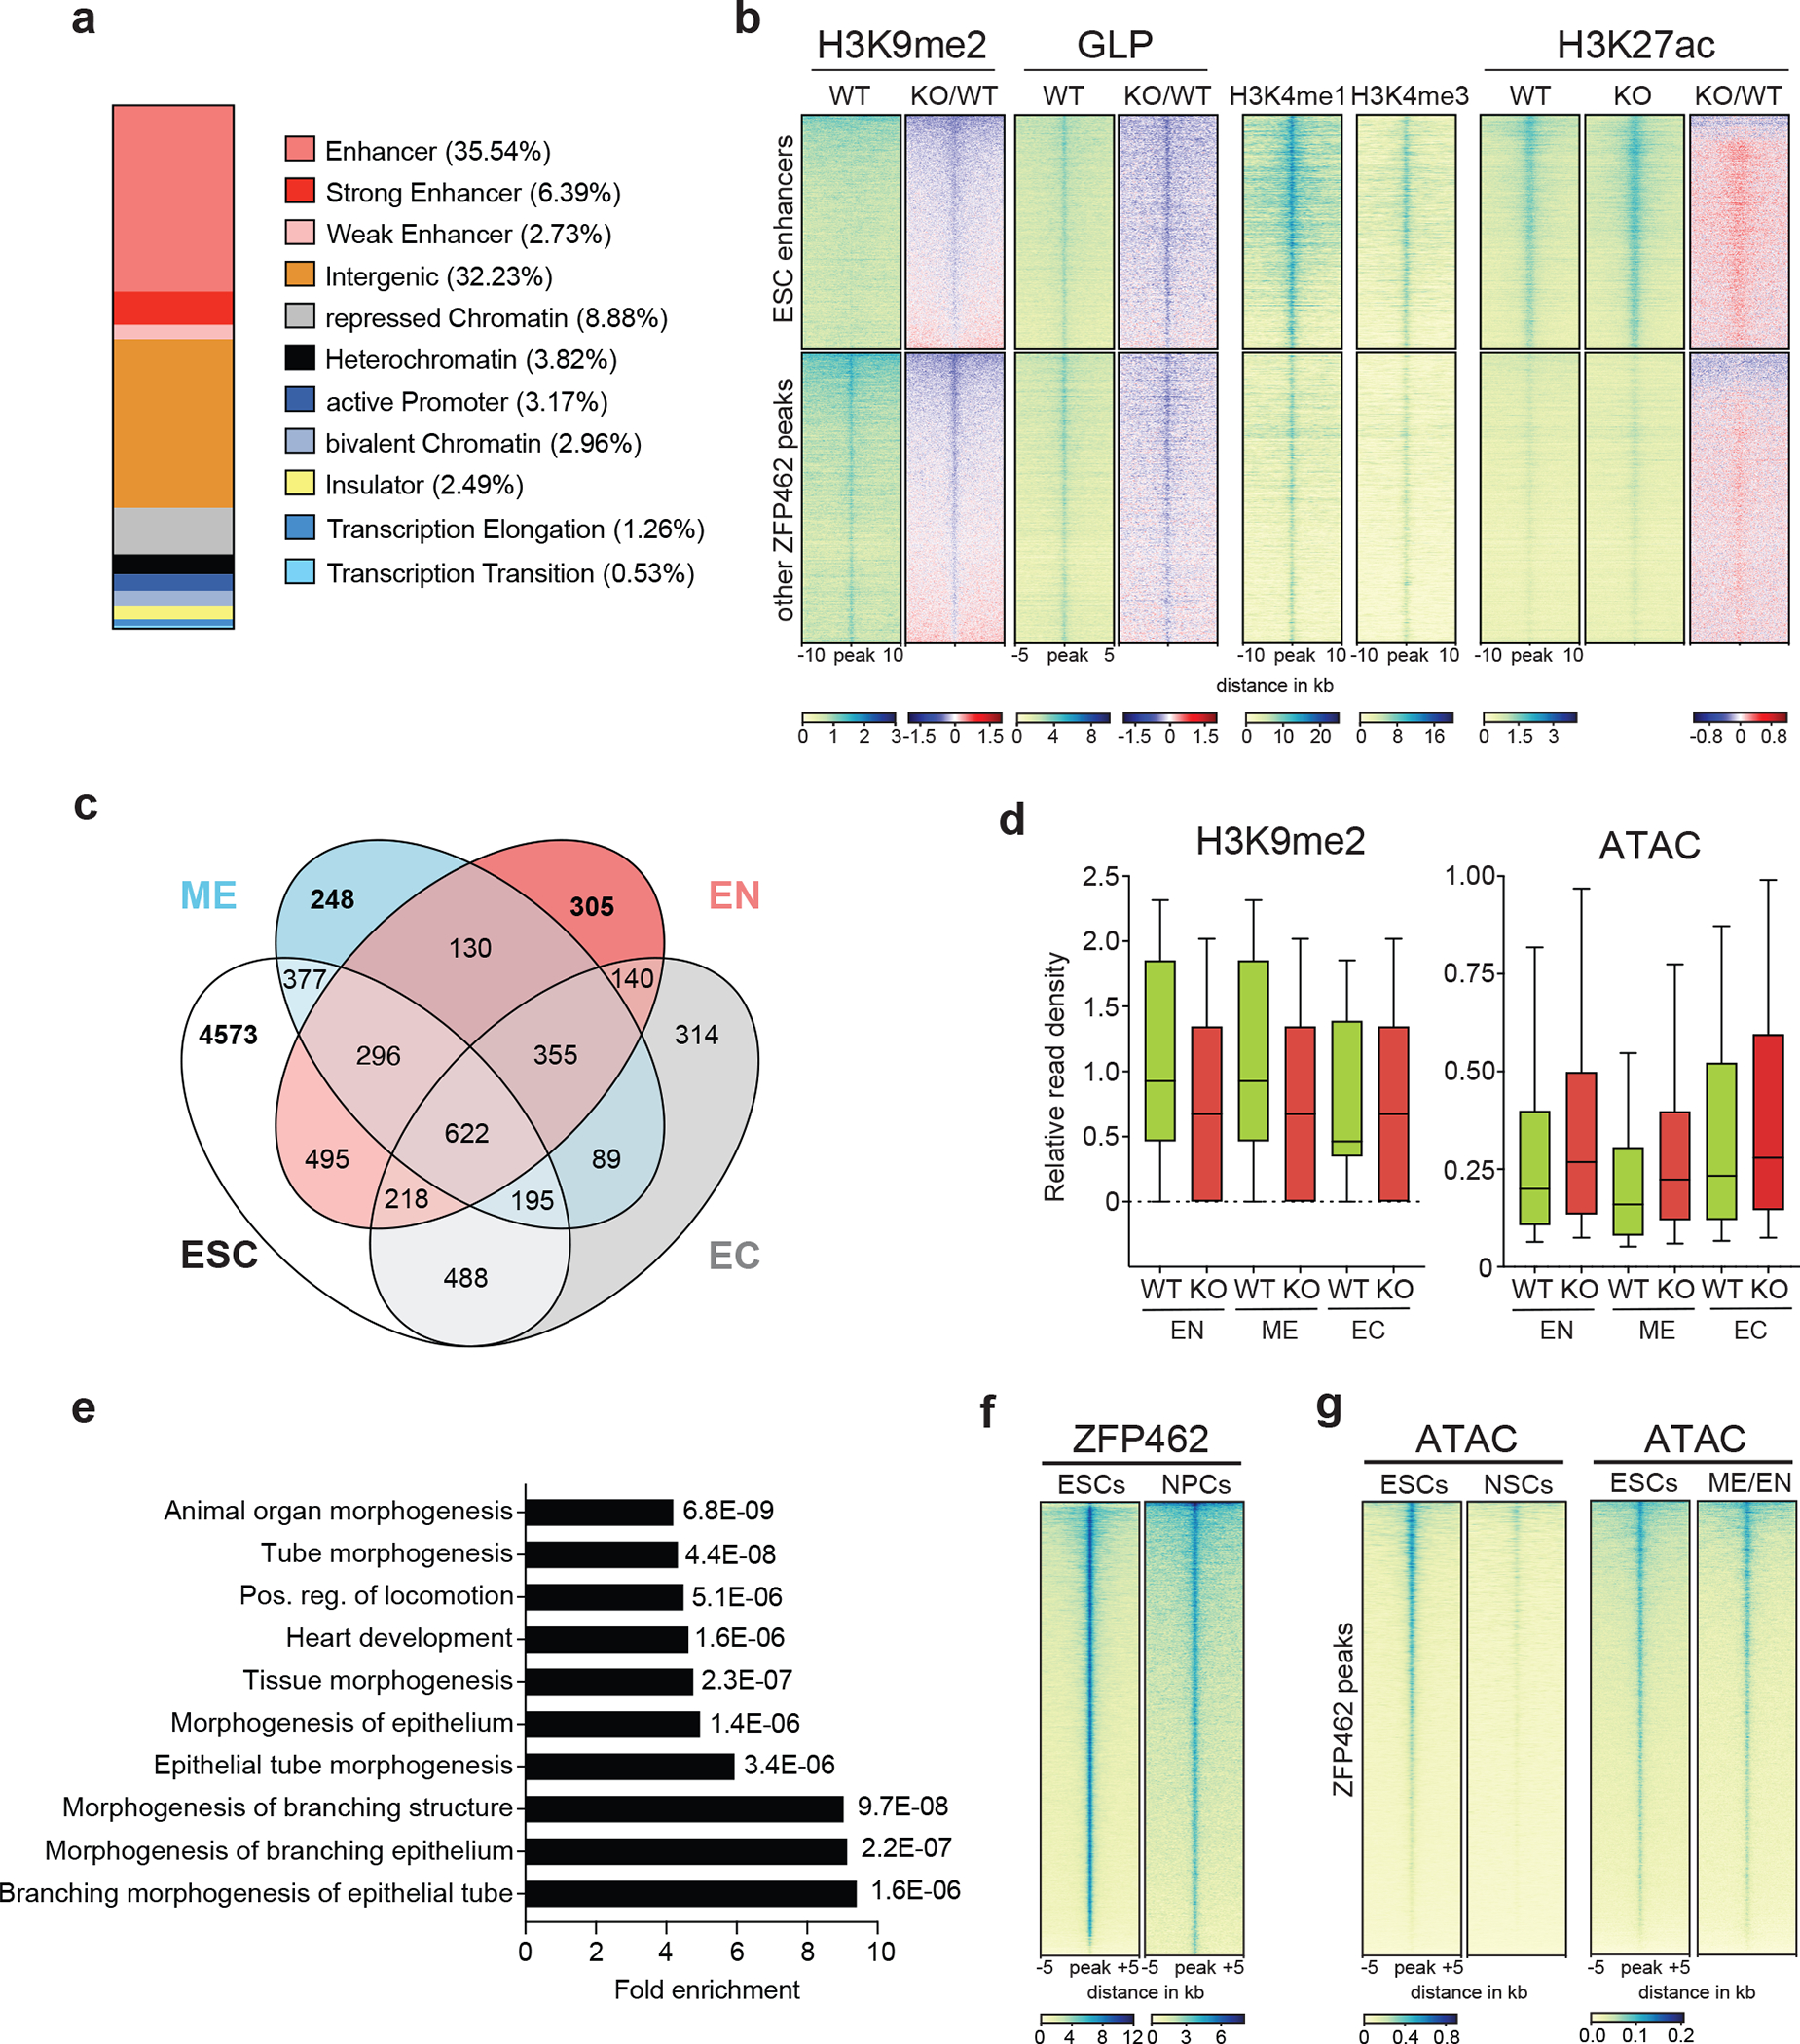
ZNF462 haploinsufficiency is linked to Weiss-Kruszka syndrome, a genetic disorder characterized by neurodevelopmental defects, including autism. Though conserved in vertebrates and essential for embryonic development, the molecular functions of ZNF462 remain unclear. We identified its murine homologue ZFP462 in a screen for mediators of epigenetic gene silencing. Here we show that ZFP462 safeguards neural lineage specification of mouse embryonic stem cells (ESCs) by targeting the H3K9-specific histone methyltransferase complex G9A/GLP to silence meso-endodermal genes. ZFP462 binds to transposable elements that are potential enhancers harbouring pluripotency and meso-endoderm transcription factor binding sites. Recruiting G9A/GLP, ZFP462 seeds heterochromatin, restricting transcription factor binding. Loss of ZFP462 in ESCs results in increased chromatin accessibility at target sites and ectopic expression of meso-endodermal genes. Taken together, ZFP462 confers lineage and locus specificity to the broadly expressed epigenetic regulator G9A/GLP. Our results suggest that aberrant activation of lineage non-specific genes in the neuronal lineage underlies ZNF462-associated neurodevelopmental pathology.


Conflict of interest statement

Competing interests Statement

The authors declare that they have no competing interests.

Figures

Extended Data Fig. 1:
Extended Data Fig. 1:. Characterization of WT and mutant CiA Oct4 dual reporter cells.
a) Western blot confirms expression of TetR-FLAG and TetR-FLAG-HP1 proteins in WT and Dnmt1 knockout (KO) CiA Oct4 dual reporter ESCs. LMNB1 is used as protein loading control. b) FACS gating strategy used to analyse the GFP fluorescence in cells. c) Flow cytometry histograms show GFP expression in CiA Oct4 dual reporter cells after TetR-FLAG recruitment and after TetR-FLAG release following Dox addition for four days. d) ChIP-qPCR shows relative enrichment of HP1γ upstream of the TetO site before tethering, in the presence of TetR-FLAG-HP1 and after Dox-dependent release of TetR-FLAG-HP1 for four days. n = 2 independent biological replicates. e) Bar plot shows fraction of cytosine methylation (5mC) in WT and Dnmt1 KO CiA Oct4 dual reporter ESCs measured by LC-MS. n = 3 independent biological replicates. Data are presented as mean values +/− SD. f) Western blot shows expression of TetR-FLAG-HP1 and ZFP462 in WT and two independent Zfp462 KO CiA Oct4 dual reporter ESC lines. LMNB1 is used as loading control.
Extended Data Fig. 2:
Extended Data Fig. 2:. ZFP462 is conserved across vertebrates and acts as transcriptional repressor.
a) Phylogenetic tree of ZFP462 protein orthologues in vertebrate species. Bootstrap values are shown on branches. b) Western blot shows expression ZFP462 fusions with TetR-FLAG in CiA Oct4 dual reporter ESCs. Bottom image shows long exposure. Hashtag indicates cleaved TetR-FLAG protein from TetR-FLAG-ZFP462-FL (full-length). TetR-FLAG fusions initially express mCherry for selection which is cleaved via P2A signal. Asterisk marks P2A uncleaved protein product. c) Representative flow cytometry histograms show GFP expression in CiA Oct4 dual reporter ESCs expressing TetR-FLAG fusions with full-length or truncated ZFP462 proteins. Each histogram is average profile of 100,000 analysed cells.
Extended Data Fig. 3:
Extended Data Fig. 3:. Zfp462 expression analysis and impact of Zfp462 deletion on ESC morphology and gene expression.
a) UMAP plots visualize lineage assignments of mouse embryonic developmental stages (embryonic day (E) E4.5 cells, E5.5 cells and E6.5–7 cells) as previously described (Wolf Reik et.al) (top). UMAP plots of Zfp462 RNA expression at corresponding developmental stages (bottom). b) Sanger sequence chromatograms of heterozygous Zfp462 mutants. Heterozygous non-sense mutations are highlighted in grey. c) Alkaline phosphatase staining of Zfp462 +/Y1195* and Zfp462 −/− cl.2 ESCs (scale bar = 100 μm). d) Correlation plot shows principal component analysis (PCA) of replicate RNA-seq experiments from WT, two Zfp462 +/− and two Zfp462 −/− ESC lines. e) Volcano plot shows differential gene expression of Zfp462 −/− cl.2 ESCs compared to WT ESCs. (n = three replicates). f) Bar plots show gene ontology (GO) terms enriched in the four clusters of heatmap in Fig. 3e.
Extended Data Fig. 4:
Extended Data Fig. 4:. Lineage-specifying genes are deregulated during neuronal differentiation.
a) Alkaline phosphatase staining of WT and Zfp462 mutant ESCs cultured in 2i/LIF/Serum medium (scale bar = 180 μm). b) Representative bright field images show Zfp462+/Y1195* and Zfp462 −/− cl.2 at corresponding stages of neural differentiation. Scale bar = 100μm. c) Western blot analysis shows levels of ZFP462, G9A and H3K9me2 in WT and Zfp462 −/− ESCs during neural differentiation. LMNB1 is used as loading control. d) Line plot shows RT-qPCR analysis of Zfp462 RNA expression during neural differentiation (n = two replicates). Expression level is shown relative to ESCs (2i/S/L). e) Heatmaps show differential expression of selected marker genes specific for endodermal (EN), mesodermal (ME) and neural lineages (EC) in heterozygous and homozygous Zfp462 mutant cells during neural differentiation.
Extended Data Fig. 5:
Extended Data Fig. 5:. ChIP-seq profiles of ZFP462, REST, ADNP, HP1γ and H3K9me2 in WT and Zfp462 KO ESCs.
a) Heatmap shows Spearman correlation between input controls and two independent ZFP462 ChIP-seq experiments. b) Heatmap shows Spearman correlation between input controls and two independent ChIP-seq experiments of GLP and HP1γ in WT and Zfp462 KO ESCs. c) Western blot shows ZFP462 expression in WT and Zfp462 KO Avi-FLAG-tagged GLP and HP1γ ESCs. d) Heatmap shows Spearman correlation between input controls and two independent ChIP-seq experiments of WIZ and H3K9me2 in WT and Zfp462 KO ESCs. e) Heatmaps of ZFP462, REST, ADNP, HP1γ and H3K9me2 ChIP-seq signals at ZFP462, REST and ADNP peaks in WT and Zfp462 KO ESCs. Blue-to-red scaled heatmap represents ChIP-seq enrichment ratios between Zfp462 KO versus WT (KO/WT). Each heatmap represents a 10 kb window centred on peak midpoints, sorted by ZFP462, REST and ADNP signal in their respective clusters. Below are scale bars (n = average distribution of two replicates).
Extended Data Fig. 6:
Extended Data Fig. 6:. Rescue of Zfp462 KO ESCs with ZFP462 full-length and ZFP462 C-terminal truncation.
a) Heatmap shows Spearman correlation between three independent ATAC-seq experiments in WT and Zfp462 KO ESCs. b) Scatter plot shows pairwise correlation of gene expression changes between Zfp462 KO vs WT and G9a/Glp dKO vs WT. coefficient of determination (R2): black – all genes, red – differentially regulated genes in Zfp462 KO vs WT (padj. ≤ 0.05, LFC ≥ 1). c) Cartoon depicts CRISPR strategy to knock-in coding sequences for ZFP462 full-length and ZFP462 NT+Mid proteins at the Zfp462 gene locus. Insertions were targeted in-frame with exon 3. d) Bar plot shows RT-qPCR analysis of Zfp462 RNA transcript levels in WT, KO and rescue ESCs. n = 2 independent biological replicates. e) Western blot analysis shows ZFP462 protein levels in WT, Zfp462 KO and rescue ESCs. LMNB1 is used as loading control. f) Alkaline phosphatase staining of WT and Zfp462 KO and rescue ESCs (scale bar = 100μm). g) Heatmaps of ATAC-seq signal ratios at ZFP462 and REST peaks of Zfp462 KO vs WT (KO/WT) and Zfp462 rescue ESCs (ZFP462 FL/WT) or (ZFP462 NT+Mid/WT). Each row represents a 10 kb window centred on peak midpoints, sorted by KO/WT enrichment ratio (n = average distribution of two ATAC-seq replicates). h) Line plots show RT-qPCR analysis of lineage marker expression during neural differentiation (n=two replicates) in WT, Zfp462 KO and rescue ESCs. Expression levels are shown relative to ESCs (2i/S/L).
Extended Data Fig. 7.
Extended Data Fig. 7.. Correlation between genomic distribution of ZFP462 and pluripotency transcription factors.
a) Heatmaps show ATAC-seq and ChIP-seq signal of ZFP462, H3K9me2, OCT4, SOX2, NANOG, ESRRB and NR5A2 at peaks of ZFP462, OSN (shared OCT4-SOX2-NANOG peaks not overlapping with ZFP462 peaks) and REST. Red-to-blue scaled heatmaps represent signal ratios between Zfp462 KO versus WT (KO/WT). Each row represents a 10 kb window centred on peak midpoints, sorted by H3K9me2 KO/WT ChIP signal loss. (n = average distribution of two ChIP-seq replicates / ATAC-seq three replicates). b) Genomic screenshot shows DNA accessibility (ATAC-seq) and ChIP-seq signals of H3K27ac and ZFP462 at the Oct3/4 locus in WT ESCs. ChIP-seq signals of OCT4, SOX2 and NANOG in WT (black line) and Zfp462 KO ESCs (green fill) are superimposed. ATAC-seq and ChIP-seq profiles are normalized to library size. c) Bar plot shows percentage of ZFP462-bound TE families overlapping with ChromHMM-annotated enhancers in ESCs. ZFP462-bound TEs contribute a total of 35.37% of ChromHMM-annotated enhancers in ESCs. d) HOMER analysis of known DNA sequence motifs enriched at ZFP462 peaks overlapping ChromHMM-annotated ME/EN-specific enhancers. Top ranked DNA sequence motifs and respective significance values are shown in the table. e) Box plots shows enrichment of NR5A2 and ESRRB ChIP signal in WT and Zfp462 KO ESCs at ZFP462 peaks overlapping with Mesoderm (ME)/Endoderm (EN)- and Ectoderm (EC)-specific enhancers. n = 553 (EN/ME), n = 314 (EC). Shown are median (horizontal line), 25th to 75th percentiles (boxes), and 90% (whiskers). Outliers are excluded. f) Bar plot shows frequency distribution of significantly up- and down-regulated genes located proximal to ZFP462 peaks annotated as ME/EN-specific enhancers (KO/WT, LFC ≥ 1 and padj. ≤ 0.05). g) Western blot shows ZFP462 protein expression in NSCs isolated from mouse brain and NPCs differentiated from WT ESCs. LMNB1 is used as loading control.
Fig. 1:
Fig. 1:. CRISPR screen identifies heterochromatin regulators required for heritable Oct3/4 gene silencing.
a) Design of the CiA Oct4 dual reporter locus in ESCs. One of the Oct3/4 alleles was modified in ESCs by inserting seven Tet Operator sites (TetO) flanked by a GFP and a BFP reporter gene on either side. GFP expression is under control of the Oct3/4 promoter whereas a PGK promoter drives BFP expression. The genomic screen shot (below) shows histone modifications and RNA expression at the Oct3/4 locus in wild-type ESCs. b) Scheme of the experimental design. TetR facilitates reversible HP1 tethering to TetO binding sites to establish heterochromatin and silence both GFP and BFP reporters. Doxycycline (Dox) addition releases TetR binding to distinguish heritable maintenance of chromatin modifications and gene silencing in the absence of the sequence-specific stimulus. c) Flow cytometry histograms of wild-type and Dnmt1 KO CiA Oct4 dual reporter ESCs show GFP expression before TetR-FLAG-HP1 tethering, in the presence of TetR-FLAG-HP1 and after four days of Dox-dependent release of TetR-FLAG-HP1. Percentages indicate fraction of GFP-negative cells. d) ChIP-qPCR shows relative enrichment of TetR-HP1 (FLAG) and histone modifications surrounding TetO before TetR-FLAG-HP1 tethering, in the presence of TetR-FLAG-HP1 and after four days of Dox-dependent release of TetR-FLAG-HP1. n = 2 independent biological replicates. e) Scheme of CRISPR screen design. MOI refers to multiplicity of infection. Volcano plot shows enrichment (log fold change GFP-pos. sorted vs unsorted cells) and corresponding significance (−log10 MAGeCK significance score) of genes in CRISPR screen (n = mean of three independent experiments). f) Flow cytometry histograms show GFP expression of two independent Zfp462 −/− CiA Oct4 dual reporter cell lines in the presence of TetR-FLAG-HP1 and after four days of Dox-dependent release of TetR-FLAG-HP1. Percentages indicate fraction of GFP-positive cells.
Fig. 2:
Fig. 2:. ZFP462 elicits silencing function through interaction with G9A/GLP and HP1γ.
a) Design of Avi-Zfp462 ESCs and western blot validation. Mouse ESCs expressing Biotin ligase (BirA) were used to modify the endogenous Zfp462 gene by inserting the Avi-GFP-3XFLAG tag downstream of the translation start codon. Western blot with FLAG and ZFP462 antibodies confirms ZFP462 tagging. b) and c) LC-MS analysis of Avi-tagged ZFP462 and Avi-tagged GLP ESCs. Volcano plots show enrichment and corresponding significance of co-purified proteins. (n = three replicates). d) Scheme of ZFP462 protein depicts locations of 27 C2H2 zinc finger domains (green bars). Fragments used to generate TetR fusions for tethering in CiA Oct4 dual reporter assay are indicated below. e) Bar plot shows percentage of GFP-negative CiA Oct4 ESCs measured by flow cytometry in response to ectopic TetR fusion protein expression (y-axis). f) Volcano plot of LC-MS analysis compares enrichment and corresponding significance of co-purified proteins between TetR-FLAG-ZFP462-CT and TetR-FLAG (n = three replicates).
Fig. 3:
Fig. 3:. Depletion of Zfp462 leads to aberrant expression of lineage specifying genes.
a) Western blot shows ZFP462 protein expression in wild-type (WT), two heterozygous and two homozygous Zfp462 mutant ESC lines. LMNB1 serves as loading control and reference for relative ZFP462 quantification (numbers below). b) Alkaline phosphatase staining of WT, heterozygous and homozygous Zfp462 mutant ESCs. Enlarged region is marked as square in the image. Scale bar = 100μm. c) Volcano plots show gene expression changes in homozygous (top) and heterozygous (bottom) Zfp462 mutant ESCs compared to WT ESCs (n = three replicates). Indicated are the numbers of significantly up- or down regulated genes. (padj. ≤ 0.05; LFC ≥ 0.5). d) Heatmap show cluster analysis of differentially expressed genes (padj. ≤ 0.05; LFC ≥ 1) in WT and Zfp462 mutant ESCs. Top gene ontology (GO) terms and corresponding significance are indicated for each cluster (left). e) Genomic screen shots of Sox17 and Gata6 show mRNA expression levels in WT and Zfp462 mutant ESCs. All RNA-seq profiles are normalized for library size.
Fig. 4:
Fig. 4:. Zfp462 mutant cells show abnormal cell fate specification during neuronal differentiation.
a) Scheme shows design of neural differentiation experiment from ESCs to neural progenitor cells (NPCs) (top). Stepwise withdrawal of 2i inhibitors (2i) and Leukaemia Inhibitory Factor (LIF) leads to formation of cellular aggregates called embryoid bodies (EBs). Subsequent treatment with retinoic acid (RA) induces enrichment of NPCs. Representative bright field images show WT and Zfp462 mutant cells at corresponding stages of neural differentiation. Scale bar = 100μm. b) Line plots shows RT-qPCR analysis of lineage marker expression during neural differentiation (n=two replicates). Expression levels are shown relative to ESCs (2i/S/L). c) Heatmap shows cluster analysis of differentially expressed genes (padj. ≤ 0.05; LFC ≥ 1) in WT and Zfp462 mutant cells during neural differentiation (n = two replicates). Selected lineage marker genes are indicated for each cluster (left). d) Heatmaps show differential expression of selected marker genes specific for endodermal and neural lineages in heterozygous and homozygous Zfp462 mutant cells during neural differentiation. e) Immunohistochemistry analysis shows SOX1 and FOXA2 expression in WT and homozygous Zfp462 mutant at day 8 of neural differentiation. Cell aggregates are counterstained with DAPI. Scale bar = 50μm. f) Bar plots show quantification of SOX1 and FOXA2 immunofluorescence in WT (n = 9 cell aggregates over 2 independent experiments) and Zfp462 −/− cell (n = 12 cell aggregates over 3 independent experiments). Data are presented as mean values +/− SD. P values derived from a two-tailed t-test are indicated.
Fig. 5:
Fig. 5:. ZFP462 establishes H3K9me2 containing heterochromatin by recruiting GLP and WIZ proteins.
a) Heatmaps of ZFP462 ChIP-seq enrichment at significant ZFP462 peaks (16,264) (top cluster) and REST peaks (bottom cluster) in ESCs. Each row represents a 10 kb window centred on peak midpoint, sorted by ZFP462 ChIP signal. Input signals for the same windows are shown on the left. Below are scale bars. (n = average distribution of two replicates). Bar plot, on the right, shows percentage of genomic features overlapping with ZFP462 peaks. b) Bar plot shows fraction of repetitive DNA types overlapping with ZFP462 peaks. 39.76 % of ZFP462 peaks are associated with repeat elements. c) Volcano plot shows enrichment and corresponding significance of TE families overlapping with ZFP462 peaks. d) Heatmaps of GLP, WIZ and H3K9me2 ChIP-seq enrichment at ZFP462 and REST peaks in WT and Zfp462 KO ESCs. Blue-to-red scaled heatmap represents corresponding ChIP-seq enrichment ratio between Zfp462 KO versus WT (KO/WT). All heat maps are sorted by GLP enrichment signal in WT. For GLP and WIZ, each row represents a 10 kb window centred on ZFP462 peak midpoints. For H3K9me2, each row represents a 20 kb window (n = average distribution of two replicates). e) Screen shots of two selected genomic regions with ZFP462 peaks display GLP, WIZ and H3K9me2 ChIP-seq signals in WT and Zfp462 KO ESCs. Grey bars indicate ENCODE enhancer annotations. ChIP-seq profiles are normalized for library size. f) Metaplots show average GLP, WIZ and H3K9me2 signal at ZFP462 and REST peaks in WT and Zfp462 KO ESCs. For each plot, read density is plotted at 10 kb window centred on peak midpoints.
Fig. 6:
Fig. 6:. ZFP462 targeted heterochromatin restricts DNA accessibility and TF binding.
a) Heatmaps of GLP, WIZ and H3K9me2 ChIP-seq enrichment ratios between Zfp462 KO versus WT (KO/WT) ESCs at ZFP462 and REST peaks. On the right, heatmaps of ATAC-seq signal at ZFP462 and REST peaks in WT and Zfp462 KO ESCs. Blue-to-red scaled heatmap represent corresponding enrichment ratios between Zfp462 KO versus WT (KO/WT) ESCs. GLP, WIZ and ATAC-seq heatmaps represent a 10kb window, H3K9me2 heatmap represent a 20 kb window centred on peak midpoints, sorted by H3K9me2 KO/WT enrichment ratio (n = average distribution of two ChIP-seq replicates and average distribution of three ATAC-seq replicates). b) Metaplots show average profiles of ATAC-seq signal in WT (green) and Zfp462 KO (red) ESCs at ZFP462 peaks (left) and REST peaks (right). c) Volcano plot shows DNA accessibility changes between WT and Zfp462 KO ESCs. X-axis represents fold change in accessibility and corresponding significance on Y-axis. Differentially accessible sites bound by ZFP462 are highlighted in red. Indicated in grey is the number of loci with increased DNA accessibility and in red the number of ZFP462-bound loci with increased DNA accessibility with significance < 0.05. d) Heatmaps of ATAC-seq signal at ZFP462 and REST peaks in WT and G9a/Glp dKO ESCs. Blue-to-red scaled heatmap represent corresponding enrichment ratios between G9a/Glp dKO versus WT (KO/WT) ESCs. Each row represents a 10 kb window centred on peak midpoints, sorted by dKO/WT enrichment ratio (n = average distribution of two ATAC-seq replicates). e) Metaplots show average profiles of ATAC-seq signal in WT (green) and G9a/Glp dKO (red) ESCs at ZFP462 peaks (above) and REST peaks (below). f) RT-qPCR expression analysis of meso-endodermal marker genes in WT, Zfp462 KO and Zfp462 KO ESCs expressing ZFP462 FL or ZFP462 NT+Mid. n = 2 independent biological replicates. g) HOMER analysis of known DNA sequence motifs enriched at significant ZFP462 peaks. Top ranked DNA sequence motifs and respective significance values are shown in the table. h) Metaplots show average pluripotency TF ChIP-seq signal in WT and Zfp462 KO ESCs at ZFP462 peaks with LFC ≥ 1 in KO/WT H3K9me2 ChIP signal loss and at shared OCT4-SOX2-NANOG (OSN) peaks that are not bound by ZFP462. (n = average distribution of two replicates).
Fig. 7:
Fig. 7:. ZFP462 represses meso-endodermal enhancers in ESCs
a) Bar plot shows percentage of ZFP462 ChIP-seq peaks overlapping with ChromHMM states in ESCs. b) Heatmaps of GLP, H3K9me2, H3K4me1, H3K4me3 and H3K27ac ChIP-seq signals at ZFP462 peaks separated into two clusters: ESC enhancers and other ZFP462 peaks. Blue-to-red scaled heatmap represent corresponding enrichment ratios between Zfp462 KO versus WT (KO/WT). GLP heatmap represent 10kb and histone modifications heatmaps represent a 20 kb window centred on peak midpoints, sorted by H3K9me2 KO/WT enrichment ratio (n = average distribution of two ChIP-seq replicates). c) Venn diagram shows overlap of ZFP462 peaks with ChromHMM-annotated enhancers in ESC, Endoderm (EN), Mesoderm (ME) and Ectoderm (EC). d) Box plots shows enrichment of H3K9me2 ChIP signal and ATAC-seq signal in WT and Zfp462 KO ESCs at ZFP462 peaks overlapping with Endoderm (EN)-, Mesoderm (ME)- and Ectoderm (EC)-specific enhancers. n = 305 (EN), n = 248 (ME), n = 314 (EC). Shown are median (horizontal line), 25th to 75th percentiles (boxes), and 90% (whiskers). Outliers are excluded. e) Bar plot shows GO term analysis of biological processes of genes with significant differential expression (KO/WT, LFC ≥ 1 and padj. ≤ 0.05) located proximal to ZFP462 peaks annotated as meso-endoderm-specific enhancers. f) Heatmap of ZFP462 ChIP-seq enrichment at ZFP462 peaks in ESCs and NPCs. ChIP-seq rows represent 10 kb window centred on ZFP462 peak midpoints, sorted by ZFP462 ChIP-seq signal intensity (n = average distribution of two replicates). g) Heatmaps of ATAC-seq signal at ZFP462 peaks in ESCs and NSCs (left). Heatmaps of ATAC-seq signal at ZFP462 peaks in ESCs and meso-endoderm (ME/EN) cells . ATAC-seq rows represent 10 kb window centred on ZFP462 peak midpoints, sorted by ESCs ATAC-seq signal intensity.

References

    1. Eckersley-Maslin MA, Alda-Catalinas C & Reik W Dynamics of the epigenetic landscape during the maternal-to-zygotic transition. Nat. Rev. Mol. Cell Biol. 19, 436–450 (2018). - PubMed
    1. Burton A & Torres-Padilla M-E Chromatin dynamics in the regulation of cell fate allocation during early embryogenesis. Nat. Rev. Mol. Cell Biol. 15, 723–735 (2014). - PubMed
    1. Gökbuget D & Blelloch R Epigenetic control of transcriptional regulation in pluripotency and early differentiation. Development 146, (2019). - PMC - PubMed
    1. Iwafuchi-Doi M & Zaret KS Cell fate control by pioneer transcription factors. Development 143, 1833–1837 (2016). - PMC - PubMed
    1. Padeken J, Methot SP & Gasser SM Establishment of H3K9-methylated heterochromatin and its functions in tissue differentiation and maintenance. Nat. Rev. Mol. Cell Biol. (2022) doi:10.1038/s41580-022-00483-w. - DOI - PMC - PubMed

MeSH terms