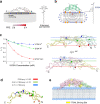
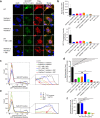
. 2023 Feb;33(2):131-146.
doi: 10.1038/s41422-022-00755-2. Epub 2023 Jan 6.

Autoinhibitory structure of preligand association state implicates a new strategy to attain effective DR5 receptor activation

Affiliations

Autoinhibitory structure of preligand association state implicates a new strategy to attain effective DR5 receptor activation

Gang Du et al. Cell Res. 2023 Feb.

Abstract

Members of the tumor necrosis factor receptor superfamily (TNFRSF) are important therapeutic targets that can be activated to induce death of cancer cells or stimulate proliferation of immune cells. Although it has long been implicated that these receptors assemble preligand associated states that are required for dominant interference in human disease, such states have so far eluded structural characterization. Here, we find that the ectodomain of death receptor 5 (DR5-ECD), a representative member of TNFRSF, can specifically self-associate when anchored to lipid bilayer, and we report this self-association structure determined by nuclear magnetic resonance (NMR). Unexpectedly, two non-overlapping interaction interfaces are identified that could propagate to higher-order clusters. Structure-guided mutagenesis indicates that the observed preligand association structure is represented on DR5-expressing cells. The DR5 preligand association serves an autoinhibitory role as single-domain antibodies (sdAbs) that partially dissociate the preligand cluster can sensitize the receptor to its ligand TRAIL and even induce substantial receptor signaling in the absence of TRAIL. Unlike most agonistic antibodies that require multivalent binding to aggregate receptors for activation, these agonistic sdAbs are monovalent and act specifically on an oligomeric, autoinhibitory configuration of the receptor. Our data indicate that receptors such as DR5 can form structurally defined preclusters incompatible with signaling and that true agonists should disrupt the preligand cluster while converting it to signaling-productive cluster. This mechanism enhances our understanding of a long-standing question in TNFRSF signaling and suggests a new opportunity for developing agonistic molecules by targeting receptor preligand clustering.


Conflict of interest statement

The authors declare no competing interests.

Figures
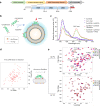
Fig. 1
Fig. 1. FRET and NMR characterization of DR5-ECD anchored to lipid bilayer.
a The ECD construct of human DR5 for yeast expression and spectroscopic studies. b Schematic illustration of a FRET assay for quantifying ECD self-association when anchored to liposomes. Cy3/Cy5 is labeled at residue 77 of the S77C mutant of DR5-ECD. c FRET spectra recorded by excitation of Cy3 at 510 nm and emission from 520–800 nm, showing strong appearance of Cy5 emission due to Cy3-Cy5 FRET when the proteins are anchored to liposomes. The spectrum color definitions are: black, 5 μM Cy3-ECD in solution; purple, mixture of 5 μM Cy3 and 5 μM Cy5 dyes; blue, mixture of 5 μM Cy3-ECD and 5 μM Cy5-ECD in solution; red, mixture of 5 μM Cy3-ECD and 5 μM Cy5-ECD in the presence of liposome; green, mixture of 5 μM Cy3-ECD and 5 μM Cy5-ECD in the presence of liposome and 10 μM of TRAIL. d The 1H-15N TROSY-HSQC spectrum of (15N, 2H)-labeled DR5-ECD in solution recorded at 30 °C. e Spectral changes of DR5-ECD over a course of 10 days after anchoring to DMPC-DH7PC bicelles (q = 0.5) at 30 °C (top) and 37 °C (bottom).
Fig. 2
Fig. 2. Structures of DR5-ECD preligand associations on bicelles.
a Cartoon representation of a trimeric assembly of bicelle-anchored DR5-ECD that contains the two non-overlapping interaction interfaces. b Detailed views of Interfaces 1 and 2 for highlighting residues that appear to participate in hydrophilic (electrostatic or salt bridge) or hydrophobic interactions between the neighboring monomers. ce Possible higher-order assemblies by replicating Interface 1 (c), replicating Interface 2 (d), and combining Interfaces 1 and 2 (e).
Fig. 3
Fig. 3. Characterization of the resting position of DR5-ECD on lipid bilayer.
a Mapping of residue-specific PRE induced by 2 mM N-TP onto the DR5-ECD monomer structure with the color spectrum of PRE values defined in the Figure. PRE is defined as the ratio of peak height of bicelle-anchored DR5-ECD in the presence (I) and absence (I0) of N-TP. b Schematic illustration of the use of the lipophilic paramagnetic probe, 5-DOXYL-stearic acid (5-DSA), for determining the resting position of the DR5-ECD cluster on bicelles. c Paramagnetic probe titration using the lipophilic probe 5-DSA for identifying the side of the DR5-ECD cluster that faces the bicelle. Example signal decay curves (left panel) are shown for W107, S104, and V124, which mark three different elevations (right panel) from the bicelle surface, respectively. The colors of the spheres in the structure match that of the plots in representing the residue numbers. The curve fitting is described in Materials and Methods. d Mapping of residue-specific PREamp (determined by good fitting to Eq. 1 in Materials and Methods) onto the DR5-ECD monomer structure with the color spectrum of PREamp values defined in the figure. Larger PREamp means closer to the bicelle. e Positioning of the trimeric assembly in Fig. 2a on the lipid bilayer region of the bicelle based on the data in ad. The regions involved in TRAIL binding are shown in yellow.
Fig. 4
Fig. 4. Interference with preligand association by sdAbs and influence on TRAIL-induced DR5 signaling.
a Effect of the five NANOBODY® compounds (NB1–NB5) with high affinity for DR5-ECD (Table 1) on preligand association as reported by the liposome-based FRET assay. NB0 is a negative control sdAb that does not bind DR5-ECD. b TRAIL dose-response activation profiles based on caspase-8 activity (left) and cell viability (right). Monoclonal HEK293T stable cells expressing wild-type (WT) DR5 were treated with indicated concentrations of TRAIL for 6 h and 12 h for caspase-8 activity and cell viability readout, respectively. Caspase-8 activity was measured using the CaspGLOW red caspase-8 activity kit. Cell viability was measured using the cell-count kit (CCK-8) that measures dehydrogenase activity of the cells. Results were obtained from 3 independent experiments (n = 3) and expressed as means ± SEM. c Effect of sdAbs on DR5 signaling in the presence of 50 ng/mL TRAIL reported by caspase-8 activity as in b. HEK293T stable cells expressing WT DR5 were treated with indicated concentrations of sdAbs and 50 ng/mL TRAIL for 6 h. The reported activity is normalized as % of the fully saturated DR5 activation by TRAIL, indicated by Δ1 in b. Results were obtained from 3 independent experiments (n = 3) and expressed as means ± SEM. Two-way ANOVA, ****P < 0.0001. d Effect of sdAbs in the presence of 25 ng/mL TRAIL reported by cell viability as in b. HEK293T stable cells expressing WT DR5 were treated with indicated concentrations of sdAbs and 25 ng/mL TRAIL for 12 h. The reported activity is normalized as % of the fully saturated DR5 activation by TRAIL, indicated by Δ2 in b. Results were obtained from 3 independent experiments (n = 3) and expressed as means ± SEM. Two-way ANOVA, ****P < 0.0001. e Epitope mapping for NB1 by NMR. Residue-specific normalized chemical shift changes (Δδ; see Supplementary information, Fig. S4b for definition) are mapped onto the DR5-ECD preligand structure (left) and TRAIL-bound structure (right) according to the color spectrum defined in the figure.
Fig. 5
Fig. 5. SdAb disruption of preligand association and agonistic effect in the absence of TRAIL.
a Effect of the five individual sdAbs on DR5 signaling as reported by caspase-8 activity in the absence TRAIL (see also Supplementary information, Fig. S5a, b). Monoclonal HEK293T stable cells expressing WT DR5 were treated with 1 μg/mL sdAbs for 6 h. Caspase-8 activity was measured using the CaspGLOW red caspase-8 activity kit and normalized as % of the fully saturated DR5 activation by TRAIL, indicated by Δ1 in Fig. 4b. Results were obtained from 3 independent experiments (n = 3) and expressed as means ± SEM. Student’s t-tests, *P < 0.05, **P < 0.01. b Disruption of preligand association by all combinations of two sdAbs out of the five, as reported by the liposome-based FRET assay. c Effect of all combinations of two sdAbs in b on DR5 signaling reported by caspase-8 activity. HEK293T stable cell lines expressing the WT DR5 were treated with combinations of sdAbs (1 μg/mL each) for 6 h (see also dose response in Supplementary information, Fig. S5c). Caspase-8 activity was measured and reported as in a. Student’s t-tests, ***P < 0.001, ****P < 0.0001. d Same as in c using cell viability as readout. HEK293T stable cells expressing WT DR5 were treated with combinations of sdAbs (1 μg/mL each) for 12 h. Cell viability was measured and reported as in Fig. 4d. Student’s t-tests, ***P < 0.001, ****P < 0.0001. e Correlation between disruption of preligand association reported by FRET reduction and DR5 activation reported by caspase-8 activity (left) or cell viability (right). The results from all individual and pairs of sdAbs were combined to generate the plots.
Fig. 6
Fig. 6. Examination of DR5-ECD preligand association on cell surface.
a Confocal images of DR5 ECD-TMDm and variants expressed in HEK293T cells in the absence and presence of sdAbs (see also Supplementary information, Fig. S9a). The constructs tested include the Flag-ECD-TMDm-GFPN/C with WT ECD and that with mutations disrupting Interface 1 (H85A, I95A, K98N, R115D) or Interface 2 (D120K, K155S, R154E, V165A). The sdAbs NB1 (1 μg/mL) and/or NB3 (1 μg/mL) were added before transfection. Cells were fixed with 4% paraformaldehyde and were then stained with Alexa Fluor® 594 anti-Flag antibody for 2 h before imaging (405 nm, 488 nm and 559 nm lasers were used for DAPI, split-GFP, and Alexa549 channels, respectively). Images were taken with the Olympus Fluoview FV1000 confocal microscope. Scale bar, 5 μm. b Quantification of the size (top) and intensity (bottom) of the puncta (or clusters) using the Fiji software. c Flow cytometry plots in the GFP fluorescence dimension, reporting self-association of Flag-ECD-TMDm-GFPN/C and variants expressed in HEK293T cells (see also Supplementary information, Fig. S9d). d Normalized split-GFP fluorescence intensity by dividing the integrated signals of the association-positive region (GFP fluorescence) by that of expression-positive region (Flag-Alexa647 fluorescence) in Supplementary information, Fig. S9d. Student’s t-tests, **P < 0.01, ***P < 0.001, ****P < 0.0001 and NS (non-significant) represents P > 0.05. e Flow-cytometry plots in the GFP fluorescence dimension of Flag-ECD-tev-TMDm-GFPN/C in HEK293T cells in the presence of TEV enzyme (0–200 μg/mL; for dose-dependent removal of the ECD), showing that ECD self-association is responsible for the GFP signals in ad (see also Supplementary information, Fig. 10a, b). f Quantification of data in e showing integrated signals in the split-GFP positive region at various protease concentrations. Student’s t-tests, ****P < 0.0001, and NS (non-significant) represents P > 0.05.
Fig. 7
Fig. 7. A model of receptor activation for DR5: converting preligand clusters (non-productive) to signaling-productive clusters.
The model posits that in the absence of ligand the ECD lies flat on membrane, forming clusters that position the TMDs in a loose arrangement incompatible with formation of the death-inducing signaling complex. TRAIL binding causes the ECD to stand up, allowing the TMDs to cluster in a more compact dimer-trimer arrangement compatible with downstream signaling. The red balls indicate the position of C-termini of the ECDs. The circles in cyan indicate the position of the TMDs. The pink regions in the resting state of ECDs indicate the TRAIL binding sites. “DD” denotes the intracellular death domain of DR5. The fundamentally different TMD patterns between the preligand and postligand states may be the key to explaining ligand-induced receptor activation.

Comment in

  • Death receptor 5 rises to the occasion.
    Zheng L, Yao Y, Lenardo MJ. Zheng L, et al. Cell Res. 2023 Mar;33(3):199-200. doi: 10.1038/s41422-022-00772-1. Cell Res. 2023. PMID: 36646764 Free PMC article. No abstract available.

References

    1. Chen Z, Oh D, Biswas KH, Zaidel-Bar R, Groves JT. Probing the effect of clustering on EphA2 receptor signaling efficiency by subcellular control of ligand-receptor mobility. Elife. 2021;10:e67379. - PMC - PubMed
    1. Janes PW, Nievergall E, Lackmann M. Concepts and consequences of Eph receptor clustering. Semin. Cell Dev. Biol. 2012;23:43–50. - PubMed
    1. Zhang X, Gureasko J, Shen K, Cole PA, Kuriyan J. An allosteric mechanism for activation of the kinase domain of epidermal growth factor receptor. Cell. 2006;125:1137–1149. - PubMed
    1. Wu H. Higher-order assemblies in a new paradigm of signal transduction. Cell. 2013;153:287–292. - PMC - PubMed
    1. Dustin ML, Groves JT. Receptor signaling clusters in the immune synapse. Annu. Rev. Biophys. 2012;41:543–556. - PMC - PubMed

Publication types

MeSH terms

Substances