. 2023 Jan 5;6(1):11.
doi: 10.1038/s42003-022-04381-x.

Spectrin-beta 2 facilitates the selective accumulation of GABAA receptors at somatodendritic synapses

Affiliations

Spectrin-beta 2 facilitates the selective accumulation of GABAA receptors at somatodendritic synapses

Joshua L Smalley et al. Commun Biol. .

Abstract

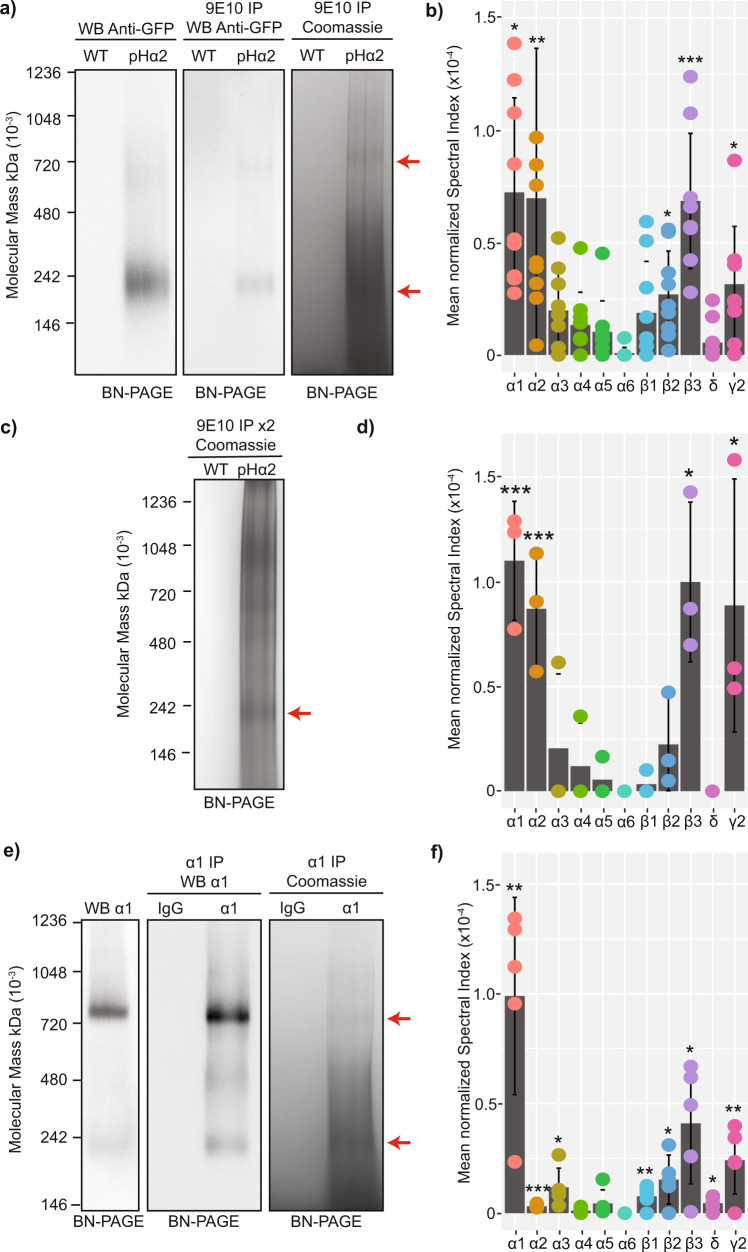
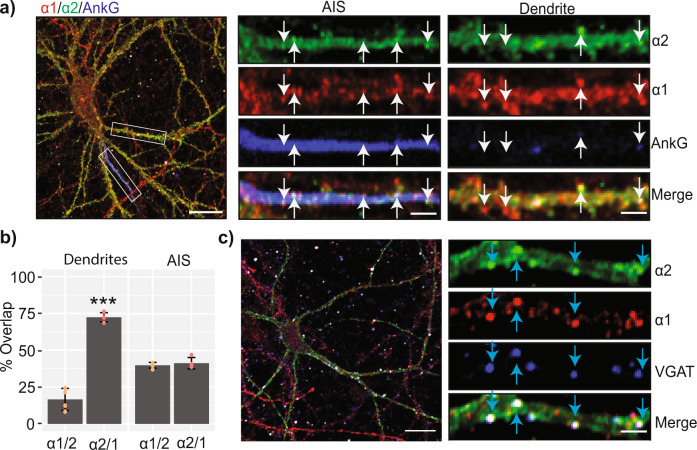
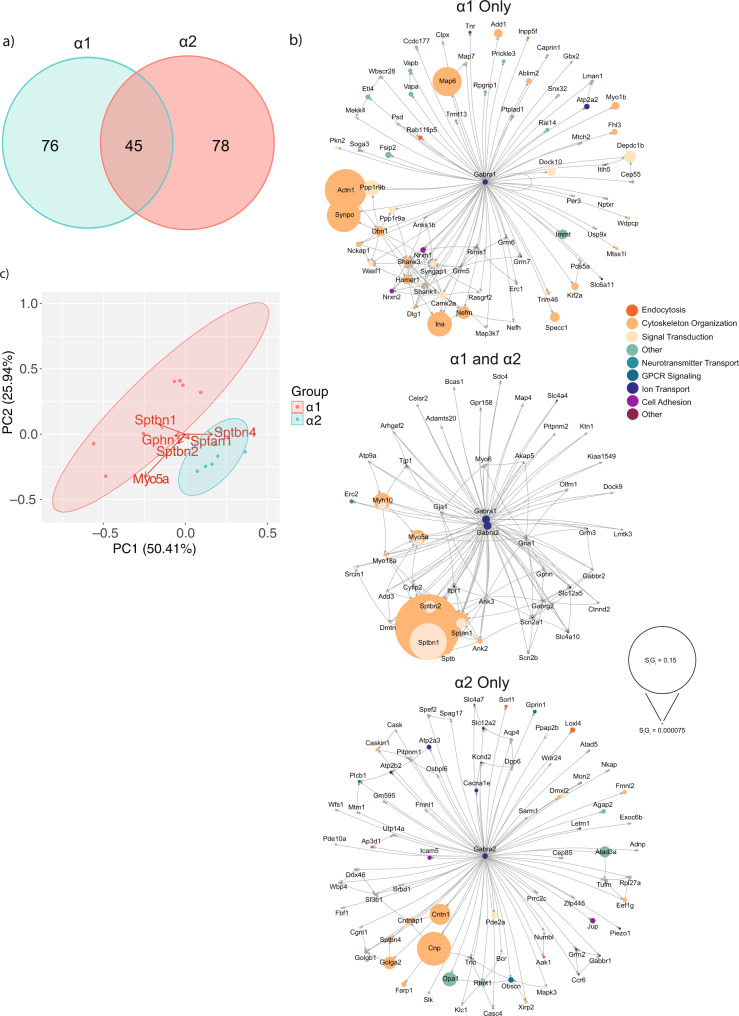
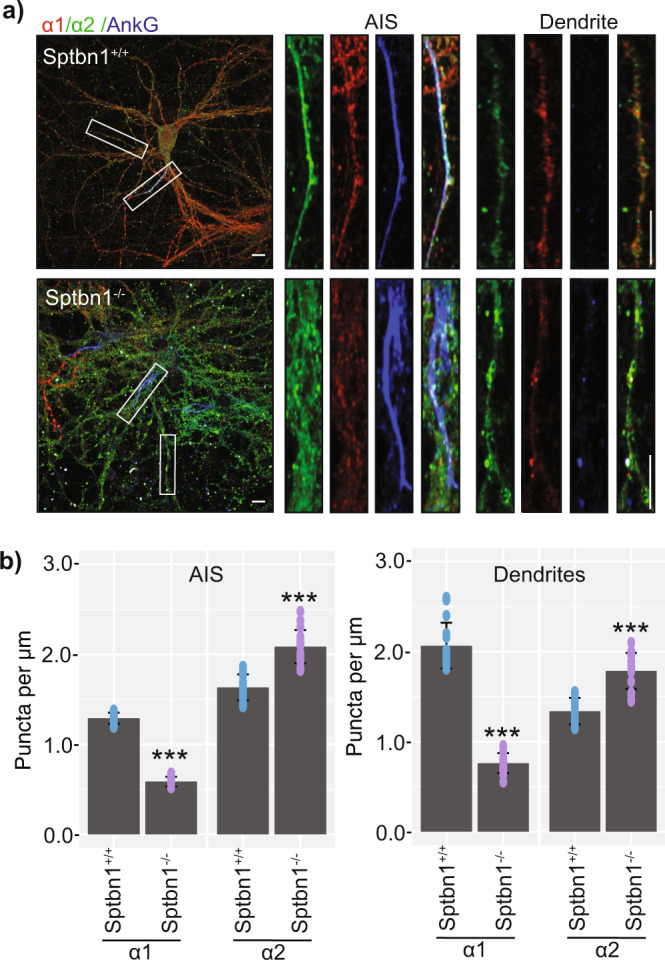
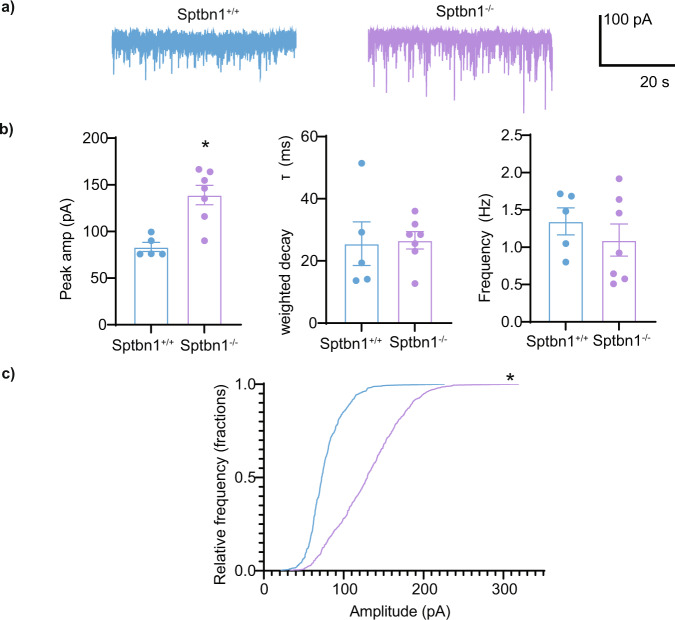
Fast synaptic inhibition is dependent on targeting specific GABAAR subtypes to dendritic and axon initial segment (AIS) synapses. Synaptic GABAARs are typically assembled from α1-3, β and γ subunits. Here, we isolate distinct GABAARs from the brain and interrogate their composition using quantitative proteomics. We show that α2-containing receptors co-assemble with α1 subunits, whereas α1 receptors can form GABAARs with α1 as the sole α subunit. We demonstrate that α1 and α2 subunit-containing receptors co-purify with distinct spectrin isoforms; cytoskeletal proteins that link transmembrane proteins to the cytoskeleton. β2-spectrin was preferentially associated with α1-containing GABAARs at dendritic synapses, while β4-spectrin was associated with α2-containing GABAARs at AIS synapses. Ablating β2-spectrin expression reduced dendritic and AIS synapses containing α1 but increased the number of synapses containing α2, which altered phasic inhibition. Thus, we demonstrate a role for spectrins in the synapse-specific targeting of GABAARs, determining the efficacy of fast neuronal inhibition.


Conflict of interest statement

The authors declare no competing interests.

Figures

Fig. 1
Fig. 1. Analyzing the subunit composition of native GABAAR subtypes using affinity purification and quantitative mass spectroscopy.
a α2 GABAAR-containing protein complexes were immunopurified using pre-optimized conditions (Supplementary Figure 1) using anti-9E10 (myc) antibodies, from plasma membrane fractions of pHα2 mice and resolved by BN-PAGE. Stable protein complexes were observed at ~720 kDa and ~250 kDa (red arrows). The complexes were consistently present in the lysate prior to immunopurification. Immunopurified complexes were visualized by both immunoblot and colloidal Coomassie staining. Representative images from an n = 9 experiment. b The resolved α2 complexes at approximately 250 kDa, the mass of an intact pentameric GABAAR, were characterized by quantitative proteomics compared to anti-9E10 immunopurified material from wild type mice (n = 9, *p < 0.05, **p < 0.01, ***p < 0.001). Detected peptides were mapped to the mouse proteome and the GABAAR subunit expression quantified by measuring the spectral index normalized to the global index (SIGI) (n = 4). The raw data are contained in Supplementary Data 1. c Double immunopurifications for α2-containing GABAARs were carried out to achieve more highly purified α2-containing GABAARs. These were visualized by immunoblot where a persistent protein band was observed at 250 kDa (red arrow). Representative image from an n = 3 experiment. d The 250 kDa band was analyzed for GABAAR subunit expression measured by quantitative LC-MS/MS (n = 3, *p < 0.05). The raw data are contained in Supplementary Data 2. e The immunopurification experiments were repeated for α1 GABAAR-containing protein complexes in wild type mice. Complexes were resolved and visualized by immunoblot and Coomassie staining. Stable protein complexes were observed at ~720 kDa and ~250 kDa (red arrows). Representative images from an n = 5 experiment. f The 250 kDa band was analyzed for GABAAR subunit composition measured by quantitative LC-MS/MS (n = 5). Error bars represent the standard error of the mean (SEM). The raw data are contained in Supplementary Data 3. The raw gel/membrane scans are shown in Supplementary Figure 2.
Fig. 2
Fig. 2. Determining the subcellular distribution of α1 and α2 GABAAR subunits in cultured neurons.
a) Mouse neurons from pHα2 mice were fixed and permeabilized at Days In Vitro (DIV) 21 and immunostained using antibodies against GFP (α2), α1, and AnkG. Dendrites and AIS were distinguished by the presence or absence of AnkG immunoreactivity. Scale bar = 10 μm and 2 μm in cropped images. b) The colocalization of α1 and α2 puncta were quantified in AnkG positive (AIS) and negative (dendritic) compartments. The quantification was expressed as the percentage of α1 puncta that contain α2 (α1/2) and the percentage of α2 puncta that contain α1 (α2/1) (n = 4 individual cultures, ***p < 0.001). The raw data are contained in Supplementary Data 4. c) DIV21 mouse neurons were immunostained with antibodies against α1, α2 and VGAT to visualize subunit colocalization at active synapses. Scale bar = 10 μm and 2 μm in cropped images. Error bars represent the SEM.
Fig. 3
Fig. 3. Comparing the proteomes associated with GABAAR subtypes.
a) α1 and α2 containing protein complexes were immunopurified from mouse forebrain plasma membrane fractions. The complexes were resolved by BN-PAGE and the high molecular weight complexes were identified (~700 kDa). These were excised and the proteins identified by label-free quantitative proteomics. The identified proteins in α1 and α2 complexes were compared to control samples, and those proteins significantly enriched were included for downstream analysis. A Venn diagram showing the number of significant proteins unique to α1 or α2 and overlapping proteins (n = 7). The raw data are contained in Supplementary Data 5. b) The lists of significantly enriched unique and overlapping proteins were used to create network diagrams. Known interactions between detected proteins were obtained using stringent, high confidence, direct experimental association parameters from STRINGdb. These were used to construct a network diagram of protein nodes and arrows to indicate known interactions. The node diameter was scaled relative to the SiGi values detected for each protein. An overlay of Gene Ontology (GO) Biological Process terms was used to provide protein classification information (n = 7). c) PCA analysis of each biological replicate for α1 and α2 containing protein complexes. PCA loadings were also included to show the contribution of each protein to the position of samples on the PCA plot (n = 7).
Fig. 4
Fig. 4. Assessing the association of spectrins with GABAARs.
a) Immunopurified α1 and α2 containing GABAARs were resolved by BN-PAGE, transferred, and immunoblotted for α1 and pHα2 subunits to visualize their high molecular weight complexes. These were also probed for the presence of β2 and β4 spectrin to demonstrate that they are also present in complexes with α1 and α2 containing GABAARs. Representative images from an n = 3 experiment. b) GST-fusion proteins for intracellular domains of the α1, α2, and α4 were created along with GST alone. These were used to perform pulldowns from brain plasma membrane lysates and probe for β2 spectrin and β4 spectrin interaction by immunoblot. Equal loading of the fusion proteins was confirmed by colloidal Coomassie staining. Representative images from an n = 3 experiment. The amount of β2 spectrin and β4 spectrin pulled down was quantified by densitometry (n = 3) (*p < 0.05, **p < 0.01, ***p < 0.001). The raw data are contained in Supplementary Data 6. c) Immunocytochemistry for α1, α2, β2 spectrin, and β4 spectrin was carried out in fixed and permeabilized DIV 21 primary cultured pHα2 mouse neurons. Dendritic and AIS regions were imaged by confocal microscopy. Representative images from n = 16 from 4 individual cultures. Scale bar = 10 μm and 2 μm in cropped images. Error bars represent the SEM. The raw membrane/gel images are shown in Supplementary Figure 3.
Fig. 5
Fig. 5. Determining the role that SPBTN1 plays in regulating GABAAR expression levels and synaptic accumulation.
a) Primary cultured pHα2xSPTBN1Flox mouse neurons were infected with either AAV-GFP or AAV-GFP-Cre to create nuclear-restricted GFP-labelled β2 spectrin+/+ or β2 spectrin−/− cultures respectively. At DIV 21 the cells were lysed, the proteins resolved by SDS-PAGE, and immunoblots carried out. Densitometry was carried out to quantify the differences in expression of key proteins between β2 spectrin+/+ or β2 spectrin−/− cultures (Representative images from n = 3, n = 3 for densitometry analysis *p < 0.05, ***p < 0.001). b) Representative images of β2 spectrin+/+ and β2 spectrin−/− DIV21 primary cultured neurons, fixed, permeabilized, and immunostained for VGAT and Gephyrin. Scale bar = 10 μm and 2 μm in cropped images. Synapses were determined by VGAT and Gephyrin colocalization, counted, and normalized to the length of the measured processes (n = 16 from 4 individual cultures, ***p < 0.001). Error bars represent the SEM. The raw data are contained in Supplementary Data 7. The raw membrane/gel images are shown in Supplementary Figure 4.
Fig. 6
Fig. 6. Examining the effects of ablating β2 spectrin expression on GABAAR accumulation at the AIS and dendrites.
a) Representative images of DIV21 β2 spectrin+/+ and β2 spectrin−/− neuronal cultures, fixed, permeabilized and immunostained for α1, α2, and AnkG. The AIS and dendritic regions were determined by AnkG positivity or negativity respectively. Scale bar = 10 μm and 2 μm in cropped images (n = 16 from 4 individual cultures). b) Puncta of α1 and α2 were counted in the AIS and dendritic regions of interest and normalized to the length of the measured processes (n = 16 from 4 individual cultures, ***p < 0.001). Error bars represent the SEM. The raw data are contained in Supplementary Data 8.
Fig. 7
Fig. 7. Determining the effects of β2 spectrin ablation on the properties of inhibitory synaptic currents.
a) Representative mIPSCs from DIV 18–22 neurons cultured from SPTBN1Flox mice infected with AAV-GFP (black) or AAV-GFP-Cre (red) to create Sptbn1+/+ or Sptbn1−/− cultures respectively. b) Bar graphs show average mIPSC peak amplitude (pA), weighted decay tau (ms), and frequency (Hz). Only mIPSC amplitude was significantly larger in Sptbn1−/− neurons (**, significantly different from control, P = 0.03734, n = 5–7 cells). c) Frequency distribution of mIPSC events of different amplitudes (p = 0.02556; n = 5–7 cells). Error bars represent the SEM. The raw data are contained in Supplementary Data 9.

References

    1. Rudolph U, Mohler H. GABA-based therapeutic approaches: GABA(A) receptor subtype functions. Curr. Opin. Pharm. 2006;6:18–23. doi: 10.1016/j.coph.2005.10.003. - DOI - PubMed
    1. Olsen RW, Sieghart W. International Union of Pharmacology. LXX. Subtypes of gamma-aminobutyric acid(A) receptors: classification on the basis of subunit composition, pharmacology, and function. Update Pharm. Rev. 2008;60:243–260. doi: 10.1124/pr.108.00505. - DOI - PMC - PubMed
    1. Sigel E, Steinmann ME. Structure, function, and modulation of GABA(A) receptors. J. Biol. Chem. 2012;287:40224–40231. doi: 10.1074/jbc.R112.386664. - DOI - PMC - PubMed
    1. Benke D, et al. Analysis of the presence and abundance of GABA(A) receptors containing two different types of alpha subunits in murine brain using point-mutated alpha subunits. J. Biol. Chem. 2004;279:43654–43660. doi: 10.1074/jbc.M407154200. - DOI - PubMed
    1. Nusser Z, Sieghart W, Benke D, Fritschy JM, Somogyi P. Differential synaptic localization of two major gamma-aminobutyric acid type A receptor alpha subunits on hippocampal pyramidal cells. P Natl Acad. Sci. USA. 1996;93:11939–11944. doi: 10.1073/pnas.93.21.11939. - DOI - PMC - PubMed

Publication types

MeSH terms