. 2023 Apr;28(4):1747-1769.
doi: 10.1038/s41380-022-01937-5. Epub 2023 Jan 6.

Impaired OTUD7A-dependent Ankyrin regulation mediates neuronal dysfunction in mouse and human models of the 15q13.3 microdeletion syndrome

Affiliations

Impaired OTUD7A-dependent Ankyrin regulation mediates neuronal dysfunction in mouse and human models of the 15q13.3 microdeletion syndrome

Brianna K Unda et al. Mol Psychiatry. 2023 Apr.

Abstract

Copy number variations (CNVs) are associated with psychiatric and neurodevelopmental disorders (NDDs), and most, including the recurrent 15q13.3 microdeletion disorder, have unknown disease mechanisms. We used a heterozygous 15q13.3 microdeletion mouse model and patient iPSC-derived neurons to reveal developmental defects in neuronal maturation and network activity. To identify the underlying molecular dysfunction, we developed a neuron-specific proximity-labeling proteomics (BioID2) pipeline, combined with patient mutations, to target the 15q13.3 CNV genetic driver OTUD7A. OTUD7A is an emerging independent NDD risk gene with no known function in the brain, but has putative deubiquitinase function. The OTUD7A protein-protein interaction network included synaptic, axonal, and cytoskeletal proteins and was enriched for ASD and epilepsy risk genes (Ank3, Ank2, SPTAN1, SPTBN1). The interactions between OTUD7A and Ankyrin-G (Ank3) and Ankyrin-B (Ank2) were disrupted by an epilepsy-associated OTUD7A L233F variant. Further investigation of Ankyrin-G in mouse and human 15q13.3 microdeletion and OTUD7AL233F/L233F models revealed protein instability, increased polyubiquitination, and decreased levels in the axon initial segment, while structured illumination microscopy identified reduced Ankyrin-G nanodomains in dendritic spines. Functional analysis of human 15q13.3 microdeletion and OTUD7AL233F/L233F models revealed shared and distinct impairments to axonal growth and intrinsic excitability. Importantly, restoring OTUD7A or Ankyrin-G expression in 15q13.3 microdeletion neurons led to a reversal of abnormalities. These data reveal a critical OTUD7A-Ankyrin pathway in neuronal development, which is impaired in the 15q13.3 microdeletion syndrome, leading to neuronal dysfunction. Furthermore, our study highlights the utility of targeting CNV genes using cell type-specific proteomics to identify shared and unexplored disease mechanisms across NDDs.


Conflict of interest statement

The authors declare no competing interests.

Figures

Fig. 1
Fig. 1. Overview of study workflow.
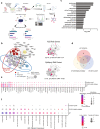
a 15q13.3 microdeletion locus and driver gene, OTUD7A (red font). Mouse and human 15q13.3 microdeletion and OTUD7A patient mutation models show abnormal neuronal morphology and electrical activity. b A BioID2 proximity-labeling proteomics screen of OTUD7A identified the enrichment of proteins localized to the postsynaptic density, cytoskeleton and axon, which are disrupted by OTUD7A mutations. In addition, the OTUD7A PPI network was enriched for known NDD-associated proteins. Top BioID2 interactors (including Ankyrin-G) were validated via co-immunoprecipitation, protein levels, ubiquitination status and protein stability in mouse and human models, and genetic rescue of morphological abnormalities in the 15q13.3 microdeletion background.
Fig. 2
Fig. 2. Df(h15q13)/+ cortical neurons and human patient iNeurons show impairments in synaptic morphology and persistent functional deficits.
a Raster plots of MEA recordings of neural network activity from DIV 24 WT and Df(h15q13)/+ mouse cortical neurons. n = 77 wells WT, 65 wells Df(h15q13)/+ from 3 mouse cortical cultures on 3 MEA plates. b Weighted mean firing rate. Repeated measures two-way ANOVA with Sidak’s post hoc test, *p < 0.05, **p < 0.01, ****p < 0.0001; Interaction: F (7, 980) = 3.950, p = 0.0003; DIV: F (7, 980) = 87.98, p < 0.0001; Genotype: F (1, 140) = 30.64, p < 0.0001; Subject: F (140, 980) = 4.436, p < 0.0001. c Network burst frequency. Repeated measures two-way ANOVA with Sidak’s post hoc test, **p < 0.01, ***p < 0.001, ****p < 0.0001; Interaction: F (7, 980) = 4.341, p < 0.0001; DIV: F (7, 980) = 115.2, p < 0.0001; Genotype: F (1, 140) = 40.27; Subject: F (140, 980) = 2.78, p < 0.0001. d Schematic of the human OTUD7A protein showing the location of the L233F variant. e Representative confocal images from co-transfected DIV 14 WT and Df(h15q13)/+ mouse cortical neurons; 20× objective, scale bar 100 μm. f, g Sholl analysis. n = 11 neurons WT + mCherry, 10 neurons [Df(h15q13)/+] + mCherry, 8 neurons [Df(h15q13)/+] + WT OTUD7A-mCherry, 10 neurons [Df(h15q13)/+] + OTUD7A L233F. Samples were taken from 3 mouse cultures. f Two-way ANOVA with Dunnett’s post hoc test; ****p < 0.0001; Interaction: F (57, 700) = 0.505, p = 0.9991; DIV: F (19, 700) = 10.54, p < 0.0001; Distance: F (3, 700) = 57.12, p < 0.0001. g Total number of dendritic intersections. One-way ANOVA with Dunnett’s post hoc test, **p < 0.01, F (3, 35) = 5.775, p = 0.0026. h Representative confocal images of dendritic segments from co-transfected DIV 14 WT and Df(h15q13)/+ mouse cortical neurons; 63× objective, scale bar 2 μm. i Mushroom spine density. n = 8 neurons WT + mCherry, 12 neurons [Df(h15q13)/+] + mCherry, 9 neurons [Df(h15q13)/+] + WT OTUD7A-mCherry, 10 neurons [Df(h15q13)/+] + OTUD7A L233F. Samples were taken from 3 mouse cultures. *p < 0.05, **p < 0.01; one-way ANOVA with Dunnett’s post hoc test; F (3, 35) = 6.423, p = 0.0014. j Pedigree of Family 1 and k the OTUD7A L233F Family. l Representative western blot (left) and quantification (right) of OTUD7A levels in iNeurons; n = 3 separate Ngn2/Rtta transductions per line; one-way ANOVA with Dunnett’s post hoc test, *p < 0.05, F (2.6) = 7.921, p = 0.0207. m Raster plots of MEA recordings of neural network activity from DIV 89 Family 1 and OTUD7AL233F/L233F human iNeurons. Control (Fam 1) n = 29 wells, 15q13.3 HET (Fam 1) n = 29 wells, OTUD7AL233F/L233F n = 30 wells from two separate NGN2/Rtta transductions. n Weighted mean firing rate. Repeated measures two-way ANOVA with Dunnett’s post hoc test; Interaction: F (42, 1785) = 17.59, p < 0.0001; DIV: F (2.925, 248.6) = 108.2, p < 0.0001; Genotype: F (2.85) = 15.96, p < 0.0001; Subject: F (85, 1785) = 16.12, p < 0.0001. o Network burst frequency. Repeated measures two-way ANOVA with Dunnett’s post hoc test; *p < 0.05, **p < 0.01, ***p < 0.001, ****p < 0.0001. p Representative images and q sholl analysis of MAP2-positive Family 1 and OTUD7AL233F/L233F proband human iNeurons; 20× objective, scale bar 100 μm. Control n = 33 neurons, 15q13.3 HET n = 31 neurons, OTUD7AL233F/L233F n = 38; ***p < 0.001, two-way ANOVA with Dunnett’s post hoc test; Interaction: F (68, 3465) = 1.943, p < 0.0001; Distance from soma: F (34, 3465) = 53.30, p < 0.0001; Genotype: F (2, 3465) = 200.2, p < 0.0001.
Fig. 3
Fig. 3. Neuron-specific BioID2 reveals an OTUD7A PPI network enriched for postsynaptic and axonal proteins which is impacted by patient mutations.
a Workflow for lentiviral neuron-specific BioID2 experiment in mouse cortical neurons. b Left: STRING analysis of functional interactions for WT OTUD7A BioID2. proteins with SAINT scores ≥ 0.6. Node size represents significance (SAINT SCORE). Node colors represent AIS (including those shared with AIS-BioID2 study by Hamdan et al. [73]): red, postsynapse: blue, and proteins that are both AIS and postsynaptic: purple. Data shown are from 3 biological replicates. Right: enrichment of ASD (SFARI Category 1/2/Syndromic) and epilepsy genes from Wang et al. [63]. Fisher’s exact test. c Top 15 significant GO: cellular component terms from functional enrichment analysis of the OTUD7A-BioID2 hits. p < 0.05, Functional enrichment analysis was performed using gProfiler with Bonferroni correction for multiple testing. A custom background statistical domain scope was used (Sharma et al., mouse whole brain proteome) [62]. d Venn diagram of shared protein interactors between WT OTUD7A, OTUD7A N492_K494del and OTUD7A L233F. e Dotplot showing SAINT SCORE and average abundance of WT OTUD7A and OTUD7A patient mutation interactors. f Dotplot of enriched GO: cellular component pathways in WT OTUD7A and patient mutation BioID2 hits.
Fig. 4
Fig. 4. Ankyrin-G interacts with OTUD7A and its levels are decreased in Df(h15q13)/+ mouse brain.
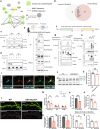
a STRING analysis of functional network interactions for Ankyrin-G-190-BioID2 (from 3 biological replicates). Green nodes represent proteins shared with the OTUD7A-BioID2 list. b Venn diagram of shared protein interactors between Ankyrin-G-190 and OTUD7A. c Co-immunoprecipitation of OTUD7A-FLAG with Ankyrin-G-190-EGFP and d Ankyrin-B-2XHA from co-transfected HEK293 FT cells. e Co-immunoprecipitation of endogenous 3XFLAG-OTUD7A with Ankyrin-G and Ankyrin-B in P14 C57BL/6-3XFLAG-OTUD7A mouse cortex. f Schematic of mouse Ankyrin-G showing protein domains. g Domain mapping of Ankyrin-G-OTUD7A interaction from co-transfected HEK293 FT cells expressing HA-Ankyrin-G domains and OTUD7A-FLAG or h the catalytic domain of OTUD7A (OTUD7A183-449-FLAG). i Representative image of DIV 14 C57BL/6J-3XFLAG-OTUD7A mouse cortical neurons stained for Ankyrin-G, FLAG, and MAP2. 63× objective; Top, scale bar = 20 μm; bottom (Inset zoom), scale bar = 5 μm. j Representative western blot and k protein levels of Ankyrin-G-190 in P14 cortex from WT and Df(h15q13)/+ mice; WT: n = 10 cortices, Df(h15q13)/+: n = 11 cortices; **p < 0.01; Student’s t-test, t = 3.070, df = 19. l Representative SIM images from DIV 17 WT and Df(h15q13)/+ cortical neurons; Scale bar = 5 μm. m Spine morphology analysis. n = 13 WT and 18 Df(h15q13)/+ cortical neurons (one dendrite per neuron). *p < 0.05, Unpaired t-test (two tailed); Mushroom: t = 2.301, df = 29, p = 0.0288; Thin: t = 0.4023, df = 29, p = 0.6904; Stubby: t = 0.9324, df = 29, p = 0.3588. n Mushroom spine head. n = 322 spines WT, n = 350 spines Df(h15q13)/+. ****p < 0.0001, Mann–Whitney test two-tailed (approximate), U = 40466; WT: median = 0.4975, Df(h15q13)/+: median = 0.3680. o Proportion of Ankyrin-G (+) mushroom spines. **p < 0.01, Student’s unpaired t-test; t = 3.196, df = 29. p Ankyrin-G puncta number in mushroom spine heads. n = 322 spines WT, n = 350 spines Df(h15q13)/+. ****p < 0.0001, Mann–Whitney test two-tailed (approximate), U = 44355; WT: median = 1, n = 322; Df(h15q13)/+ median = 0, n = 350. q Ankyrin-G total nanodomain area in mushroom spines. Mann–Whitney test two-wailed (approximate), p = 0.2204, U = 18693; WT: median = 0.046, n = 244 spines; Df(h15q13)/+: median = 0.052, n = 165 spines. r Ankyrin-G puncta density in dendrites. ***p < 0.001, Mann–Whitney test two-tailed, p = 0.004, U = 32; WT: median = 1.548, n = 13; Df(h15q13)/+: median + 0.8897, n = 18. s Ankyrin-G puncta size in dendrites. Values are the average puncta size per dendrite. Mann–Whitney test two-tailed (Exact), p = 0.079, U = 73; WT: median = 0.03100, n = 13; Df(h15q13)/+: median = 0.02750, n = 18.
Fig. 5
Fig. 5. Ankyrin-G displays decreased levels and altered protein stability and ubiquitination in human 15q13.3 microdeletion and OTUD7AL233F/L233F patient iNeurons.
a SIM imaging of Venus-transfected PNI day 28 Family 1 and OTUD7AL233F/L233F iNeurons stained for Ankyrin-G. Top: Scale bar = 10 µm, Middle: Scale bar = 5 µm, Bottom Scale bar = 1 µm. b Ankyrin-G intensity in the dendrites (**p < 0.01; one-way ANOVA with Dunnett’s post hoc test; F (2, 63) = 5.261, p = 0.0077), c spine morphology (**p < 0.01, ****p < 0.0001; Mushroom: Kruskal–Wallis test with Dunn’s post hoc test, p < 0.0001 (approximate), Kruskal–Wallis statistic = 19.20; Filopodia: one-way ANOVA with Dunnett’s post hoc test, F (2, 63) = 0.9011, p = 0.4113; Stubby: Kruskal–Wallis test with Dunn’s post hoc test, p = 0.5212 (approximate), Kruskal–Wallis statistic = 1.303. Control (Fam 1) n = 20 dendrites, 15q13.3 HET (Fam 1) n = 27 dendrites, OTUD7AL233F/L233F n = 19 dendrites. d mushroom spine head area (one-way ANOVA with Bonferroni’s post hoc test; F (2, 148) = 0, 0 = 0.9658. e number of Ankyrin-G puncta in mushroom spine heads (Kruskal–Wallis test with Dunn’s post hoc test; p = 0.0167 (approximate Kruskal–Wallis statistic: 8.189) and f Ankyrin-G nanodomain area in mushroom spine heads. One-way ANOVA with Dunnett’s post hoc test; F (2, 149) = 10.06, p < 0.0001); Control (Fam 1): n = 84 spines, 15q13.3 HET (Fam 1) n = 53 spines, OTUD7AL233F/L233F n = 15 spines *p < 0.05, **p < 0.01, ***p < 0.001. g Confocal images of Family 1 and OTUD7AL233F/L233F PNI day 28 iNeurons stained for MAP2 and Ankyrin-G. Scale bar = 50 µm. h Ankyrin-G intensity (mean gray value) in the AIS. ****p < 0.0001, two-way ANOVA with Dunnett’s post hoc test; Interaction: F (160, 6196) = 1.891, p < 0.0001; Distance from soma: F (80, 6196) = 8.481, p < 0.0001; Genotype: F (2, 6196) = 69.18, p < 0.0001. i Western blot and j analysis of Ankyrin-G in PNI day 7 human iNeurons from Family 1 and OTUD7AL233F/L233F. n = 5 separate Ngn2/Rtta transductions per line, *p < 0.05, one-way ANOVA with Dunnett’s post hoc test, F (2, 12) = 3.317, p = 0.0713). k Western blot of time-course of Ankyrin-G levels after cycloheximide (20 µg/mL) treatment. l Kinetics of Ankyrin-G protein stability in Family 1 and OTUD7AL233F/L233F induced neurons. n = 3 NGN2 transductions per condition; ***p < 0.001; simple linear regression followed by comparison of slopes by one-way ANOVA with Dunnett’s post hoc test; F (2, 30) = 10.99, p = 0.0003. m TUBE pulldown from Family 1 and OTUD7AL233F/L233F human iNeurons probed for Ankyrin-G and Ubiquitin. n Quantification of ubiquitinated Ankyrin-G from TUBE pulldown, normalized to the levels of Ankyrin-G in the input (whole lysate). n = 6 wells Control, 5 wells 15q13.3 microdeletion, 5 wells OTUD7AL233F/L233F; *p < 0.05, one-way ANOVA with Dunnett’s post hoc test, F (2, 13) = 5.238, p = 0.0215.
Fig. 6
Fig. 6. Human 15q13.3 microdeletion patient iNeurons display impairments in axon growth and intrinsic excitability.
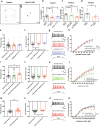
a Confocal images of PNI day 10 Venus-transfected Control and 15q13.3 HET iNeurons. 20× objective, tiled and stitched. Scale bar = 100 µm. b Quantification of axon length in Family 1 and OTUD7AL233F/L233F iNeurons. n = 39 neurons Control Fam 1, n = 34 neurons 15q13.3 HET Fam 1, n = 26 neurons OTUD7AL233F/L233F; *p < 0.05, one-way ANOVA with Dunnett’s post hoc test, F (2, 96) = 3.306, p = 0.0409. c Quantification of axon length in Family 2 iNeurons. n = 23 neurons Control Fam 2, n = 34 neurons 15q13.3 HET Fam 2 carrier, and n = 28 neurons 15q13.3 HET proband Fam 2. ***p < 0.001, one-way ANOVA with Dunnett’s post hoc test, F (2, 82) = 7.021, p = 0.0015. d Quantification of axon length in Family 3 iNeurons. n = 24 neurons Control Fam 3, n = 13 15q13.3 HET. *p < 0.05, Unpaired t-test (two-tailed), t = 2.614, df = 35, p = 0.0131. e, f Family 1 and OTUD7AL233F/L233F iNeuron intrinsic membrane properties. e Rheobase (Kruskal–Wallis test with Dunn’s post hoc test; Kruskal–Wallis statistic = 0.1493, p = 0.9281 approximate; Control (Fam 1): n = 32 neurons, 15q13.3 HET (Fam 1): n = 38 neurons, OTUD7AL233F/L233F: n = 24 neurons) and f action potential threshold (**p < 0.01, one-way ANOVA with Dunnett’s post hoc test; F (2, 93) = 4.372, p = 0.0153); Control (Fam 1): n = 32 neurons, 15q13.3 HET (Fam 1): n = 38 neurons, OTUD7AL233F/L233F: n = 23 neurons. g Representative traces of action potentials evoked by 60 pA of injected current in PNI day 26–28 Family 1 and OTUD7AL233F/L233F patient human iNeurons. h Repetitive firing properties of PNI day 26–28 Family 1 and OTUD7AL233F/L233F patient human iNeurons. Two-way ANOVA with Dunnett’s post hoc test. Interaction: F (14, 325) = 0.4370, p = 0.9620; Injected current: F (7, 325) = 74.84, p < 0.0001; Genotype: F (2, 325) = 0.2437, p = 0.7838. i, j Family 2 Intrinsic membrane properties. i Rheobase (*p < 0.05, one-way ANOVA with Tukey’s post hoc test, F (2, 73) = 4.730, p = 0.0117) and j action potential threshold (one-way ANOVA with Tukey’s post hoc test, F (2, 68) = 0.3923, p = 0.6770). Control (Fam 2): n = 24 neurons, 15q13.3 HET Carrier (Fam 2): n = 26 neurons, 15q13.3 HET Proband (Fam 2): n = 26 neurons. k Representative traces of action potentials evoked by 100 pA of injected current in PNI day 26–28 Family 2 human iNeurons. l Repetitive firing properties of PNI day 26–28 Family 2 human iNeurons. *p < 0.05, **p < 0.01, ***p < 0.001, two-way ANOVA with Dunnett’s post hoc test. Interaction: F (24, 666) = 1.253, p = 0.1879; Injected current: F (12, 666) = 75.03, p < 0.0001; Genotype: F (2, 666) = 32.16, p < 0.0001. Control (Fam 2): n = 24 neurons, 15q13.3 HET Carrier (Fam 2): n = 25 neurons, 15q13.3 HET Proband (Fam 2): n = 23 neurons. m, n Family 3 Intrinsic membrane properties. m Rheobase (*p < 0.05, Mann–Whitney test two-tailed, Mann–Whitney U = 271, p = 0.0180; Control: 110.0 median, n = 29 neurons, 15q13.3 HET: 120.0 median, n = 29 neurons) and n action potential threshold (*p < 0.05, unpaired t-test two-tailed; t = 2.347, df = 57, p = 0.0224; Control: n = 30 neurons, 15q13.3 HET: n = 29 neurons). o Representative traces of action potentials evoked by 100 pA of injected current in PNI day 26–28 Family 3 human iNeurons. p Repetitive firing properties of PNI day 26–28 Family 3 human iNeurons. Two-way ANOVA with Sidak’s post hoc test; Interaction: F (15, 603) = 0.7090, p = 0.7766; Injected current: F (15, 603) = 78.61, p < 0.0001; Genotype: F (1, 603) = 21.41, p < 0.0001.
Fig. 7
Fig. 7. Ectopic expression of OTUD7A or Ankyrin-G rescues morphological impairments in human 15q13.3 microdeletion patient iNeurons or Df(h15q13)/+ cortical neurons.
a Family 1 control and 15q13.3 HET iNeurons were co-transfected with Venus and mCherry or Venus and OTUD7A-mCherry at PNI day 21 and fixed for morphological analysis. b Representative confocal images of co-transfected Control and 15q13.3 HET Family 1 iNeurons, 20× objective, scale bar = 100 µm. c Sholl analysis. n = 44 neurons Control + mCherry, n = 58 neurons 15q13.3 HET + mCherry, n = 45 neurons 15q13.3 HET + OTUD7A-mCherry; ****p < 0.0001, two-way ANOVA with Tukey’s post hoc test. Interaction: F (38, 2878) = 1.140, p = 0.2565; Distance from soma: F (19, 2878) = 14.99, p < 0.0001; Condition: F (2, 2878) = 43.39, p < 0.0001. d Df(h15q13)/+ cortical neurons were transduced with equal MOIs of TurboGFP, TurboGFP-P2A-WT OTUD7A-3XFLAG, TurboGFP-P2A- OTUD7A N492_K494-del-3XFLAG or TurboGFP-P2A-OTUD7A L233F-3XFLAG lentivirus at DIV 14 and lysed for western blotting at DIV 21. e Representative western blot and f levels of Ankyrin-G-270 (***p < 0.001, ****p < 0.0001, one-way ANOVA with Dunnett’s post hoc test, F (3, 12) = 20.96, p < 0.0001). g Ankyrin-G-190 (*p < 0.05, one-way ANOVA with Dunnett’s post hoc test, F (3, 12) = 3.169, p = 0.0638 and h OTUD7A-FLAG (*p < 0.05, one-way ANOVA with Dunnett’s post hoc test, F (2, 9) = 10.63, p = 0.0043) in transduced Df(h15q13)/+ primary cortical neurons; n = 4 transductions per genotype in 4 mouse cultures. i WT and Df(h15q13)/+ mouse cortical neurons were co-transfected with mCherry and EGFP or mCherry and Ankyrin-G-190-EGFP at DIV 7 and fixed at DIV 14 for morphological analysis. j Representative images from DIV 14 WT and Df(h15q13)/+ cortical neurons co-transfected with mCherry and EGFP or Ankyrin-G-190-EGFP; 20× objective, scale bar 100 μm. k Sholl analysis. n = 14 neurons WT + EGFP, n = 15 neurons [Df(h15q13)/+] + EGFP, n = 13 neurons [Df(h15q13)/+] + Ankyrin-G-190-EGFP, n = 13 neurons WT + Ankyrin-G-190-EGFP, from 3 mouse cultures. ***p < 0.001, ****p < 0.000, two-way ANOVA with Tukey’s post hoc test. Interaction: F (57, 1020) = 1.024, p = 0.4272; DIV: F (19, 1020) = 38.23, p < 0.0001; Genotype: F (3, 1020) = 16.88, p < 0.0001. l Representative images of dendritic segments from co-transfected DIV 14 WT and Df(h15q13)/+ cortical neurons; 63× objective, scale bar 2 μm. m Mushroom spine density. **p < 0.01, ****p < 0.0001; one-way ANOVA with Tukey’s post hoc test; F (3, 44) = 13.04, p < 0.0001. n Analysis of spine type proportions. n = 12 neurons per condition from 3 mouse cultures. Two-way ANOVA with Dunnett’s post hoc test. Interaction: F (9, 176) = 4.682, p < 0.0001; Condition: F (3, 176) = 0.001824, p = 0.9999; Spine type: F (3, 176) = 146.5, p < 0.0001.

Comment in

References

    1. Takumi T, Tamada K. CNV biology in neurodevelopmental disorders. Curr Opin Neurobiol. 2018;48:183–92. doi: 10.1016/j.conb.2017.12.004. - DOI - PubMed
    1. Zarrei M, Burton CL, Engchuan W, Young EJ, Higginbotham EJ, Macdonald JR, et al. A large data resource of genomic copy number variation across neurodevelopmental disorders. NPJ Genom Med. 2019;4:26. - PMC - PubMed
    1. Richter M, Murtaza N, Scharrenberg R, White SH, Johanns O, Walker S, et al. Altered TAOK2 activity causes autism-related neurodevelopmental and cognitive abnormalities through RhoA signaling. Mol Psychiatry. 2019;24:1329–50. doi: 10.1038/s41380-018-0025-5. - DOI - PMC - PubMed
    1. Wesseling H, Xu B, Want EJ, Holmes E, Guest PC, Karayiorgou M, et al. System-based proteomic and metabonomic analysis of the Df(16)A+/− mouse identifies potential miR-185 targets and molecular pathway alterations. Mol Psychiatry. 2017;22:384–95. doi: 10.1038/mp.2016.27. - DOI - PMC - PubMed
    1. Tebbenkamp ATN, Varela L, Choi J, Paredes MI, Giani AM, Song JE, et al. The 7q11.23 protein DNAJC30 interacts with ATP synthase and links mitochondria to brain development. Cell. 2018;175:1088–104.e23. doi: 10.1016/j.cell.2018.09.014. - DOI - PMC - PubMed

Publication types

Supplementary concepts