. 2023 Jan 5;21(1):7.
doi: 10.1186/s12951-022-01763-5.

NAMPT encapsulated by extracellular vesicles from young adipose-derived mesenchymal stem cells treated tendinopathy in a "One-Stone-Two-Birds" manner

Affiliations

NAMPT encapsulated by extracellular vesicles from young adipose-derived mesenchymal stem cells treated tendinopathy in a "One-Stone-Two-Birds" manner

Guanghao Wu et al. J Nanobiotechnology. .

Abstract

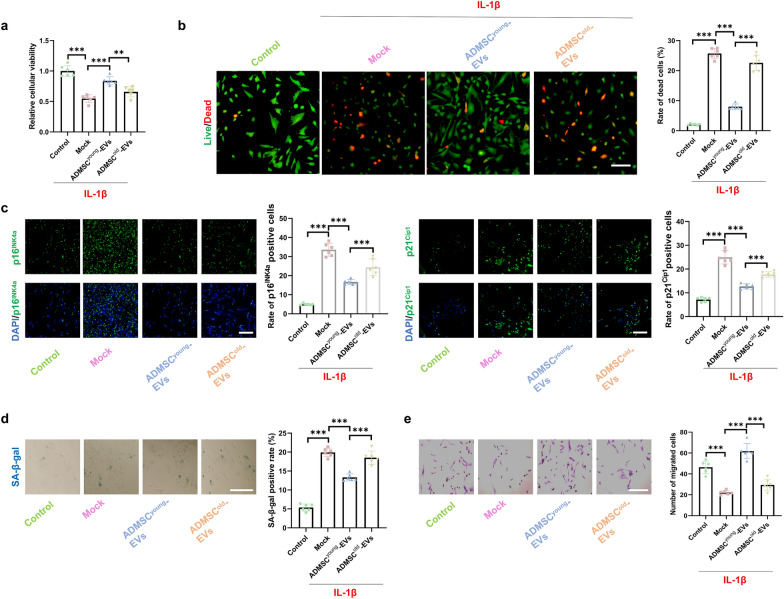
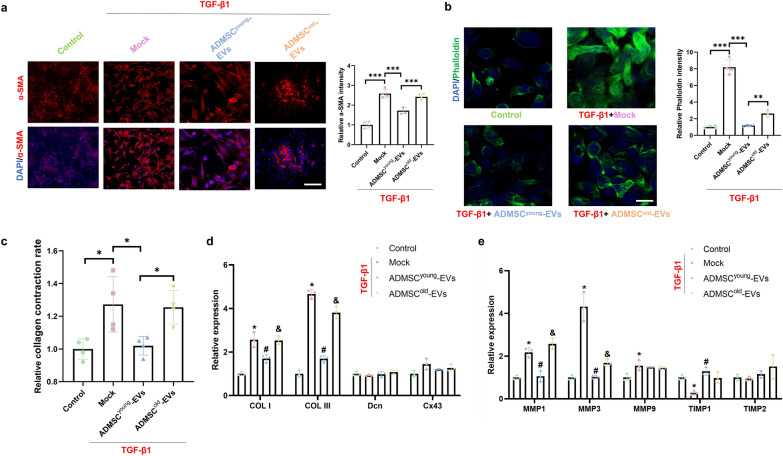
Background: Tendinopathy is the leading sports-related injury and will cause severe weakness and tenderness. Effective therapy for tendinopathy remains limited, and extracellular vesicles (EVs) derived from adipose tissue-derived mesenchymal stem cells (ADMSCs) have demonstrated great potential in tendinopathy treatment; however, the influence of aging status on EV treatment has not been previously described.

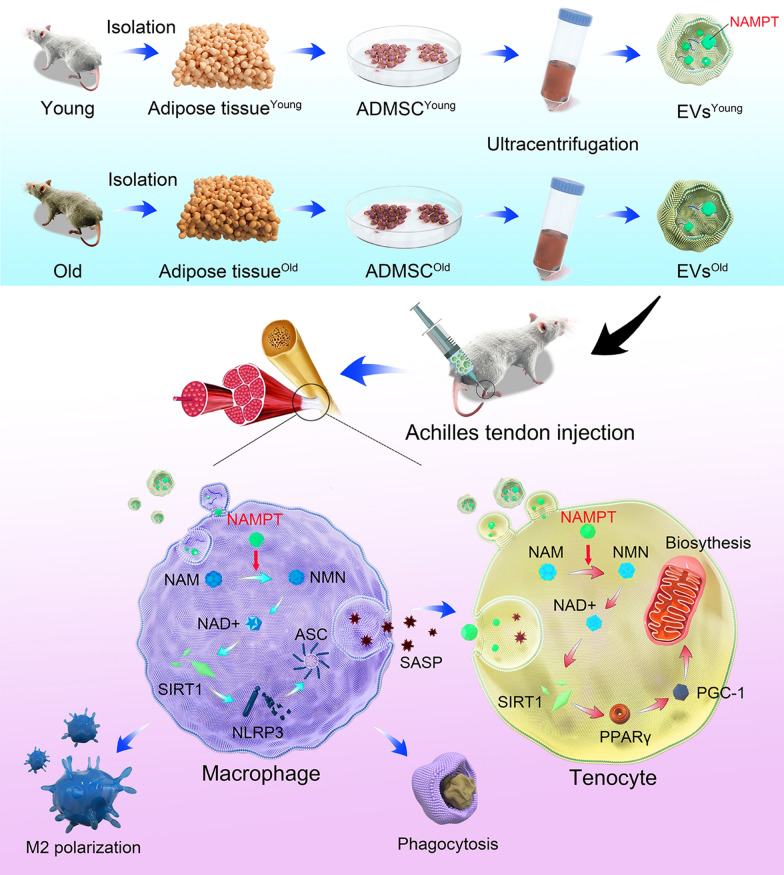
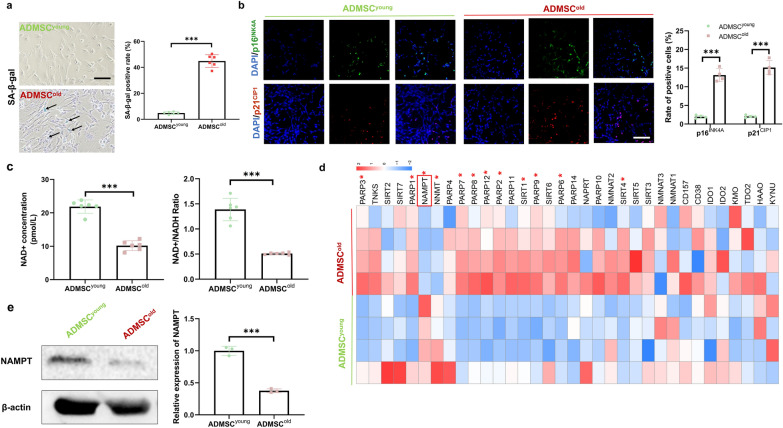
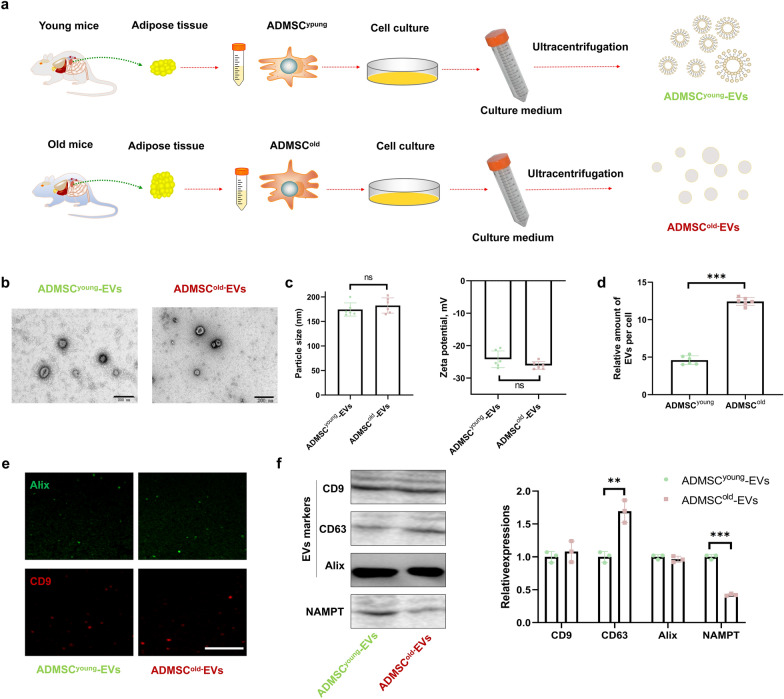
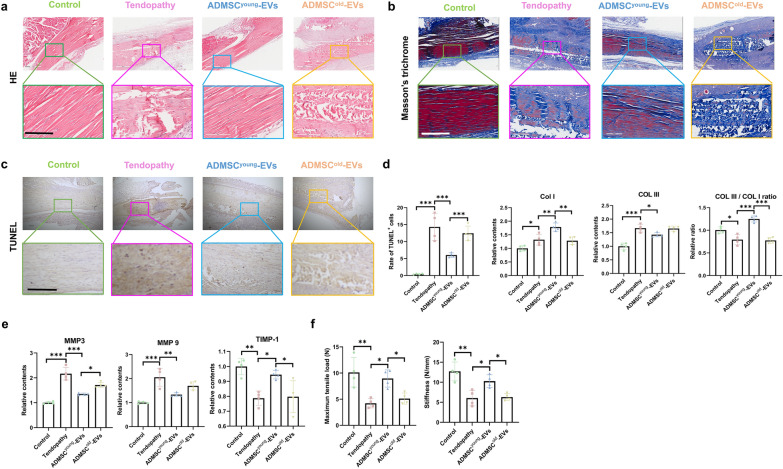
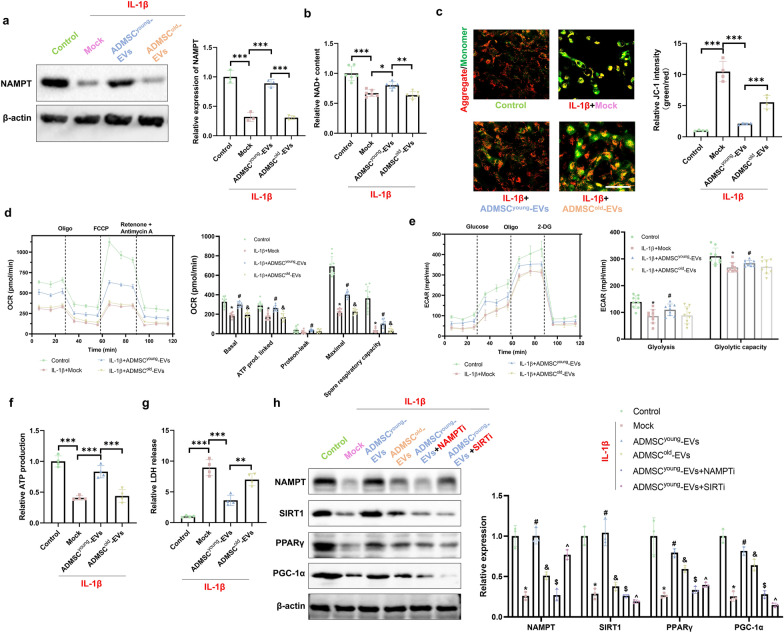
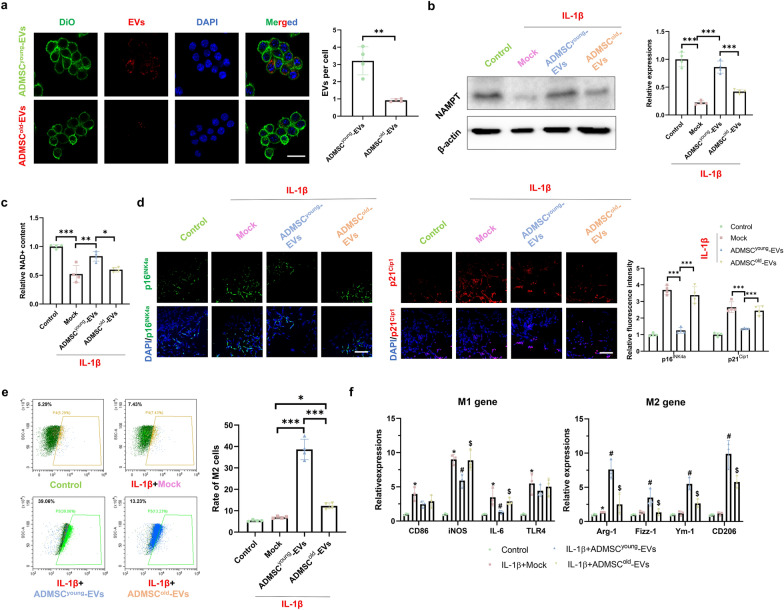
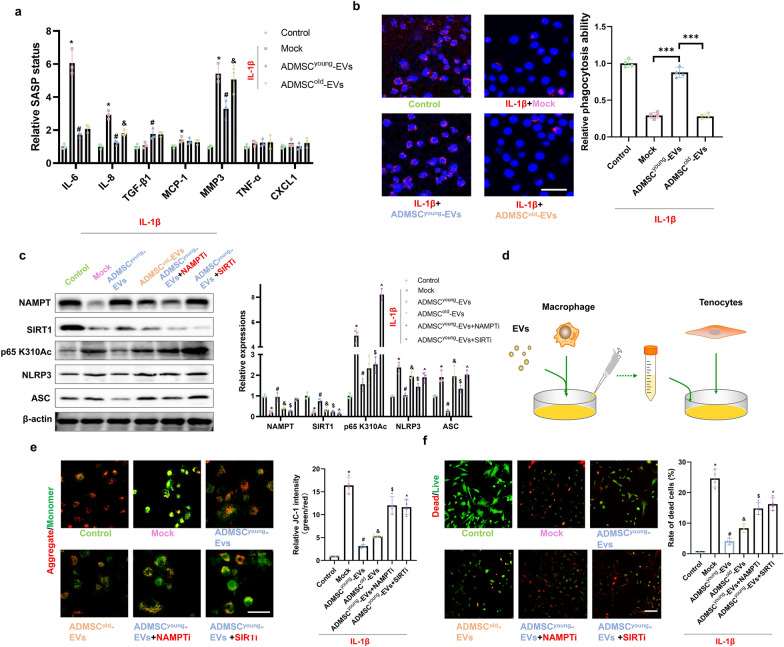
Results: In this study, it was found that ADMSCs derived from old mice (ADMSCold) demonstrated remarkable cellular senescence and impaired NAD+ metabolism compared with ADMSCs derived from young mice (ADMSCyoung). Lower NAMPT contents were detected in both ADMSCold and its secreted EVs (ADMSCold-EVs). Advanced animal experiments demonstrated that ADMSCyoung-EVs, but not ADMSCold-EVs, alleviated the pathological structural, functional and biomechanical properties in tendinopathy mice. Mechanistic analyses demonstrated that ADMSCyoung-EVs improved cell viability and relieved cellular senescence of tenocytes through the NAMPT/SIRT1/PPARγ/PGC-1α pathway. ADMSCyoung-EVs, but not ADMSCold-EVs, promoted phagocytosis and M2 polarization in macrophages through the NAMPT/SIRT1/Nf-κb p65/NLRP3 pathway. The macrophage/tenocyte crosstalk in tendinopathy was influenced by ADMSCyoung-EV treatment and thus it demonstrated "One-Stone-Two-Birds" effects in tendinopathy treatment.

Conclusions: This study demonstrates an effective novel therapy for tendinopathy and uncovers the influence of donor age on curative effects by clarifying the detailed biological mechanism.

Keywords: Adipose tissue-derived mesenchymal stem cells; Extracellular vesicles; Macrophage; NAD+ metabolism; Tendinopathy.


Conflict of interest statement

The authors declare that they have no known competing financial interests or personal relationships that could have appeared to influence the work reported in this paper.

Figures

Fig. 1
Fig. 1
The illustration of "One-Stone-Two-Birds" strategy
Fig. 2
Fig. 2
ADMSCold demonstrated significant cellular senescence and impaired NAD+ metabolism. a SA-β-gal activity and the percentages of SA-β-gal-positive cells in ADMSCyoung and ADMSCold. Scale bar = 200 μm, n = 6. b Immunofluorescence staining of p16INK4A (green), p21CIP1 (red) and nuclear (DAPI, blue) in cultured ADMSCyoung and ADMSCold. Scale bar = 200 μm. Quantification of the relative rate of positive cells was performed, n = 6. c NAD+ concentrations and NAD+/NADH ratios in ADMSCyoung and ADMSCold, n = 6. d The relative expression of NAD+ metabolism-related genes by RT‒PCR in ADMSCyoung and ADMSCold and their expression patterns were visualized by a heatmap. Low expression is marked in blue, and high expression is marked in red. Red * indicates significantly different genes, n = 3. The red box highlights the target gene NAMPT, which was used in an advanced study. (e) Western blot analysis and quantification of the expression of NAMPT proteins in ADMSCyoung and ADMSCold, n = 3. Data are presented as the mean ± SD (***: P < 0.001)
Fig. 3
Fig. 3
The NAMPT level was lower in isolated ADMSCold-EVs than in ADMSCyoung-EVs. a Schematic diagram of the isolation of ADMSCyoung-EVs and ADMSCold-EVs. b Morphological analysis of ADMSCyoung-EVs and ADMSCold-EVs by TEM. Scale bar = 200 nm. c Size distribution and zeta potential of ADMSCyoung-EVs and ADMSCold-EVs, n = 6. d Relative amount of secreted EVs in ADMSCyoung and ADMSCold, n = 6. e Immunofluorescence staining of Alix (green) and CD9 (red) in ADMSCyoung-EVs and ADMSCold-EVs. Scale bar = 50 μm. f Western blot analysis and quantification of the expression of CD9, CD63, and Alix proteins as well as NAMPT in ADMSCyoung-EVs and ADMSCold-EVs, n = 3. Data are presented as the mean ± SD (ns: no significance; **: P < 0.01; ***: P < 0.001)
Fig. 4
Fig. 4
ADMSCyoung-EVs, but not ADMSCold-EVs, alleviated the pathological structural, functional and biomechanical properties in tendinopathy. a H&E staining of tendon tissues in the control, tendinopathy, tendinopathy with ADMSCyoung-EVs and tendinopathy with ADMSCold-EVs treatment groups 4 weeks after surgery. Scale bar = 200 μm, n = 4. b Masson’s trichrome staining of tendon tissues of the control, tendinopathy, tendinopathy with ADMSCyoung-EVs and tendinopathy with ADMSCold-EVs treatment groups 4 weeks after surgery. The collagen fibers were stained red, and the collagen matrix disruptions were stained blue. Scale bar = 200 μm, n = 4. c TUNEL assay of the control, tendinopathy, tendinopathy with ADMSCyoung-EVs and tendinopathy with ADMSCold-EVs treatment group 4 weeks after surgery. Scale bar = 200 μm. The rate of TUNEL-positive cells was analyzed, n = 4. d The relative expression of Col I and Col III and the Col III/Col I ratio by ELISAs of tendon tissues of the control, tendinopathy, tendinopathy with ADMSCyoung-EVs and tendinopathy with ADMSCold-EVs treatment groups 4 weeks after surgery, n = 4. e The relative expression of MMP3, MMP9 and TIMP-1 by ELISAs of tendon tissues of the control, tendinopathy, tendinopathy with ADMSCyoung-EVs and tendinopathy with ADMSCold-EVs treatment groups 4 weeks after surgery. f The biomechanical properties, including the maximum tensile load and stiffness of tendon tissues of the control, tendinopathy, tendinopathy with ADMSCyoung-EVs and tendinopathy with ADMSCold-EVs treatment groups 4 weeks after surgery, n = 4. Data are presented as the mean ± SD (*: P < 0.05; **: P < 0.01; ***: P < 0.001)
Fig. 5
Fig. 5
ADMSCyoung-EVs, but not ADMSCold-EVs, alleviated cell death and cellular senescence of tenocytes treated with IL-1β. a The cellular viability in the control, IL-1β, IL-1β + ADMSCyoung-EVs and IL-1β + ADMSCold-EVs tenocyte groups, n = 6. b Live/dead assay and rate of dead cells in the control, IL-1β, IL-1β + ADMSCyoung-EVs and IL-1β + ADMSCold-EVs tenocytes groups, n = 6. Live cells are marked green, and dead cells are marked red. Scale bar = 50 μm, n = 6. c Immunofluorescence staining of p16INK4A (green), p21CIP1 (green) and nuclear (DAPI, blue) in the control, IL-1β, IL-1β + ADMSCyoung-EVs and IL-1β + ADMSCold-EVs tenocytes groups. Scale bar = 200 μm, n = 6. d SA-β-gal activity and the percentages of SA-β-gal-positive cells in ADMSCyoung and ADMSCold. Scale bar = 50 μm, n = 6. e Images and quantification of migrated tenocytes in the control, IL-1β, IL-1β + ADMSCyoung-EV and IL-1β + ADMSCold-EV groups. Scale bar = 50 μm, n = 6. Data are presented as the mean ± SD (***: P < 0.001)
Fig. 6
Fig. 6
ADMSCyoung-EVs, but not ADMSCold-EVs, alleviated pathological ECM remodeling of tenocytes induced by TGF-β1. a Immunofluorescence staining and relative intensity of α-SMA (red) and nuclei (DAPI, blue) in the control, TGF-β1, TGF-β1 + ADMSCyoung-EV and TGF-β1 + ADMSCold-EV tenocyte groups. Scale bar = 200 μm, n = 4. b Immunofluorescence staining and relative intensity of phalloidin (green) and nuclei (DAPI, blue) in the control, TGF-β1, TGF-β1 + ADMSCyoung-EV and TGF-β1 + ADMSCold-EV tenocyte groups. Scale bar = 200 μm, n = 4. c Relative collagen contraction rate in the control, TGF-β1, TGF-β1 + ADMSCyoung-EV and TGF-β1 + ADMSCold-EV tenocyte groups, n = 4. de Relative expression of collagen formation- and degradation-related genes in the control, TGF-β1, TGF-β1 + ADMSCyoung-EV and TGF-β1 + ADMSCold-EV tenocyte groups, n = 3. Data are presented as the mean ± SD (*: control vs. TGF-β1 treatment; #: TGF-β1 treatment vs. TGF-β1 + ADMSCyoung-EVs treatment; &: TGF-β1 + ADMSCyoung-EVs vs. TGF-β1 + ADMSCold-EVs treatment groups, P < 0.05)
Fig. 7
Fig. 7
ADMSCyoung-EVs protected tenocytes treated with IL-1β by restoring NAD + biosynthesis and the NAMPT/SIRT1/PPARγ/PGC-1α pathway. a Western blotting and quantification of NAMPT in the control, IL-1β, IL-1β + ADMSCyoung-EV and IL-1β + ADMSCold-EV tenocyte groups, n = 3. b Relative NAD+ content in the control, IL-1β, IL-1β + ADMSCyoung-EV and IL-1β + ADMSCold-EV tenocyte groups, n = 4. c JC-1 staining of tenocytes in the control, IL-1β, IL-1β + ADMSCyoung-EVs and IL-1β + ADMSCold-EV groups. Aggregates are shown in red, and monomers are shown in green. The relative JC-1 intensity was quantified, and n = 4. Scale bar = 200 μm. d OCR curves and OCR respiratory reactions in the control, IL-1β, IL-1β + ADMSCyoung-EV and IL-1β + ADMSCold-EV tenocyte groups. The basal OCR, ATP production, protein leak, maximal OCR, and spare respiratory capacity were calculated, n = 4. e The ECAR curves and ECAR respiratory reactions in the control, IL-1β, IL-1β + ADMSCyoung-EV and IL-1β + ADMSCold-EV tenocyte groups, n = 4. The gliosis and glycolytic capacity were calculated. f The relative ATP production ability in the control, IL-1β, IL-1β + ADMSCyoung-EV and IL-1β + ADMSCold-EV tenocyte groups, n = 4. g Relative LDH release in the control, IL-1β, IL-1β + ADMSCyoung-EV and IL-1β + ADMSCold-EV tenocyte groups, n = 4. h Western blotting and quantification of NAMPT, SIRT1, PPARγ and PGC-1α in the control, IL-1β, IL-1β + ADMSCyoung-EVs, IL-1β + ADMSCold-EVs, IL-1β + ADMSCyoung-EVs + NAMPT inhibitor and IL-1β + ADMSCyoung-EVs + SIRT1 inhibitor tenocyte groups, n = 3. (*: control vs. IL-1β treatment; #: IL-1β treatment vs. IL-1β + ADMSCyoung-EVs treatment; &: IL-1β + ADMSCyoung-EVs vs. IL-1β + ADMSCold-EVs treatment groups, $: IL-1β + ADMSCyoung-EVs vs. IL-1β + ADMSCyoung-EVs + NAMPT inhibitor; ^: IL-1β + ADMSCyoung-EVs vs. IL-1β + ADMSCyoung-EVs + SIRT1 inhibitor, P < 0.05; **: P < 0.01; ***: P < 0.001)
Fig. 8
Fig. 8
ADMSCyoung-EVs, but not ADMSCold−EVs, alleviated cellular senescence and promoted M2 polarization in macrophages treated with IL-1β. a The uptake assay of ADMSCyoung-EVs and ADMSCold-EVs in cultured macrophages. The cell membranes (labeled with DIO, green), EVs (labeled with DII, red) and nuclei (DAPI, blue) are listed. The uptaken EVs per cell were analyzed. Scale bar = 100 μm and n = 4. b Western blotting and quantification of NAMPT in the control, IL-1β, IL-1β + ADMSCyoung-EVs and IL-1β + ADMSCold-EVs macrophage groups, n = 3. c Relative NAD + content in the control, IL-1β, IL-1β + ADMSCyoung-EV and IL-1β + ADMSCold-EV macrophage groups, n = 4. d Immunofluorescence staining of p16INK4A (green), p21CIP1 (red) and nuclear (DAPI, blue) in the control, IL-1β, IL-1β + ADMSCyoung-EVs and IL-1β + ADMSCold-EVs macrophage groups. Scale bar = 200 μm and n = 6. e The rate of M2 macrophages in the control, IL-1β, IL-1β + ADMSCyoung-EVs and IL-1β + ADMSCold-EVs macrophage groups, n = 4. f The relative expression of M1 markers, including CD86, iNOS, IL-6 and TLR4, and M2 markers, including Arg-1, Fizz-1, Ym-1 and CD206, in the control, IL-1β, IL-1β + ADMSCyoung-EV and IL-1β + ADMSCold-EV macrophage groups, n = 3. (*: control vs. IL-1β treatment; #: IL-1β treatment vs. IL-1β + ADMSCyoung-EVs treatment; &: IL-1β + ADMSCyoung-EVs vs. IL-1β + ADMSCold-EVs treatment groups, P < 0.05; *: P < 0.05; **: P < 0.01 and ***: P < 0.001)
Fig. 9
Fig. 9
ADMSCyoung-EVs regulated the NAMPT/SIRT1/Nf-κb p65/NLRP3 pathway in macrophages and alleviated tendinopathy in vitro through direct and indirect pathways. a The relative SASP status, including IL-6, IL-8, TGF-β1, MCP-1, MMP3, TNF-α and CXCL1 in the control, IL-1β, IL-1β + ADMSCyoung-EV and IL-1β + ADMSCold-EV macrophage groups, n = 3. b The relative phagocytosis ability in the control, IL-1β, IL-1β + ADMSCyoung-EV and IL-1β + ADMSCold-EV macrophage groups. Scale bar = 50 μm and n = 4. c Western blotting and quantification of NAMPT, SIRT1, p65 Nf-κb K310Ac, NLRP3 and ASC in the control, IL-1β, IL-1β + ADMSCyoung-EV, IL-1β + ADMSCold-EV, IL-1β + ADMSCyoung-EVs + NAMPT inhibitor and IL-1β + ADMSCyoung-EVs + SIRT1 inhibitor macrophage groups, n = 3. d A schematic diagram of the indirect contact macrophage-tenocyte crosstalk. e JC-1 staining of tenocytes in the control, IL-1β-treated macrophage medium, IL-1β-treated macrophage medium + ADMSCyoung-EV and IL-1β-treated macrophage medium + ADMSCold-EV groups and the IL-1β-treated macrophage medium + ADMSCyoung-EVs + NAMPT inhibitor and IL-1β-treated macrophage medium + ADMSCyoung-EVs + SIRT1 inhibitor groups. Aggregates are shown in red, and monomers are shown in green. The relative JC-1 intensity was quantified, and n = 4. Scale bar = 50 μm. f Live/dead assay of tenocytes in the control, IL-1β-treated macrophage medium, IL-1β-treated macrophage medium + ADMSCyoung-EV, IL-1β-treated macrophage medium + ADMSCold-EV, IL-1β-treated macrophage medium + ADMSCyoung-EVs + NAMPT inhibitor and IL-1β-treated macrophage medium + ADMSCyoung-EVs + SIRT1 inhibitor groups. Live cells are indicated in green, and dead cells are indicated in red. The rate of cell death was quantified. Scale bar = 100 μm and n = 4. (*: control vs. IL-1β treatment; #: IL-1β treatment (or treated macrophage medium) vs. IL-1β (or treated macrophage medium) + ADMSCyoung-EV treatment; &: IL-1β (or treated macrophage medium) + ADMSCyoung-EV vs. IL-1β (or treated macrophage medium) + ADMSCold-EV treatment groups, $: IL-1β (or treated macrophage medium) + ADMSCyoung-EVs vs. IL-1β (or treated macrophage medium) + ADMSCyoung-EVs + NAMPT inhibitor; ^: IL-1β (or treated macrophage medium) + ADMSCyoung-EVs vs. IL-1β (or treated macrophage medium) + ADMSCyoung-EVs + SIRT1 inhibitor, P < 0.05; **: P < 0.01; ***: P < 0.001)

References

    1. Millar NL, Silbernagel KG, Thorborg K, Kirwan PD, Galatz LM, Abrams GD, Murrell GAC, McInnes IB, Rodeo SA. Tendinopathy. Nat Rev Dis Primers. 2021;7:1. doi: 10.1038/s41572-020-00234-1. - DOI - PubMed
    1. Gomez-Florit M, Labrador-Rached CJ, Domingues RMA, Gomes ME. The tendon microenvironment: engineered in vitro models to study cellular crosstalk. Adv Drug Deliv Rev. 2022;185:114299. doi: 10.1016/j.addr.2022.114299. - DOI - PubMed
    1. Dan M, Phillips A, Johnston RV, Harris IA. Surgery for patellar tendinopathy (jumper’s knee) Cochrane Database Syst Rev. 2019;9:CD013034. - PMC - PubMed
    1. Tung KK, Wei JC. Platelet-rich plasma injection vs sham injection and tendon dysfunction in patients with chronic midportion achilles tendinopathy. JAMA. 1975;2021:326. - PubMed
    1. Schneider M, Angele P, Jarvinen TAH, Docheva D. Rescue plan for achilles: therapeutics steering the fate and functions of stem cells in tendon wound healing. Adv Drug Deliv Rev. 2018;129:352–375. doi: 10.1016/j.addr.2017.12.016. - DOI - PubMed

Substances