. 2023 Jan 5;15(1):2.
doi: 10.1186/s13195-022-01143-z.

Clinical performance of an antibody-free assay for plasma Aβ42/Aβ40 to detect early alterations of Alzheimer's disease in individuals with subjective cognitive decline

Collaborators, Affiliations

Clinical performance of an antibody-free assay for plasma Aβ42/Aβ40 to detect early alterations of Alzheimer's disease in individuals with subjective cognitive decline

María Pascual-Lucas et al. Alzheimers Res Ther. .

Abstract

Background: Accessible and cost-effective diagnostic tools are urgently needed to accurately quantify blood biomarkers to support early diagnosis of Alzheimer's disease (AD). In this study, we investigated the ability of plasma amyloid-beta (Aβ)42/Aβ40 ratio measured by an antibody-free mass-spectrometric (MS) method, ABtest-MS, to detect early pathological changes of AD.

Methods: This cohort study included data from the baseline and 2-year follow-up visits from the Fundació ACE Healthy Brain Initiative (FACEHBI) study. Plasma Aβ42/Aβ40 was measured with ABtest-MS and compared to 18F-Florbetaben PET as the reference standard (cutoff for early amyloid deposition of 13.5 centiloids). Cross-validation was performed in an independent DPUK-Korean cohort. Additionally, associations of plasma Aβ42/Aβ40 with episodic memory performance and brain atrophy were assessed.

Results: The FACEHBI cohort at baseline included 200 healthy individuals with subjective cognitive decline (SCD), of which 36 (18%) were Aβ-PET positive. Plasma Aβ42/Aβ40 levels were significantly lower in Aβ-PET positive individuals (median [interquartile range, IQR], 0.215 [0.203-0.236]) versus Aβ-PET negative subjects (median [IQR], 0.261 [0.244-0.279]) (P < .001). Plasma Aβ42/Aβ40 was significantly correlated with Aβ-PET levels (rho = -0.390; P < .001) and identified Aβ-PET status with an area under the receiver operating characteristic curve (AUC) of 0.87 (95% confidence interval [CI], 0.80-0.93). A cutoff for the Aβ42/Aβ40 ratio of 0.241 (maximum Youden index) yielded a sensitivity of 86.1% and a specificity of 80.5%. These findings were cross-validated in an independent DPUK-Korean cohort (AUC 0.86 [95% CI 0.77-0.95]). Lower plasma Aβ42/Aβ40 ratio was associated with worse episodic memory performance and increased brain atrophy. Plasma Aβ42/Aβ40 at baseline predicted clinical conversion to mild cognitive impairment and longitudinal changes in amyloid deposition and brain atrophy at 2-year follow-up.

Conclusions: This study suggests that plasma Aβ42/Aβ40, as determined by this MS-based assay, has potential value as an accurate and cost-effective tool to identify individuals in the earliest stages of AD, supporting its implementation in clinical trials, preventative strategies and clinical practice.

Keywords: Alzheimer’s disease; Amyloid; Aβ42/Aβ40; Biomarkers; Blood biomarkers; Mass spectrometry; Plasma; Ratio; Subjective cognitive decline.


Conflict of interest statement

MPL, JAA, LS, NF, SC and JT are full-time employees at Araclon Biotech-Grifols. AR has consulted for Grifols, Prevail Therapeuthics and Landsteiner Genenmed. He reports grants/research funding from Abbvie, Janssen, Grifols and Fundación Bancaria LaCaixa. AR has stocks in Landsteiner Genmed. MB has consulted for Araclon, Avid, Grifols, Lilly, Nutricia, Roche, Eisai and Servier. She received fees from lectures and funds for research from Araclon, Biogen, Grifols, Nutricia, Roche and Servier. She reports grants/research funding from Abbvie, Araclon, Biogen Research Limited, Bioiberica, Grifols, Lilly, S.A, Merck Sharp & Dohme, Kyowa Hakko Kirin, Laboratorios Servier, Nutricia SRL, Oryzon Genomics, Piramal Imaging Limited, Roche Pharma SA, and Schwabe Farma Iberica SLU, all outside the submitted work. She has not received personal compensations from these organizations. JPT, AS, LT, MM, SWS and HJ report no disclosures.

Figures

Fig. 1
Fig. 1
Association of plasma Aβ levels with brain amyloid deposition. AC Distribution of plasma Aβ40 (A), Aβ42 (B) and Aβ42/Aβ40 (C) levels between Aβ-PET(−) and Aβ-PET(+) groups. Plasma Aβ levels were compared between Aβ-PET(−) and Aβ-PET(+) groups using Mann-Whitney test. ** P < .01; *** P < .001. Horizontal line depicts median and whiskers depict interquartile range. DF Correlations between Aβ-PET CL and Aβ40 (D), Aβ42 (E) and Aβ42/Aβ40 (F) levels. Solid blue line represents the regression line; dashed lines represent 95% confidence interval. Abbreviations: CL, centiloid
Fig. 2
Fig. 2
Plasma Aβ42/Aβ40 discriminative ability of Aβ-PET status. A Receiver operating characteristic (ROC) curves for discriminating Aβ-PET status. ROC curves are shown for plasma Aβ42/Aβ40, plasma Aβ42/Aβ40 adjusted with age, sex and APOE ɛ4 number of alleles, and the demographic model including only age, sex and APOE ɛ4 number of alleles. B Probability scores distribution derived from the full logistic regression model (Aβ42/Aβ40, age, sex, APOE ɛ4 number of alleles) to predict Aβ-PET status, between Aβ-PET(−) and Aβ-PET(+) groups. Model probability scores were compared between Aβ-PET(−) and Aβ-PET(+) groups using Mann-Whitney test. *** P < .001. Horizontal line depicts median and whiskers depict interquartile range. C, D Concordance plots for plasma Aβ42/Aβ40 levels (C) or full model probability scores (D) and Aβ-PET CL. Black dots correspond to Aβ-PET(−) individuals; red dots correspond to Aβ-PET(+) individuals. Dashed vertical lines represent the CL cutoff for Aβ-PET positivity. Dashed horizontal lines represent the cutoffs for plasma Aβ42/Aβ40 or the model probability score based on maximum Youden index derived by ROC analyses. Concordant classification is represented by the grey area. Abbreviations: APOE, apolipoprotein E; AUC, area under the curve; CI, confidence interval; CL, centiloid; PL, plasma
Fig. 3
Fig. 3
Cross-validation in an independent cohort. A Receiver operating characteristic (ROC) curve for discriminating Aβ-PET status in the DPUK-Korean cohort after applying the estimates and intercept of the model established in FACEHBI that included plasma Aβ42/Aβ40, age, sex and APOE ɛ4 number of alleles. B Concordance plot for the model probability scores of the validation model and Aβ-PET dcCL. Black dots correspond to Aβ-PET(−) individuals; red dots correspond to Aβ-PET(+) individuals. Dashed vertical line represents the dcCL cutoff for Aβ-PET positivity of the DPUK-Korean cohort. Dashed horizontal line represents the cutoff for the model probability score based on maximum Youden index derived by ROC analyses in FACEHBI. Concordant classification is represented by the grey area. Abbreviations: APOE, apolipoprotein E; AUC, area under the curve; CI, confidence interval; dcCL: direct comparison centiloid units; PL, plasma
Fig. 4
Fig. 4
Association of plasma Aβ42/Aβ40 with episodic memory performance. Participants were classified as plasma Aβ42/Aβ40(+) or Aβ42/Aβ40(−) by applying a cutoff of 0.241 corresponding to the maximum Youden index. A, B Distribution of S-FNAME total score (A) and SFN-N composite score (B) between Aβ42/Aβ40(−) and Aβ42/Aβ40(+) groups. Cognitive scores were compared between Aβ42/Aβ40(−) and Aβ42/Aβ40(+) groups using Mann-Whitney test. * P < .05; *** P < .001. Horizontal line depicts median and whiskers depict interquartile range. C, D Correlations between Aβ42/Aβ40 and S-FNAME total score (C) and SFN-N composite (D) score. Solid blue line represents the regression line; dashed lines represent 95% confidence interval
Fig. 5
Fig. 5
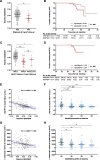
Association of plasma Aβ42/Aβ40 at baseline with longitudinal measures of clinical diagnosis, brain amyloid deposition and brain atrophy at 2-year follow-up. A Distribution of plasma Aβ42/Aβ40 levels at baseline between subjective cognitive decline (SCD) and mild cognitive impairment (MCI) individuals at 2-year follow-up. Plasma Aβ42/Aβ40 levels were compared between SCD and MCI groups using Mann Whitney test. ** P < .01. Horizontal line depicts median and whiskers depict interquartile range. B Kaplan-Meier curves showing fraction of individuals remaining SCD. P value of log-rank test is depicted in the lower right. C Distribution of plasma Aβ42/Aβ40 levels at baseline between Aβ-PET(−), Aβ-PET(+) and Aβ-PET(+) converter subjects at 2-year follow-up. Aβ-PET(+) converter subjects were defined as individuals who converted from Aβ-PET(−) at baseline to Aβ-PET(+) at 2-year follow-up. Plasma Aβ42/Aβ40 levels were compared among groups using Kruskal-Wallis test followed by the Dunn’s pairwise test with adjustment for multiple comparisons. * P < .05; *** P < .001. Horizontal line depicts median and whiskers depict interquartile range. D Kaplan-Meier curves showing fraction of individuals remaining Aβ-PET(−). P value of log-rank test is depicted in the lower right. E, G Correlations between plasma Aβ42/Aβ40 at baseline and amyloid accumulation (E) and brain atrophy (G) at 2-year follow-up, as determined by Aβ-PET CL and ventricular volume increments. Solid blue line represents the regression line; dashed lines represent 95% confidence interval. F, H Distribution of Aβ-PET CL (F) and ventricular volume (H) increments among the quartiles of plasma Aβ42/Aβ40 at baseline. Aβ-PET CL and ventricular volume increments were compared using Kruskal-Wallis test followed by the Dunn’s pairwise test with adjustment for multiple comparisons. ** P < .01; *** P < .001. Horizontal line depicts median and whiskers depict interquartile range. Abbreviations: CL, centiloid; Δ, increment; MCI, mild cognitive impairment; ns, non-significant; Q, quartile; SCD, subjective cognitive decline

References

    1. Dementia: World Health Organization. 2021. Available from: https://www.who.int/news-room/fact-sheets/detail/dementia. Accessed 26 July 2022.
    1. Mattsson N, Lönneborg A, Boccardi M, Blennow K, Hansson O. Clinical validity of cerebrospinal fluid Aβ42, tau, and phospho-tau as biomarkers for Alzheimer's disease in the context of a structured 5-phase development framework. Neurobiol Aging. 2017;52:196–213. doi: 10.1016/j.neurobiolaging.2016.02.034. - DOI - PubMed
    1. Laforce R, Jr, Soucy JP, Sellami L, Dallaire-Théroux C, Brunet F, Bergeron D, et al. Molecular imaging in dementia: Past, present, and future. Alzheimers Dement. 2018;14(11):1522–1552. doi: 10.1016/j.jalz.2018.06.2855. - DOI - PubMed
    1. Wang X, Sun Y, Li T, Cai Y, Han Y. Amyloid-β as a Blood Biomarker for Alzheimer’s Disease: A Review of Recent Literature. J Alzheimers Dis. 2020;73(3):819–832. doi: 10.3233/JAD-190714. - DOI - PubMed
    1. Ovod V, Ramsey KN, Mawuenyega KG, Bollinger JG, Hicks T, Schneider T, et al. Amyloid β concentrations and stable isotope labeling kinetics of human plasma specific to central nervous system amyloidosis. Alzheimers Dement. 2017;13(8):841–849. doi: 10.1016/j.jalz.2017.06.2266. - DOI - PMC - PubMed

Publication types