. 2022 Dec 20:13:1086413.
doi: 10.3389/fimmu.2022.1086413. eCollection 2022.

Oral supplementation with yeast β-glucans improves the resolution of Escherichia coli-associated inflammatory responses independently of monocyte/macrophage immune training

Affiliations

Oral supplementation with yeast β-glucans improves the resolution of Escherichia coli-associated inflammatory responses independently of monocyte/macrophage immune training

Sarah Walachowski et al. Front Immunol. .

Abstract

Introduction: Confronted with the emerging threat of antimicrobial resistance, the development of alternative strategies to limit the use of antibiotics or potentiate their effect through synergy with the immune system is urgently needed. Many natural or synthetic biological response modifiers have been investigated in this context. Among them, β-glucans, a type of soluble or insoluble polysaccharide composed of a linear or branched string of glucose molecules produced by various cereals, bacteria, algae, and inferior (yeast) and superior fungi (mushrooms) have garnered interest in the scientific community, with not less than 10,000 publications over the last two decades. Various biological activities of β-glucans have been reported, such as anticancer, antidiabetic and immune-modulating effects. In vitro, yeast β-glucans are known to markedly increase cytokine secretion of monocytes/macrophages during a secondary challenge, a phenomenon called immune training.

Methods: Here, we orally delivered β-glucans derived from the yeast S. cerevisiae to mice that were further challenged with Escherichia coli.

Results: β-glucan supplementation protected the mice from E. coli intraperitoneal and intra-mammary infections, as shown by a lower bacterial burden and greatly diminished tissue damage. Surprisingly, this was not associated with an increased local immune response. In addition, granulocyte recruitment was transient and limited, as well as local cytokine secretion, arguing for faster resolution of the inflammatory response. Furthermore, ex-vivo evaluation of monocytes/macrophages isolated or differentiated from β-glucan-supplemented mice showed these cells to lack a trained response versus those from control mice.

Conclusion: In conclusion, dietary β-glucans can improve the outcome of Escherichia coli infections and dampen tissue damages associated to excessive inflammatory response. The mechanisms associated with such protection are not necessarily linked to immune system hyper-activation or immune training.

Keywords: escherichia coli; immune training; inflammation; innate immunity; macrophages; nutritional immuology; saccharomyces cerevisiae; β-glucans.


Conflict of interest statement

The authors declare that the research was conducted in the absence of any commercial or financial relationships that could be construed as a potential conflict of interest.

Figures

Figure 1
Figure 1
Bacterial fitness and the host response in liver and spleen and histological examination after E.coli intra-peritoneal challenge of β-glucan or PBS orally-supplemented C57BL/6 mice. (A) Experimental design. (B) Bacterial loads in log CFUs per mg of fresh tissue in the liver and spleen over time. Grey crosses and bars represent the mean ± SD. Statistical analysis was performed using the Welch t-test and significant p values are indicated. (C) Histological examination of hematoxylin eosin-stained sections of liver and spleen sampled at 24 h p.i. Magnified areas are indicated by white delimitations. (D) Results of the semi-quantitative grading of histological features (–) absent, (+) minimal, (++) moderate, and (+++) severe and the number of mice from each group presenting these features. The number of mice used and experiments are detailed in Supplementary Table 1 .
Figure 2
Figure 2
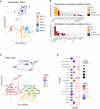
Multifactorial analysis and hierarchical clustering of immune and bacteriological parameters recorded from individual mice sampled at 4, 8, and 24 h p.i. (A) Individual factor map. (B) Respective contribution of quantitative variables to dimensions 1 and 2. (C) Cluster plot from hierarchical clustering performed according to Ward’s Method. (D) Bubble plot indicating variables positively (red) or negatively (blue) characterizing clusters according to the test value (v-Test). Bubble sizes reflect the statistical significance (-log10 p value). The number of mice used and experiments are detailed in Supplementary Table 1 .
Figure 3
Figure 3
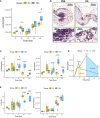
Cytokine secretion in peritoneal exudates from individual mice at 4, 8, and 24 h after challenge. (A) Heatmap representation of the cytokine concentrations of each individual (after Z-score transformation) according to experimental group, cluster, and sampling time point. (B) Cytokine concentrations (pg/mL) in exudates determined by multiplexed ELISA. Statistical analysis was performed using the Welch t-test and significant p values are indicated. The number of mice and experiments are detailed in Supplementary Table 1 .
Figure 4
Figure 4
Leukocyte infiltration in the peritoneal cavity. (A) Flow-cytometry assessment of CD45+ leukocyte numbers. (B) Histological examination of hematoxylin eosin-stained sections of omentum sampled at 24 h p.i. (C) Flow-cytometry assessment of neutrophil (Ly6Gpos) frequency and number in peritoneal exudates. (D) Neutrophil dynamics in each experimental group (Tmax: time for maximal neutrophil recruitment, T50: time for neutrophil numbers to decrease to half Tmax, RI: resolution interval = Tmax – T50). (E) Flow-cytometry assessment of F4-80pos cell frequencies and numbers in peritoneal exudates. Statistical analysis was performed using the Welch t-test and significant p values are indicated. The number of mice used and experiments are detailed in Supplementary Table 1 .
Figure 5
Figure 5
Neutrophil differentiation in bone marrow after oral supplementation and (E) coli challenge. (A) Flow-cytometry analysis of myeloid CD11pos, Ly6GHigh, or Ly6GLow cell frequencies in bone marrow over time (the frequencies indicated are representative of the mean frequencies recorded for each group at each time point). (B) Flow-cytometry assessment of Ly6G mean fluorescence intensity among CD11bpos cells. (C) Flow-cytometry determination of CD11bpos, CD11bposLy6Ghigh, or Ly6Glow frequencies and numbers in bone marrow at steady state and after E. coli challenge. Statistical analysis was performed using the Welch t-test and significant p values are indicated. The number of mice and experiments are detailed in Supplementary Table 1 .
Figure 6
Figure 6
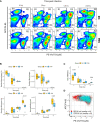
Flow-cytometry analysis of F4-80+ subpopulations from peritoneal exudates collected throughout the infection. (A) Representative flow-cytometry panels of F4-80pos/Ly6Cpos cell distributions over time in each experimental group. (B) Frequencies and numbers of F4-80high Ly6Clow resident peritoneal macrophages or F4-80low Ly6Chigh recruited inflammatory monocytes. (C) Ratio of PMN over recruited monocyte numbers over time. (D) Overlay of F4-80pos/Ly6C cells from nine β-glucan-supplemented mice and nine PBS control mice at 24 h p.i. Statistical analysis was performed using the Welch t-test and significant p values are indicated. The number of mice and experiments are detailed in Supplementary Table 1 .
Figure 7
Figure 7
Cytokine secretion by macrophages or monocytes isolated or generated from β-glucan- or PBS-supplemented mice at steady state. (A) Experimental design. (B) TNFα (pg/mL) secretion in culture supernatants of (green) resident peritoneal macrophages, (blue) bone marrow-derived macrophages, or (red) bone-marrow monocytes stimulated for 24 h with E. coli LPS. Statistical analysis was performed using the Welch t-test and significant p values are indicated. For PerMF and BMDM, the data were collected from two individual experiments representing a total of eight wildtype and five clec7a -/- β-glucan-supplemented mice and 10 wildtype and five clec7a -/- PBS-supplemented mice. For monocytes isolated from bone marrow, the data were collected from a single experiment with a total of six wildtype β-glucan- and six PBS-supplemented mice pooled two by two to reach sufficient monocyte numbers.
Figure 8
Figure 8
Intra-mammary infection with E. coli strain P4 in β-glucan- or PBS-supplemented mice. (A) Experimental design, for which the steady state corresponds to β-glucan mice euthanized after the supplementation period but with no intra-mammary injections (n = 3), Ctrl corresponds to β-glucan-supplemented mice that received a PBS injection in one mammary gland (n = 6 mice), β-glucan (n = 6) and PBS (n = 6) correspond to mice supplemented as indicated and infected intra-mammarily with E. coli P4. Ex-vivo imaging of (B, C) fluorescence or (D, E) luminescence intensities of dissected mammary glands. Images are representative of each experimental group. (F) Flow-cytometry analysis of neutrophil recruitment (CD45pos Ly6Gpos cells) in mammary gland tissue. (G) CXCL1 and 2 chemokine levels measured by ELISA from mammary gland tissue homogenates. Statistical comparisons were performed using non-parametric Kruskal-Wallis tests followed by multiple comparison tests (Wilcoxon) corrected using the Bonferroni method (indicated p-values are adjusted). (H) Hematoxylin - eosin histological examination of mammary gland tissue from PBS or β-glucan-supplemented mice infected with E. coli P4 (large panel magnification x200, small panel x800) (1): neutrophil infiltration, (2) cluster of bacteria, (3) swelled necrotic alveolar cells.

References

    1. Antimicrobial resistance . Available at: https://www.who.int/news-room/fact-sheets/detail/antimicrobial-resistance.
    1. Centers for Disease Control and Prevention (U.S.) . Antibiotic resistance threats in the united states, 2019. Atlanta, GA, USA: Centers for Disease Control and Prevention (U.S; (2019). Available at: https://stacks.cdc.gov/view/cdc/82532.
    1. Cheng WN, Han SG. Bovine mastitis: risk factors, therapeutic strategies, and alternative treatments — a review. Asian-Australas J Anim Sci (2020) 33(11):1699−713. doi: 10.5713/ajas.20.0156 - DOI - PMC - PubMed
    1. Zhao X, Lacasse P. Mammary tissue damage during bovine mastitis: Causes and control1. J Anim Sci (2008) 86(suppl_13):57−65. doi: 10.2527/jas.2007-0302 - DOI - PubMed
    1. Halasa T, Huijps K, Østerås O, Hogeveen H. Economic effects of bovine mastitis and mastitis management: a review. Vet Q (2007) 29(1):18−31. doi: 10.1080/01652176.2007.9695224 - DOI - PubMed

Publication types

LinkOut - more resources