

Prevalence and risk factors of sarcopenia without obesity and sarcopenic obesity among Chinese community older people in suburban area of Shanghai: A cross-sectional study
- PMID: 36605360
- PMCID: PMC9807613
- DOI: 10.3389/fnagi.2022.1034542
Prevalence and risk factors of sarcopenia without obesity and sarcopenic obesity among Chinese community older people in suburban area of Shanghai: A cross-sectional study
Abstract
Objectives: The aim of the present study was to explore the prevalence and risk factors of sarcopenia without obesity (S) and sarcopenic obesity (SO) among community-dwelling older people in the Chongming District of Shanghai, China, according to the Asian Working Group for Sarcopenia (AWGS) 2019 Consensus as the diagnostic criteria of sarcopenia.
Methods: In this cross-sectional study, a total of 1,407 subjects aged ≥65 years were included, where the mean age of the subjects was 71.91 ± 5.59 years and their mean body mass index (BMI) was 24.65 ± 3.32 kg/m2. According to the Asian Working Group for Sarcopenia (AWGS) 2019 Consensus, sarcopenia was defined as a low appendicular skeletal muscle mass index (≤7.0 kg/m2 in males and ≤5.7 kg/m2 in females), decreased handgrip strength (<28.0 kg in males and <18.0 kg in females), and/or low gait speed (<1.0 m/s) or poor 5-time chair stand test (5CST) (≥12s). The SO met both the diagnostic criteria for sarcopenia and obesity, meanwhile obesity was defined as an increased percentage of body fat (PBF) (≥25% in males and ≥35% in females). Univariate and multiple logistic regression analyses were performed to explore the risk factors of both S and SO.
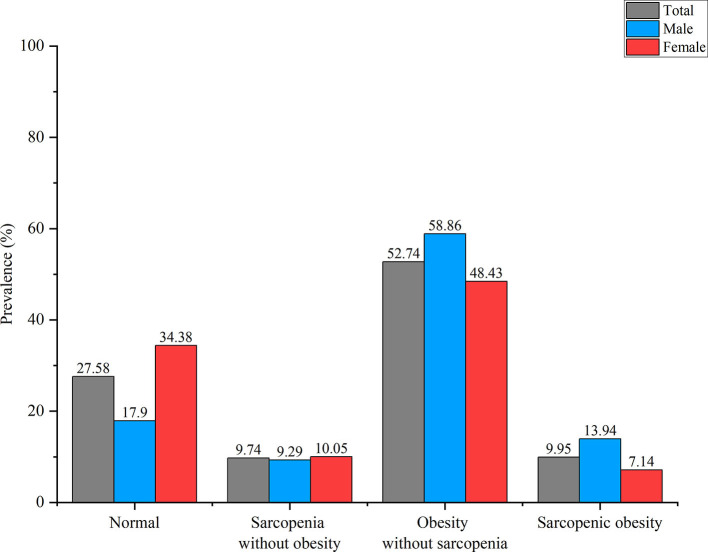
Results: The prevalence of S and SO was 9.74% (M: 9.29%, F: 10.05%) and 9.95% (M: 13.94%, F: 7.14%). Lower BMI (OR = 0.136, 95% CI: 0.054-0.340, p < 0.001), lower hip circumference (OR = 0.858, 95% CI: 0.816-0.903, p < 0.001), farming (OR = 1.632, 95% CI: 1.053-2.530, p = 0.028), higher high-density lipoprotein cholesterol (HDL-C) level (OR = 2.235, 95% CI: 1.484-3.367, p < 0.001), and a sleep duration <7 h (OR = 0.561, 95% CI: 0.346-0.909, p = 0.019) were risk factors for S. While aging (70-74 y, OR = 1.923, 95% CI: 1.122-3.295, p = 0.017; 75-79 y, OR = 3.185, 95% CI: 1.816-5.585, p < 0.001; ≥80 y, OR = 7.192, 95% CI: 4.133-12.513, p < 0.001), male (OR = 1.981, 95% CI: 1.351-2.904, p < 0.001), higher BMI (OR = 4.865, 95% CI: 1.089-21.736, p = 0.038), higher monocyte level (OR = 4.203, 95% CI: 1.340-13.181, p = 0.014), and a sleep duration >9 h (OR = 1.881, 95% CI: 1.117-3.166, p = 0.017) were risk factors for SO.
Conclusion: Our study showed the high prevalence of S and SO among community-dwelling older people in the Chongming District. The SO was more prevalent in males. Behavioral factors and lifestyle (such as farming and sleep duration) were associated more with the development of S, while age and male gender were associated more with the development of SO.
Keywords: older people; prevalence; risk factor; sarcopenia; sarcopenic obesity; suburban.
Copyright © 2022 Lu, He, Song, Zhuang, Wu and Chen.
Conflict of interest statement
The authors declare that the research was conducted in the absence of any commercial or financial relationships that could be construed as a potential conflict of interest.
Figures


References
LinkOut - more resources
Full Text Sources
Miscellaneous