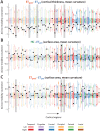
Morphometric features of drug-resistant essential tremor and recovery after stereotactic radiosurgical thalamotomy
- PMID: 36605417
- PMCID: PMC9810368
- DOI: 10.1162/netn_a_00253
Morphometric features of drug-resistant essential tremor and recovery after stereotactic radiosurgical thalamotomy
Abstract
Essential tremor (ET) is the most common movement disorder. Its neural underpinnings remain unclear. Here, we quantified structural covariance between cortical thickness (CT), surface area (SA), and mean curvature (MC) estimates in patients with ET before and 1 year after ventro-intermediate nucleus stereotactic radiosurgical thalamotomy, and contrasted the observed patterns with those from matched healthy controls. For SA, complex rearrangements within a network of motion-related brain areas characterized patients with ET. This was complemented by MC alterations revolving around the left middle temporal cortex and the disappearance of positive-valued covariance across both modalities in the right fusiform gyrus. Recovery following thalamotomy involved MC readjustments in frontal brain centers, the amygdala, and the insula, capturing nonmotor characteristics of the disease. The appearance of negative-valued CT covariance between the left parahippocampal gyrus and hippocampus was another recovery mechanism involving high-level visual areas. This was complemented by the appearance of negative-valued CT/MC covariance, and positive-valued SA/MC covariance, in the right inferior temporal cortex and bilateral fusiform gyrus. Our results demonstrate that different morphometric properties provide complementary information to understand ET, and that their statistical cross-dependences are also valuable. They pinpoint several anatomical features of the disease and highlight routes of recovery following thalamotomy.
Keywords: Cortical thickness; Essential tremor; Mean curvature; Morphometry; Radiosurgery; Structural covariance analysis; Surface area; Thalamotomy; Ventro-intermediate nucleus.
© 2022 Massachusetts Institute of Technology.
Figures


Similar articles
-
Graph Theoretical Analysis of Structural Covariance Reveals the Relevance of Visuospatial and Attentional Areas in Essential Tremor Recovery After Stereotactic Radiosurgical Thalamotomy.Front Aging Neurosci. 2022 May 23;14:873605. doi: 10.3389/fnagi.2022.873605. eCollection 2022. Front Aging Neurosci. 2022. PMID: 35677202 Free PMC article.
-
Pretherapeutic resting-state fMRI profiles are associated with MR signature volumes after stereotactic radiosurgical thalamotomy for essential tremor.J Neurosurg. 2018 Dec 1;129(Suppl1):63-71. doi: 10.3171/2018.7.GKS18752. J Neurosurg. 2018. PMID: 30544321
-
Clinical response to Vim's thalamic stereotactic radiosurgery for essential tremor is associated with distinctive functional connectivity patterns.Acta Neurochir (Wien). 2018 Mar;160(3):611-624. doi: 10.1007/s00701-017-3456-x. Epub 2018 Jan 15. Acta Neurochir (Wien). 2018. PMID: 29335882
-
Leksell Radiosurgery for Movement Disorders.Prog Neurol Surg. 2019;34:279-288. doi: 10.1159/000493075. Epub 2019 May 16. Prog Neurol Surg. 2019. PMID: 31096233 Review.
-
Radiosurgical Thalamotomy.Prog Neurol Surg. 2018;33:135-148. doi: 10.1159/000481081. Epub 2018 Jan 12. Prog Neurol Surg. 2018. PMID: 29332079 Review.
Cited by
-
Exploring the heterogeneous morphometric data in essential tremor with probabilistic modelling.Neuroimage Clin. 2023;37:103283. doi: 10.1016/j.nicl.2022.103283. Epub 2022 Dec 6. Neuroimage Clin. 2023. PMID: 36516728 Free PMC article.
-
Dynamic functional changes upon thalamotomy in essential tremor depend on baseline brain morphometry.Sci Rep. 2024 Jan 31;14(1):2605. doi: 10.1038/s41598-024-52410-y. Sci Rep. 2024. PMID: 38297028 Free PMC article.
-
Impact of biologically effective dose on tremor decrease after stereotactic radiosurgical thalamotomy for essential tremor: a retrospective longitudinal analysis.Neurosurg Rev. 2024 Jan 31;47(1):73. doi: 10.1007/s10143-024-02296-1. Neurosurg Rev. 2024. PMID: 38296852 Free PMC article.
-
Cortical involvement in essential tremor with and without rest tremor: a machine learning study.J Neurol. 2023 Aug;270(8):4004-4012. doi: 10.1007/s00415-023-11747-6. Epub 2023 May 5. J Neurol. 2023. PMID: 37145157 Free PMC article.
References
LinkOut - more resources
Full Text Sources
