. 2022 Dec 20:16:1090037.
doi: 10.3389/fncel.2022.1090037. eCollection 2022.

Robust visual cortex evoked potentials (VEP) in Gnat1 and Gnat2 knockout mice

Affiliations

Robust visual cortex evoked potentials (VEP) in Gnat1 and Gnat2 knockout mice

Michael D Flood et al. Front Cell Neurosci. .

Abstract

Intrinsically photosensitive retinal ganglion cells (ipRGCs) express the photopigment melanopsin, imparting to themselves the ability to respond to light in the absence of input from rod or cone photoreceptors. Since their discovery ipRGCs have been found to play a significant role in non-image-forming aspects of vision, including circadian photoentrainment, neuroendocrine regulation, and pupillary control. In the past decade it has become increasingly clear that some ipRGCs also contribute directly to pattern-forming vision, the ability to discriminate shapes and objects. However, the degree to which melanopsin-mediated phototransduction, versus that of rods and cones, contributes to this function is still largely unknown. Earlier attempts to quantify this contribution have relied on genetic knockout models that target key phototransductive proteins in rod and cone photoreceptors, ideally to isolate melanopsin-mediated responses. In this study we used the Gnat1-/-; Gnat2cpfl3/cpfl3 mouse model, which have global knockouts for the rod and cone α-transducin proteins. These genetic modifications completely abolish rod and cone photoresponses under light-adapted conditions, locking these cells into a "dark" state. We recorded visually evoked potentials in these animals and found that they still showed robust light responses, albeit with reduced light sensitivity, with similar magnitudes to control mice. These responses had characteristics that were in line with a melanopsin-mediated signal, including delayed kinetics and increased saturability. Additionally, we recorded electroretinograms in a sub-sample of these mice and were unable to find any characteristic waveform related the activation of photoreceptors or second-order retinal neurons, suggesting ipRGCs as the origin of light responses. Our results show a profound ability for melanopsin phototransduction to directly contribute to the primary pattern-forming visual pathway.

Keywords: ipRGCs; melanopsin; phototransduction; primary visual cortex; retina; transducin; vision; visual evoked potential.


Conflict of interest statement

The authors declare that the research was conducted in the absence of any commercial or financial relationships that could be construed as a potential conflict of interest.

Figures
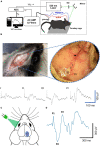
FIGURE 1
FIGURE 1
Visually evoked potential recording methodology. (A) Diagram of experimental setup for VEP recordings. (B) Characterization of spatial variability of VEP. (Left) A midsagittal incision through the dermis followed by dilation of connective tissue with a scalpel exposes the major cranial landmarks used for targeting of drill sites. (Inset) Locations used for VEP recordings are defined based on their relative distances from the bregma (black arrow) and the sagittal suture. As an exploratory measure, four active electrode drill sites (I–IV, red dotted circles) were drilled with a reference electrode site drilled rostral to the bregma (dotted black circle) and VEPs using each active electrode were recorded in the same experimental session. Resulting averaged VEP signals elicited with a 0.1 ms 520 nm laser stimulus are shown below. The site that resulted in the most robust VEP signal with most stereotypical waveform was site IV. (C) Based on the results in panel (B), for all LED and saturating stimuli experiments the active electrode drill site (red circle) was drilled ∼3.6 mm caudal to the bregma and 1.7 mm lateral to the midsagittal plane that equates to site IV. The reference electrode drill site (black circle) was drilled 1–2 mm rostral to the bregma and ∼0.3 mm lateral to the midsagittal plane. The active electrode site chosen lies roughly in the center of the primary visual cortex (V1). The reference electrode site was positioned to lie over the olfactory bulb. LED and laser stimuli were applied to the contralateral (left) eye to evoke potentials in the right cortex. (D) An example VEP signal collected after averaging 20 sweeps. A typical waveform included a first positive deflection (P1) followed by a first negative deflection (N1) followed by a second positive deflection (P2), from baseline. Mouse head schematic in (C) was sourced and modified with permission from https://scidraw.io.; http://doi.org/10.5281/zenodo.3925903.
FIGURE 2
FIGURE 2
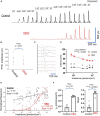
VEPs in DKO mice are consistent with a melanopsin-mediated mechanism. (A) Example averaged VEP responses for a control mouse (Top, black) and a DKO mouse (bottom, red) across 4 log units of light stimulus intensity. The photon irradiance delivered to the eye during each stimulus is shown. DKO responses only start to become apparent around 2 log units after threshold responses in controls. (B) Scatterplot of un-normalized P1N1 amplitudes at the highest 50-ms 532 nm LED flash (107 photons/μm2) intensity used. There was no significant difference in this maximal response amplitude between control and DKO animals. (C) Averaged responses (normalized to P1 amplitude) at maximal light stimulus from 4 control (black) and 4 DKO (red) mice, showing the delayed kinetics of DKO VEPs. Thin blue line represents stimulus onset. (D) Average ±SEM latencies of P1 peak in control (black) and DKO (red) mice across the highest six intensities used (which were the only intensities that provided consistent VEPs in DKO mice). At all of these intensities, DKO VEP latencies were significantly delayed compared to controls. (E) Scatterplot of normalized VEP power vs. irradiance for all control (black) and DKO (red) data. Representative naka-rushton fits to each dataset, along with accompanying fit parameters, are shown. (F) Extracted naka-rushton parameters from individual fits to each mouse. DKO mice had both I50 values and slopes that were significantly larger than controls. Data is plotted individually (filled circles and squares as indicated) and bars are averages ± SEM. *Level of significant difference via t-test or two-way ANOVA main-effects. *p < 0.01 and ****p < 0.0001. #Sidak multiple comparisons test p < 0.0001.
FIGURE 3
FIGURE 3
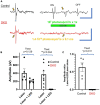
VEPs in DKO mice are highly photobleachable. (A) Typical VEPs elicited in control mice (top, black) and DKO mice (bottom, red) via 0.1 ms laser stimulation (520 nm, 1.4⋅106 photons/μm2 delivered to the eye) alone (left) or with the same laser stimulation stacked on top of a 1 s LED stimulus (532 nm, 107 photons/μm2 delivered to the eye, right). These saturating stimuli resulted in distinct LED-ON (ON), LED-OFF (OFF), and laser-induced responses in control mice, all of which are markedly absent in their DKO counterparts. Gold arrows indicate application of laser stimulus, usually accompanied by a distinguishable transient stimulus artifact. Scale bars represent 500 ms and 500 μV for both sets of traces. (B) Plots of average amplitudes ± SEM of the laser induced VEP alone vs. that measured during the saturating LED stimulus. Individual data points are shown for each control (black dots) and DKO (black triangles) mouse. Absolute amplitudes were not significantly reduced for control mice but were for DKO mice. (C) The same data as shown in panel (B), but the ratio of VEP induced by laser stimulus + LED to that induced by laser alone. Control mice had significantly more preserved VEP responses compared to DKO mice (the latter having no visible response during the saturating stimuli). *Level of significant difference via t-test. *p < 0.05 and **p < 0.01.
FIGURE 4
FIGURE 4
VEPs in DKO mice are independent of classical photoreception. Representative photopic ERG traces from control (top, black) and DKO (bottom, red) mice, elicited via 0.1 ms laser pulses (520 nm, 1.4⋅106 photons/μm2 delivered to the eye). In control animals, ERG waveforms were clearly discernable from individual sweeps (left), or after averaging (right), with a small a-wave, robust b-wave, and oscillatory potentials. These characteristics reflect the activation of photoreceptors, ON bipolar cells and retinal interneurons, respectively. However, in the DKO mice none of these features were present, before (left) or after (right) averaging. Gold arrows indicate the onset of laser stimulus, accompanied by electrical artifacts. Similar ERG responses were recorded in n = 5 control and n = 5 DKO mice. The example waveforms shown here have been further cleaned with a 4-pole low-pass butterworth filter with a cutoff frequency of 200 hz.
FIGURE 5
FIGURE 5
VEPs in DKO mice are not attributable to heat-induced optocapacitive excitation. Examples of VEPs recorded from three separate control mice with a 520 nm laser (8.4⋅106 photons/μm2 delivered to the eye, left) and an 808 nm laser (3.5⋅107 and 5.9⋅107 photons/μm2 delivered to the eye, middle, right). For all three animals, VEP responses were robust upon 520 nm laser stimulation, but were markedly absent upon 808 nm laser stimulation, at equal or greater stimulus duration. Laser stimulus onsets and durations are as indicated. No positive VEP was recorded at any point when using the 808 nm laser as stimulus, suggesting that the localized tissue heating at this power level was insufficient to depolarize retinal neurons.
FIGURE 6
FIGURE 6
Confirmation of DKO phenotype and genotype. (A) Representative immunofluorescence images of retinal cross-sections stained for rod α-transducin (top, Gnat1, gold) and cone α-transducin (bottom, Gnat2, gold) in a control mouse (left) and a DKO mouse (right). White dashed lines delineate the photoreceptor outer segments layer. For Gnat1 staining (top) red arrows point to the presence of robust Gnat1 staining in the outer segments of rod photoreceptors. This staining is undetectable in DKO mice (top, right, red arrow), suggesting a successful knockout of Gnat1 expression. In both images, a large amount of autofluorescence is present at the border between the photoreceptor layer and outer nuclear layer, which was attributed to non-specific staining by the secondary antibody (as shown by a no-primary antibody control, data not shown). For Gnat2 staining (bottom), cone α-transducin expression was clearly present in the oval-shaped outer segments of cone photoreceptors (indicated by red arrows) in the control animals (bottom, left). This staining pattern was totally absent from our DKO retinal slices (bottom, right), suggesting that Gnat2 expression was significantly reduced. (B) Example 1% agarose gels showing the genotyping of a control mouse (left) and a DKO mouse (right), as described in our methods. For gnat1, the control and knockout bands were located at ∼300 and ∼200 bp, respectively. For Gnat2, the control and knockout bands were located at ∼480 and ∼300 bp, respectively. Our DKO animals showed the proper homozygous band pattern we would expect.

Similar articles

Cited by

References

    1. Allen A. E., Cameron M. A., Brown T. M., Vugler A. A., Lucas R. J. (2010). Visual responses in mice lacking critical components of all known retinal phototransduction cascades. PLoS One 5:e15063. 10.1371/journal.pone.0015063 - DOI - PMC - PubMed
    1. Allen A. E., Martial F. P., Lucas R. J. (2019). Form vision from melanopsin in humans. Nat. Commun. 10:2274. 10.1038/s41467-019-10113-3 - DOI - PMC - PubMed
    1. Allen A. E., Storchi R., Martial F. P., Petersen R. S., Montemurro M. A., Brown T. M., et al. (2014). Melanopsin-driven light adaptation in mouse vision. Curr. Biol. 24 2481–2490. 10.1016/j.cub.2014.09.015 - DOI - PMC - PubMed
    1. Altimus C. M., Güler A. D., Villa K. L., McNeill D. S., Legates T. A., Hattar S. (2008). Rods-cones and melanopsin detect light and dark to modulate sleep independent of image formation. Proc. Natl. Acad. Sci. U.S.A. 105 19998–20003. 10.1073/pnas.0808312105 - DOI - PMC - PubMed
    1. Amamoto R., Wallick G. K., Cepko C. L. (2022). Retinoic acid signaling mediates peripheral cone photoreceptor survival in a mouse model of retina degeneration. eLife 11:e76389. 10.7554/eLife.76389 - DOI - PMC - PubMed

LinkOut - more resources