. 2023 Jan;76(1):56-85.
doi: 10.1177/00197939221099184.

Schooling and Parental Labor Supply: Evidence from COVID-19 School Closures in the United States

Affiliations

Schooling and Parental Labor Supply: Evidence from COVID-19 School Closures in the United States

Catalina Amuedo-Dorantes et al. Ind Labor Relat Rev. 2023 Jan.

Abstract

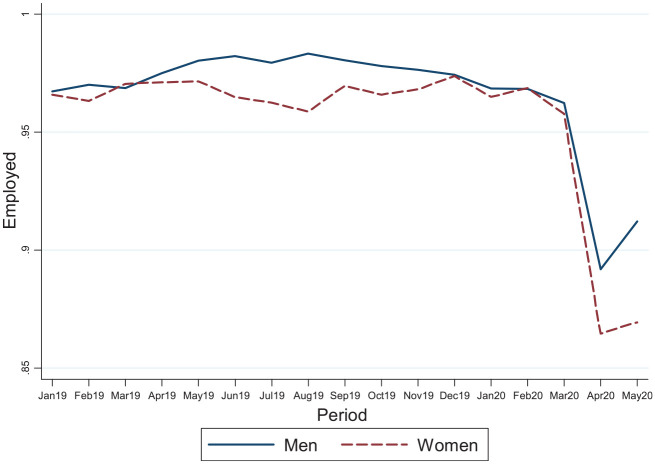
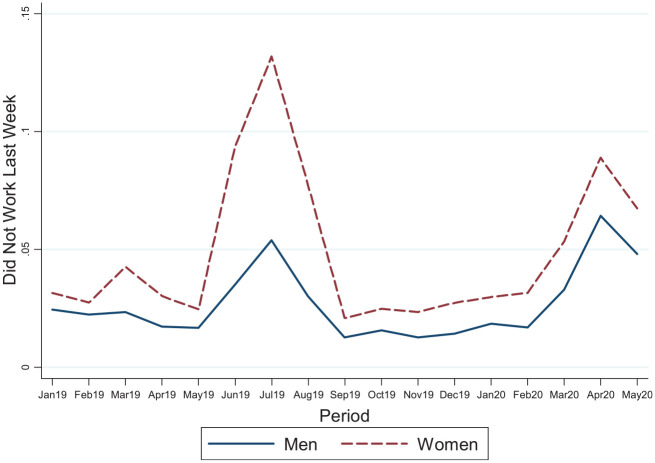
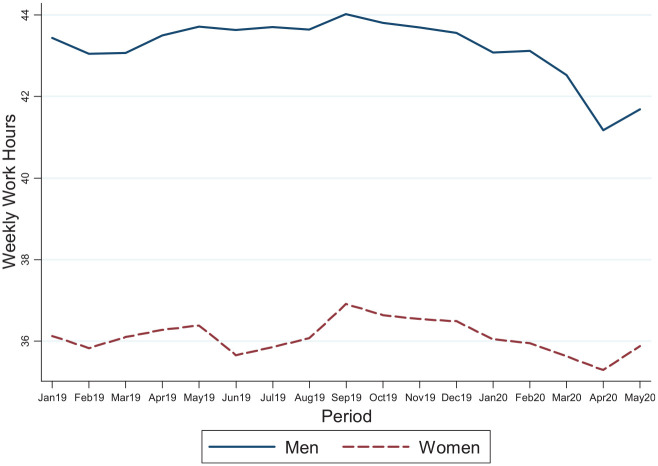
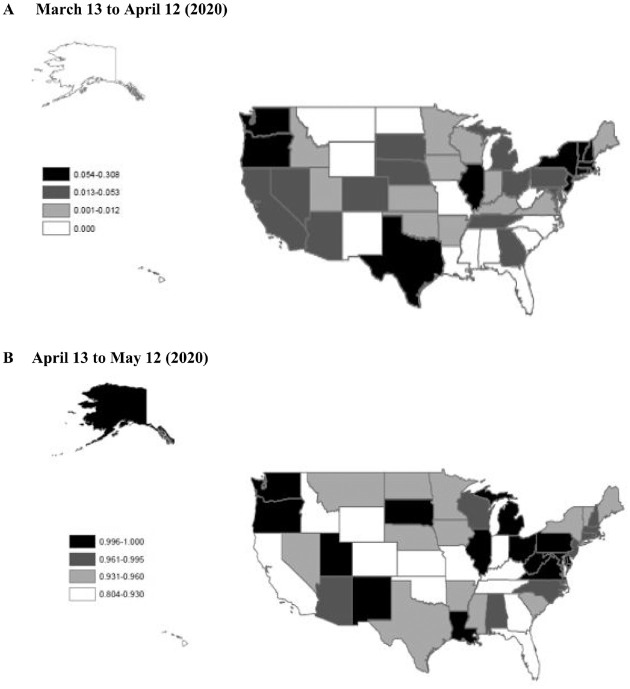
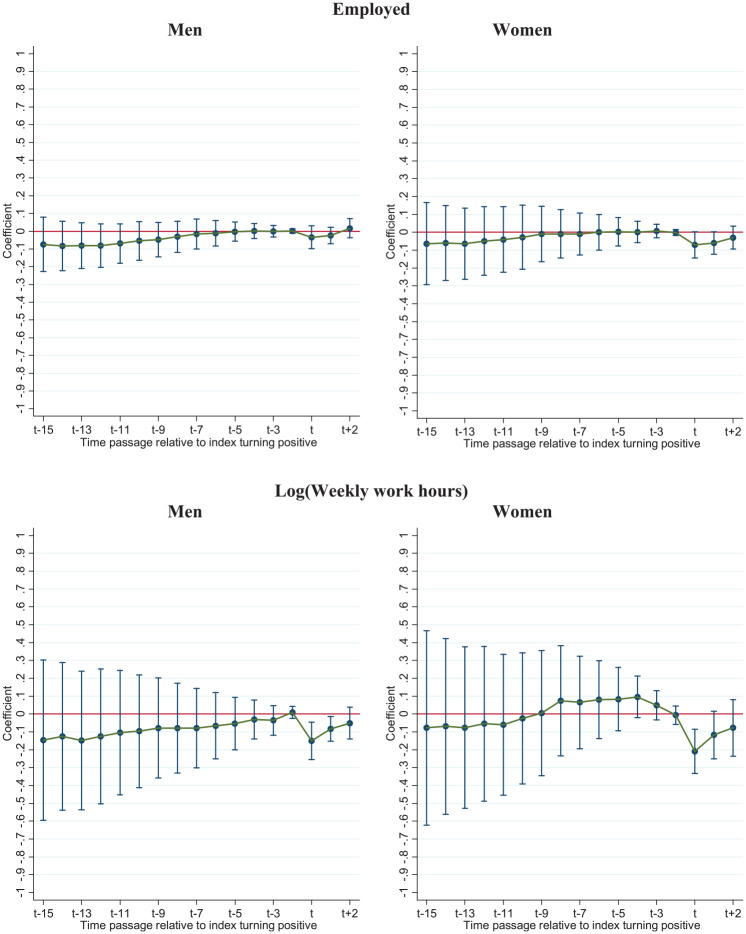
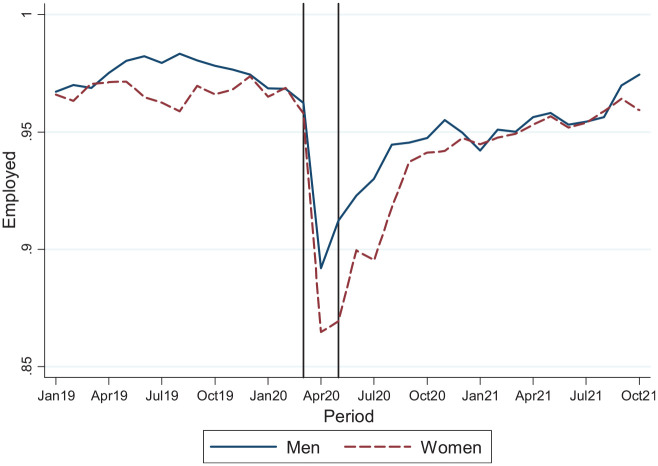
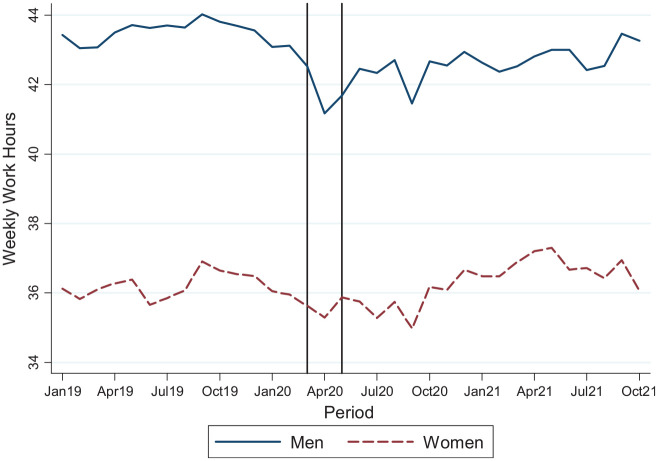
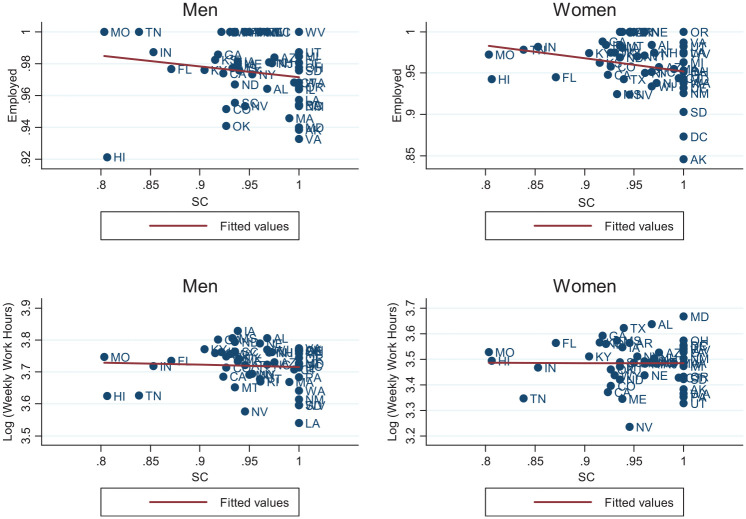
This article examines changes in parental labor supply in response to the unanticipated closure of schools following the onset of the COVID-19 pandemic in the United States. The authors collect detailed daily information on school closures at the school-district level, which they merge to individual-level data on labor supply and sociodemographic characteristics from the monthly Current Population Survey spanning from January 2019 through May 2020. Using a difference-in-differences estimation approach, the authors find evidence of non-negligible labor supply reductions. Having a partner at home helped offset the negative effect of school closures, particularly for maternal employment, although respondents' job traits played a more significant role in shaping labor supply responses to school closures. Overall, the labor supply impacts of school closures prove robust to identification checks and to controlling for other coexistent social distancing measures. In addition, these early school closures seem to have had a long-lasting negative impact on parental labor supply.

Keywords: COVID-19; United States; parental labor supply; school closures.


Figures

Figure 1.
Figure 1.
Employment for Two-Parent Households by Gender Notes: This figure plots the evolution of the mean of our labor outcome variable “Employed” by gender from January 2019 to May 2020. The sample includes individuals between 16 and 64 years old from two-parent households with at least one child between 6 and 12 years old. Employment is analyzed using a sample of civilian, not institutionalized, individuals.
Figure 2.
Figure 2.
Did Not Work Last Week for Two-Parent Households by Gender Notes: This figure plots the evolution of the mean of our labor outcome variable “Did Not Work Last Week” from January 2019 to May 2020. The sample includes individuals between 16 and 64 years old from two-parent households with at least one child between 6 and 12 years old. We use a sample of individuals currently employed when studying “Did Not Work Last Week” (those at work and those who have a job but did not work the last week).
Figure 3.
Figure 3.
Weekly Work Hours for Two-Parent Households by Gender Notes: This figure plots the evolution of the mean of our labor outcome “Weekly Work Hours” from January 2019 to May 2020. The sample includes individuals between 16 and 64 years old from two-parent households with at least one child between 6 and 12 years old. We consider a sample of individuals who report being at work during the prior week when we analyze the “Weekly Work Hours.”
Figure 4.
Figure 4.
Geographic Variation in the SC Index over Time Notes: Darker colors correspond to higher levels on the school closure (SC) index (meaning that more counties in the state had closed schools) in each state and month (see Table 1).
Figure 5.
Figure 5.
Event Study Notes: These figures display the coefficients from the event study for our main sample of two-parent households, along with 95% confidence intervals. Estimates are provided in Table A.8.
Figure 6.
Figure 6.
Employment for Two-Parent Households by Gender (Jan 2019–Oct 2021) Notes: This figure plots the evolution of the mean of our labor outcome variable from January 2019 to October 2021. The sample includes individuals between 16 and 64 years old from two-parent households with at least one child between 6 and 12 years old.
Figure 7.
Figure 7.
Weekly Work Hours for Two-Parent Households by Gender (Jan 2019–Oct 2021) Notes: This figure plots the evolution of the mean of our labor outcome “Weekly Work Hours” from January 2019 to October 2021. The sample includes individuals between 16 and 64 years old from two-parent households with at least one child between 6 and 12 years old. We consider a sample of individuals who report being at work during the prior week when we analyze the “Weekly Work Hours.”
Figure 8.
Figure 8.
Long-Term Implications of Early School Closures Notes: These figures display the coefficients from estimating Equation (6) in footnote 17 for our main sample of two-parent households. The p values for hours worked by men and women equal 0.000 and 0.064, respectively.

References

    1. Adams-Prassl Abi, Boneva Teodora, Golin Marta, Rauh Christopher. 2020. Inequality in the impact of the coronavirus shock: Evidence from real time surveys. Journal of Public Economics 189: 104245. 10.1016/j.jpubeco.2020.104245 - DOI
    1. Adda Jérôme. 2016. Economic activity and the spread of viral diseases: Evidence from high frequency data. Quarterly Journal of Economics 131(2): 891–941. 10.1093/qje/qjw005 - DOI
    1. Akerlof George A., Kranton Rachel E.2000. Economics and identity. Quarterly Journal of Economics 115(3): 715–53. 10.1162/003355300554881 - DOI
    1. Allcott Hunt, Boxell Levi, Conway Jacob C., Gentzkow Matthew Aaron, Thaler Michael, Yang David Y.2020. Polarization and public health: Partisan differences in social distancing during the coronavirus pandemic. Journal of Public Economics 191: 104254. 10.1016/j.jpubeco.2020.104254 - DOI - PMC - PubMed
    1. Alon Titan, Doepke Matthias, Olmstead-Rumsey Jane, Tertilt Michèle. 2020. This time it’s different: The role of women’s employment in a pandemic recession. IZA Discussion Paper No. 13562. Bonn, Germany: Institute of Labor Economics.