. 2023 Jan 1;136(1):jcs260027.
doi: 10.1242/jcs.260027. Epub 2023 Jan 6.

Incorporation of 53BP1 into phase-separated bodies in cancer cells during aberrant mitosis

Affiliations

Incorporation of 53BP1 into phase-separated bodies in cancer cells during aberrant mitosis

Marina Bleiler et al. J Cell Sci. .

Abstract

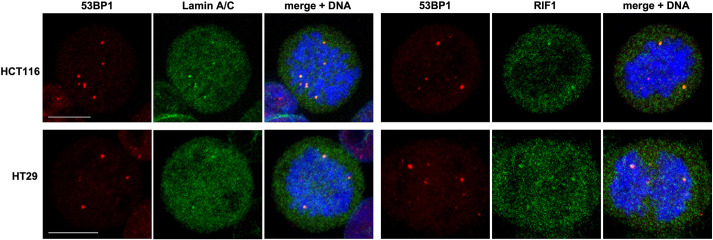
53BP1 (also known as TP53BP1) is a key mediator of the non-homologous end joining (NHEJ) DNA repair pathway, which is the primary repair pathway in interphase cells. However, the mitotic functions of 53BP1 are less well understood. Here, we describe 53BP1 mitotic stress bodies (MSBs) formed in cancer cell lines in response to delayed mitosis. These bodies displayed liquid-liquid phase separation characteristics, were close to centromeres, and included lamin A/C and the DNA repair protein RIF1. After release from mitotic arrest, 53BP1 MSBs decreased in number and moved away from the chromatin. Using GFP fusion constructs, we found that the 53BP1 oligomerization domain region was required for MSB formation, and that inclusion of the 53BP1 N terminus increased MSB size. Exogenous expression of 53BP1 did not increase MSB size or number but did increase levels of MSB-free 53BP1. This was associated with slower mitotic progression, elevated levels of DNA damage and increased apoptosis, which is consistent with MSBs suppressing a mitotic surveillance by 53BP1 through sequestration. The 53BP1 MSBs, which were also found spontaneously in a subset of normally dividing cancer cells but not in non-transformed cells (ARPE-19), might facilitate the survival of cancer cells following aberrant mitoses. This article has an associated First Person interview with the first author of the paper.

Keywords: 53BP1; ARPE-19; Colon cancer cell lines; Lamin A/C; Mitotic arrest; Mitotic stress; RIF1.


Conflict of interest statement

Competing interests The authors declare no competing or financial interests.

Figures

Fig. 1.
Fig. 1.
53BP1 in normally dividing and mitotically arrested cells. (A) Normally dividing HCT116 and ARPE-19 cells were stained with an anti-53BP1 polyclonal antibody, an antibody against centromeric marker CENP-A and DAPI dye marking DNA. Immunofluorescence images of a representative mitotic cell from each cell line are shown. Dashed boxes mark regions highlighted in the expanded images showing individual chromosomes with 53BP1 localized to centromere regions (note the double CENP-A foci). (B) HCT116 cells during normal division (left), during mitotic arrest using AK306 (100 nM; middle) and after release from arrest (right). Cells were stained with an anti-53BP1 antibody and with DAPI to mark DNA. (C) HCT116 cells were arrested in mitosis (AK306, 100 nM) and stained with antibody against phosphorylated 53BP1 (p53BP1; Ser25/Ser29). DNA was labeled using DAPI. (D) HCT116 cells were transfected with 53BP1-targeting siRNA or control non-targeting siRNA, arrested with AK306 (100 nM) for 6 h, then fixed and stained with anti-53BP1 antibody. For each treatment, the image on the left shows anti-53BP1 labeling and the image on the right shows anti-53BP1 labeling and DAPI-stained DNA. (E) HCT116 cells were treated with different mitotic inhibitors – AK306 (100 nM), nocodazole (200 nM), Colcemid (50 ng/ml; image not shown) and paclitaxel (10 nM) (three left panels) – or with AK306 (100 nM), and ICRF-193 (10 μM) (two right panels) for 5 h. Cells were then stained with anti-53BP1 antibody and randomly selected for imaging. Cells in right panels were additionally stained with anti-topoisomerase IIα antibody (TOPO IIα). DNA was stained using DAPI. Scale bars: 10 μm. (F) Quantification of the number of foci per cell after treatment with the different inhibitors as described in E (cells with at least one focus were counted; 100 cells per condition, derived from three experiments; each dot represents one cell). No significant differences were found between the treatments using an ordinary one-way ANOVA (P>0.05). (G) Two colon cancer cell lines (HCT116 and HT29) and one non-transformed cell line (ARPE-19) were treated with AK306 (100 nM) to induce mitotic arrest, fixed and stained with anti-53BP1 antibody. DNA was labeled using DAPI. Scale bars: 10 µm. Images in A, C and G are representative of three experiments. Images in B and D are representative of at least six experiments.
Fig. 2.
Fig. 2.
53BP1 MSBs are characterized by relatively large size and LLPS properties. (A) Super-resolution image of a 53BP1 MSB (gray) from a HCT116 colon cancer cell was obtained using the STED technique. (B) HCT116 cells were arrested in mitosis using AK306 (100 nM), then treated with 0.4 M sorbitol or 0.3 M sodium chloride for 1 h and stained with anti-53BP1 antibody (gray) and DNA dye (DAPI, blue). (C) HCT116 cells were arrested in mitosis using AK306 (100 nM), then treated with 3% 1,6-hexanediol in a fresh medium for 25 min (left panels). Images of cells 1 h after 1,6-hexanediol washout are also shown (right panels). Cells were stained with anti-53BP1 antibody and DNA dye. Scale bar: 10 μm. Images in A–C are representative of three experiments.
Fig. 3.
Fig. 3.
Formation of 53BP1 bodies at a subset of centromeres in mitotically arrested HCT116 cells. (A) Mitotically arrested cells (AK306, 100 nM) were fixed and stained for 53BP1 and centromeric marker CENP-A. The enlarged images showing the regions indicated by arrows were limited to 0.6–0.9 µm in the z dimension to better show the relationship between the CENP-A marker and 53BP1. DNA was stained using DAPI. Scale bar: 5 µm. (B) Cells were arrested (AK306, 100 nM) over a time course and stained for 53BP1 (gray). Representative images of cells at 1, 5.5, 11 and 22 h of arrest are shown. Scale bar: 5 µm. (C) Quantification of the number of 53BP1 foci per cell (left) and their area (right) at 5.5, 11 and 22 h of mitotic arrest, as described in B. Data are mean±s.d. of n=40, 52 and 53 cells (left) or n=255, 286 and 246 foci (right) for the 5.5, 11 and 22 h time points, respectively. Statistical significance was determined by one-way ANOVA with Tukey's post-hoc test (foci per cell) or Kruskal–Wallis test with Dunn's post-hoc test (area per focus). *P<0.05; ****P<0.0001. (D) Cells were released for 2 h after 5 h of mitotic arrest with AK306 (100 nM), before labeling using anti-53BP1 antibody and DAPI DNA stain. Representative images of cells at different mitotic stages are shown (prophase in the left panel to telophase in the right panel). Mitotic stages were identified approximately, based on chromatin morphology. Scale bar: 5 μm. Images in A and D are representative of four and six experiments, respectively.
Fig. 4.
Fig. 4.
Relative localization of 53BP1, lamin A/C and RIF1 in mitotically arrested HCT116 cells. (A) Representative immunofluorescence images showing the relationship between 53BP1 and lamin A/C in a mitotically arrested cell (AK306, 100 nM; top panels) and an interphase cell with high levels of 53BP1 staining (bottom panels). Scale bar: 10 µm. (B) STED images showing relative positioning of 53BP1 and lamin A/C within MSBs. Two examples of MSBs are shown in the top and bottom panels. Cells were arrested with 100 nM AK306 and co-stained with anti-53BP1 and anti-lamin A/C antibodies. (C) Representative images of mitotically arrested cells (AK306, 100 nM) treated with non-targeting control siRNA (left panel) or 53BP1-targeting siRNA (right panel) and stained for lamin A/C. Scale bar: 5 μm. (D) Cells were arrested in mitosis (AK306, 100 nM) and then treated with 1,6-hexanediol (top panel). An arrested cell after withdrawal of 1,6-hexanediol is shown in the bottom panel. Cells were stained for 53BP1 and lamin A/C. Scale bar: 10 μm. (E) Relative positioning of 53BP1 and RIF1 in a mitotically arrested cell (AK306, 100 nM). In A and C–E, DNA was stained using DAPI. Scale bar: 10 μm. Images in A and C–E are representative of four and three experiments, respectively. Images in B are representative of two STED experiments of a colocalization routinely observed by confocal microscopy.
Fig. 5.
Fig. 5.
Relative localization of 53BP1 and γH2AX in mitotically arrested HCT116 cells. Cells were treated with AK306 (100 nM) for 5 h, fixed and stained with antibodies against 53BP1 and the marker of DNA DSBs, γH2AX. Representative immunofluorescence images of γH2AX-positive cells are shown. Panels on the left show cells that progressed to mitotic arrest state and formed 53BP1 MSBs. Panels on right show interphase cells from the same experiment. DNA was stained using DAPI. Images are representative of three experiments. Scale bars: 5 µm.
Fig. 6.
Fig. 6.
Selective incorporation of GFP–53BP1 constructs into MSBs. (A) Schematic of 53BP1 domain structure (top) and the GFP–53BP1 constructs used in this study (bottom). The full-length 53BP1 is comprised of three regions: the N-terminal region, the MFFR and the C terminal region. The N-terminal region contains 28 S/T-Q sites phosphorylated by ATM/ATR. The MFFR contains a group of components essential for focal recruitment of 53BP1 to damaged chromatin. These include the OD, two tandem TDs, as well as Gly- and Arg-rich (GAR) and ubiquitylation-dependent recruitment (UDR) motifs. The C-terminal tail includes two tandem BRCT domains involved in stress response signaling. In the construct schematics, plus symbols in the OD+ and TD+ constructs indicate the inclusion of extra residues adjacent to the OD and TD domains, respectively. Amino acid residue numbers are indicated. N, N-terminal region. (B) HCT116 cells were transfected with the indicated GFP-53BP1 constructs, then arrested in mitosis with AK306 (100 nM), fixed, and stained with anti-53BP1 antibody. The green signal is from exogenous GFP–53BP1 protein, and the gray signal is from anti-53BP1 antibody staining. Arrowheads point to small 53BP1 foci. The bottom row shows the relationship between GFP-53BP1 and DNA (stained using DAPI). Scale bar: 10 µm. Note, the anti-53BP1 antibody binds to the N-terminal region of 53BP1. (C) Schematic showing correlation between the GFP–53BP1 constructs capable of incorporation into MSBs and the size of MSBs formed. (D) HCT116 cells were transfected with GFP–53BP1 and treated as in B. Left panels show a representative cell with GFP–53BP1 expression. Right panels show a representative cell without GFP–53BP1 plasmid uptake. Staining with anti-53BP1 antibody shows total 53BP1 distribution with increased GFP–53BP1 expression outside MSBs in transfected cell. Scale bar: 10 μm. Images in B and D are representative of three experiments.
Fig. 7.
Fig. 7.
Effects of 53BP1 exogenous expression and 53BP1 knockdown in HCT116 cells released from mitotic arrest. (A) Cells expressing GFP–53BP1 or GFP alone (control) were fixed, stained with DAPI and randomly selected for imaging. Mitotic progression was quantified based on chromatin morphology. Fisher's exact test was used to compare mitotic phase distributions (60 mitotic cells per condition from three experiments). Results are displayed as percentage of mitotic cells. (B) Cells expressing GFP–53BP1 or GFP were stained with fluorescent conjugate of annexin V, then fixed, stained with DAPI to label DNA and imaged. Representative images are shown. Scale bar: 10 μm. (C) Quantification of annexin V-positive cells (displayed as a percentage of GFP-positive cells). Fisher's exact test was used to determine statistical significance (732 and 1098 cells for GFP–53BP1 and control, respectively, from three independent experiments). (D) Cells expressing GFP–53BP1 or GFP were stained with anti-γH2AX antibody. DNA was labeled using DAPI. Selected images of mitotic cells expressing GFP–53BP1 are shown. Top row shows a dividing cell with multiple γH2AX foci, bottom row shows a cell with extensive γH2AX staining. The cell is completing division. Scale bar: 10 µm. (E) Mitotic GFP-positive cells were quantified to assess the number of γH2AX foci per cell. Data are presented as mean±s.d. of n=159 GFP–53BP1 cells and 165 control cells (from three trials with more than 50 cells per trial), analyzed using ordinary two-way ANOVA with Holm–Šídák post-hoc test. *P<0.05; ***P<0.001. (F–H) The effects of 53BP1 knockdown were assayed in HCT116 cells at 2 h after release from mitotic arrest by 100 nM AK306 treatment. (F) Cells expressing 53BP-targeting siRNA or non-targeting siRNA (control) were fixed and stained with anti-β-tubulin, anti-phospho-histone H3 and anti-Aurora kinase B antibodies before imaging. Mitotic cells with midbody and without midbody were counted; one midbody represents one divided cell. Fisher's exact test was used to determine statistical significance (n=963 53BP1 siRNA-treated mitotic cells and n=1064 non-targeting siRNA-treated mitotic cells from three independent experiments). Results are displayed as percentage of mitotic cells in each category. (G) Cells expressing 53BP1-targeting siRNA or non-targeting siRNA were stained with fluorescent conjugate of annexin V before being fixed, imaged and evaluated for presence of annexin V staining. Statistical analysis was performed using Fisher's exact test (n=928 53BP1 siRNA-treated cells and 993 control cells, from three independent experiments). Results are displayed as percentage of all evaluated cells. (H) Cells expressing 53BP1-targeting siRNA or non-targeting siRNA were stained for γH2AX. Mitotic cells were quantified to assess the number of γH2AX foci per cell. Data are presented as mean±s.d. of n=633 53BP1 siRNA-treated cells and 616 control cells (from three trials with more than 200 cells per trial), analyzed using ordinary two-way ANOVA with Holm–Šídák post-hoc test (ns, not significant).
Fig. 8.
Fig. 8.
Formation of 53BP1 mitotic foci in non-arrested cell cultures. HCT116 (top) and HT29 (bottom) cells were stained with either anti-53BP1 and anti-lamin A/C antibodies (left) or anti-53BP1 and anti-RIF1 antibodies (right). DNA was stained using DAPI. Selected images of mitotic cells are shown. Images are representative of three experiments. Scale bars: 10 µm.

Similar articles

Cited by

References

    1. Andreassen, P.R., Ho, G.P. and D'Andrea, A.D. (2006). DNA damage responses and their many interactions with the replication fork. Carcinogenesis 27, 883-892. 10.1093/carcin/bgi319 - DOI - PubMed
    1. Aparicio, T., Baer, R. and Gautier, J. (2014). DNA double-strand break repair pathway choice and cancer. DNA Repair. 19, 169-175. 10.1016/j.dnarep.2014.03.014 - DOI - PMC - PubMed
    1. Bernal, A. and Tusell, L. (2018). Telomeres: implications for cancer development. Int. J. Mol. Sci. 19, 294. 10.3390/ijms19010294 - DOI - PMC - PubMed
    1. Bond, M. J., Bleiler, M., Harrison, L. E., Scocchera, E. W., Nakanishi, M., G-Dayanan, N., Keshipeddy, S., Rosenberg, D. W., Wright, D. L. and Giardina, C. (2018). Spindle assembly disruption and cancer cell apoptosis with a CLTC-binding compound. Mol. Cancer Res. 16, 1361-1372. 10.1158/1541-7786.MCR-18-0178 - DOI - PMC - PubMed
    1. Cesare, A. J. (2014). Mitosis, double strand break repair, and telomeres: a view from the end: How telomeres and the DNA damage response cooperate during mitosis to maintain genome stability. BioEssays 36, 1054-1061. 10.1002/bies.201400104 - DOI - PMC - PubMed

Publication types

Substances