. 2023 May 1;72(5):575-589.
doi: 10.2337/db22-0506.

DNA Methylation-Dependent Restriction of Tyrosine Hydroxylase Contributes to Pancreatic β-Cell Heterogeneity

Affiliations

DNA Methylation-Dependent Restriction of Tyrosine Hydroxylase Contributes to Pancreatic β-Cell Heterogeneity

Nazia Parveen et al. Diabetes. .

Erratum in

Abstract

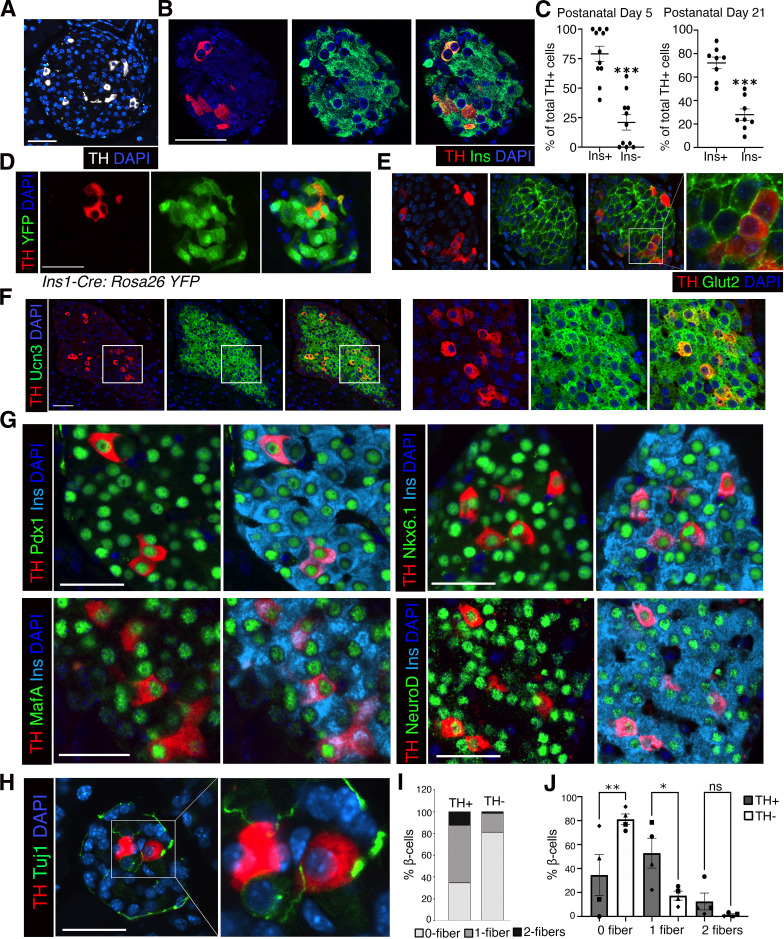
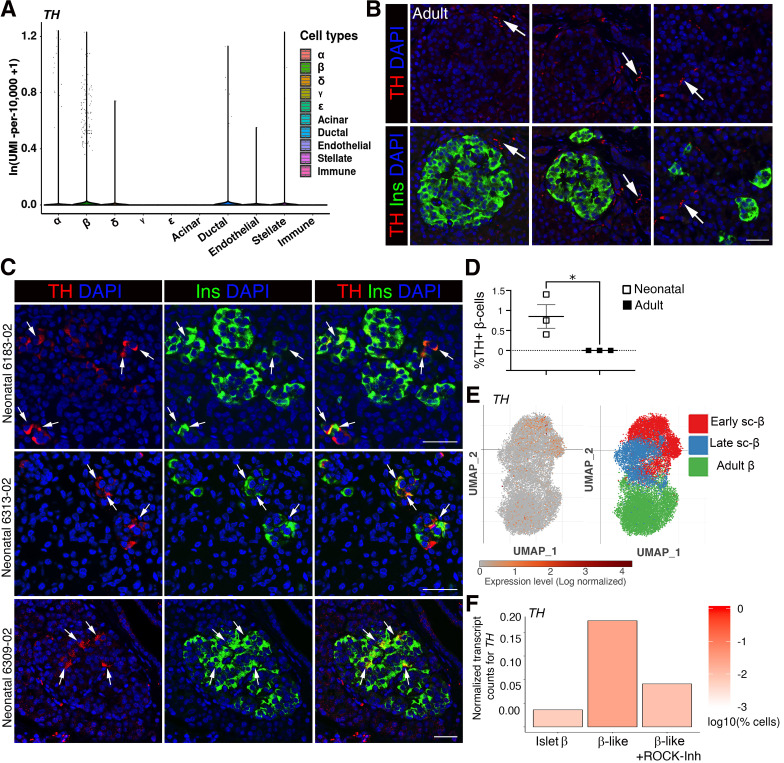
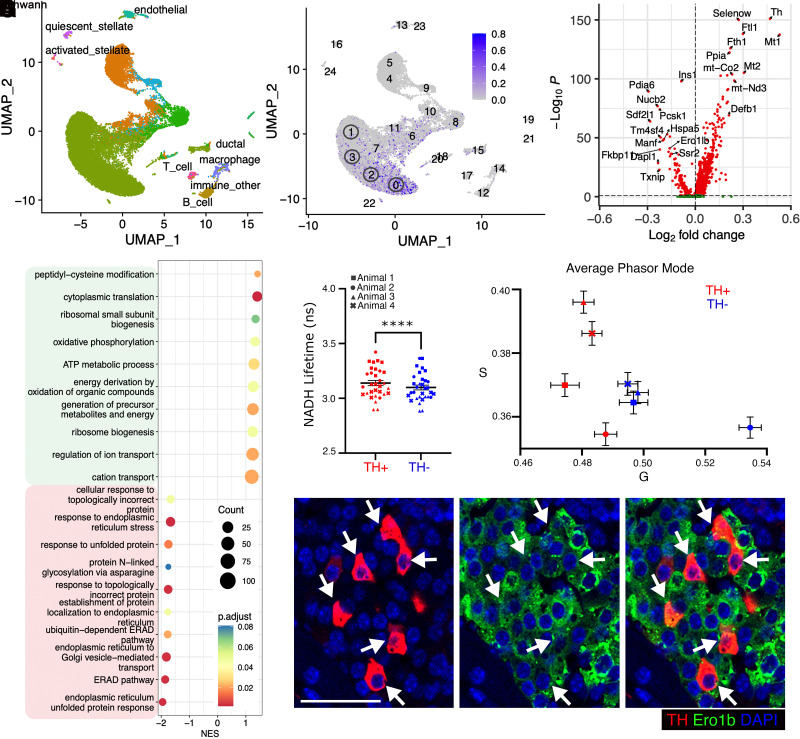
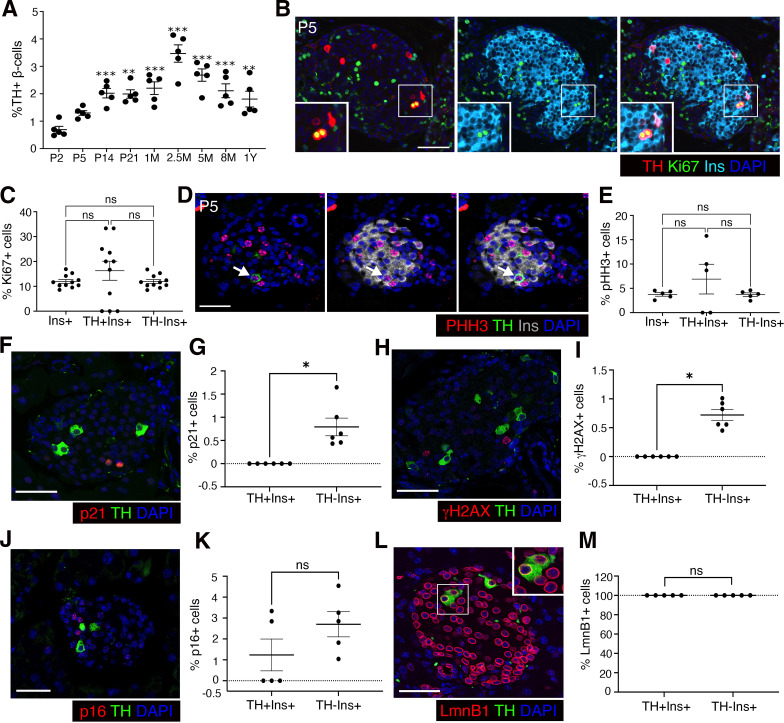
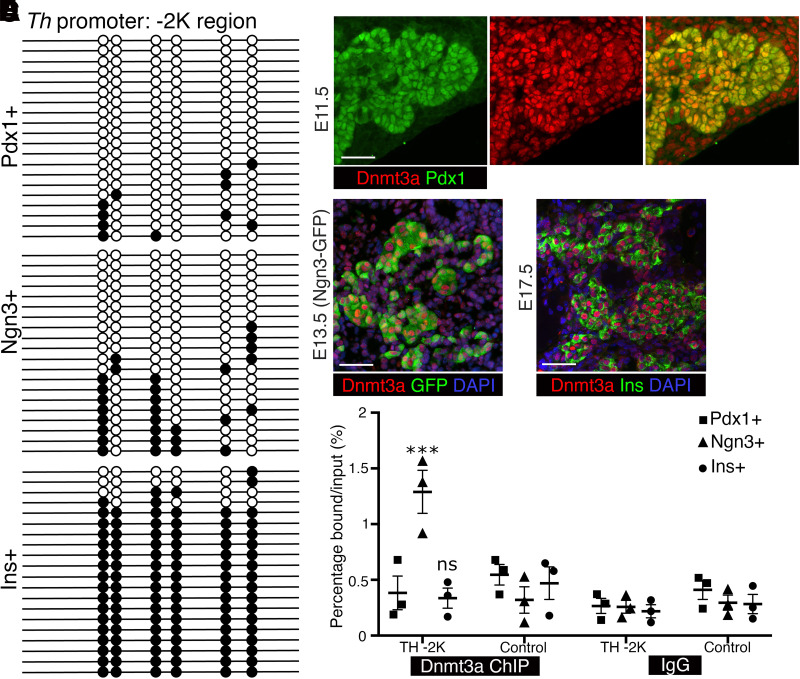
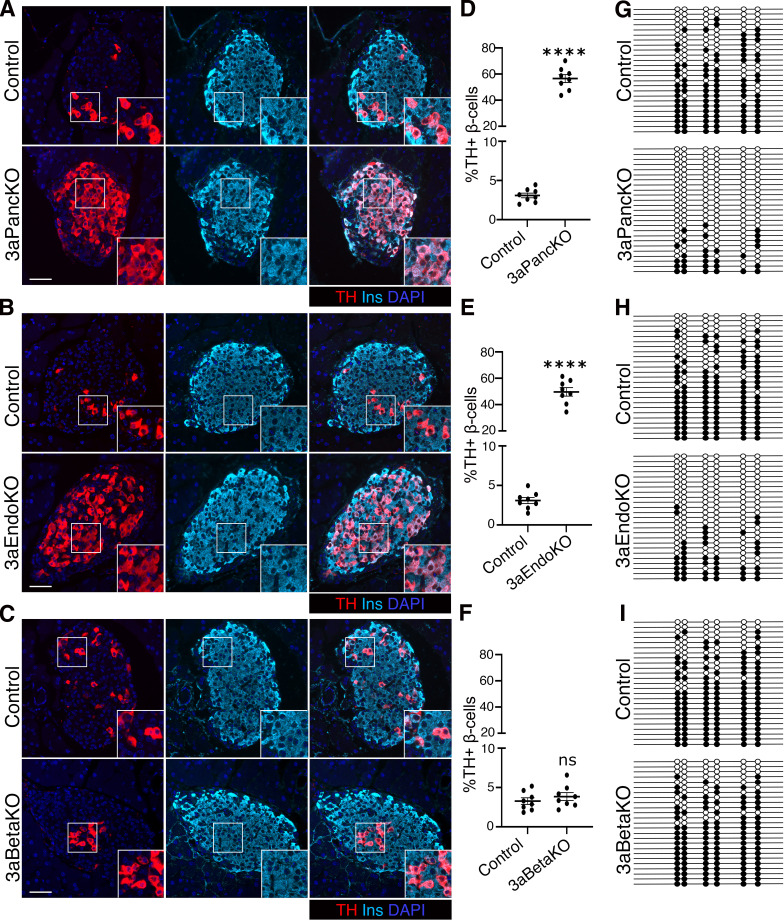
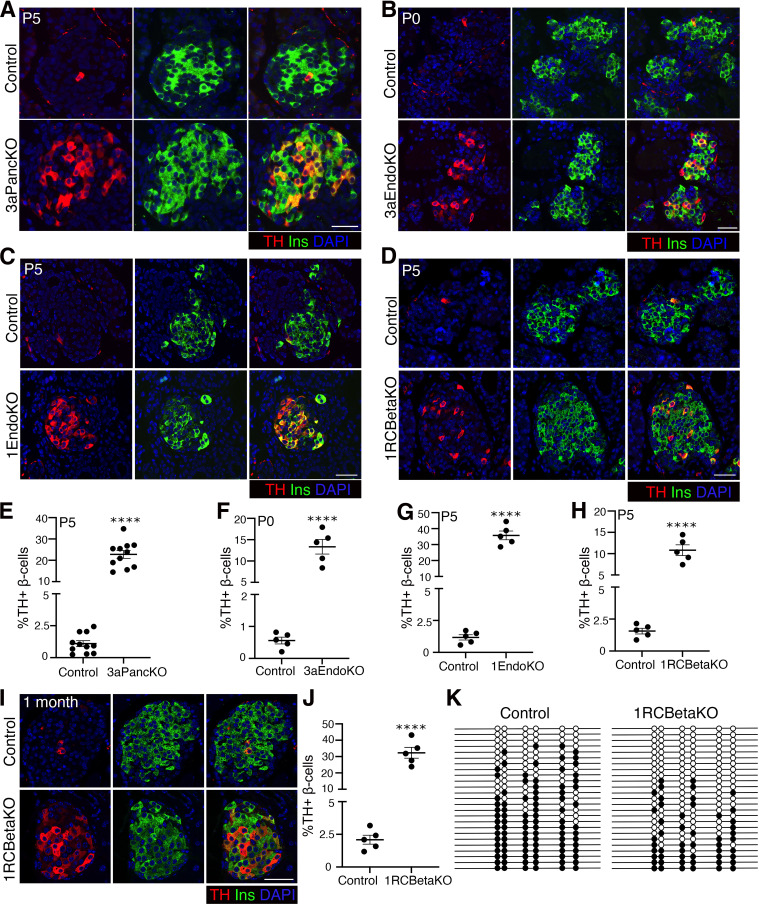
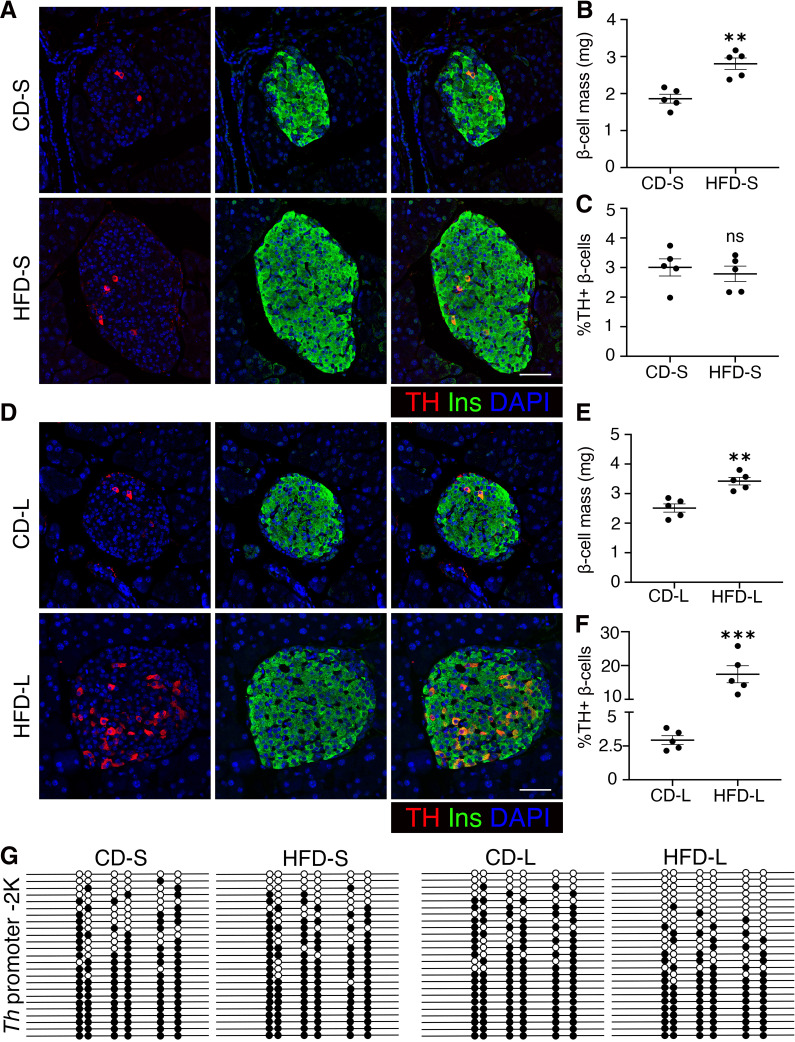
The molecular and functional heterogeneity of pancreatic β-cells is well recognized, but the underlying mechanisms remain unclear. Pancreatic islets harbor a subset of β-cells that co-express tyrosine hydroxylase (TH), an enzyme involved in synthesis of catecholamines that repress insulin secretion. Restriction of the TH+ β-cells within islets is essential for appropriate function in mice, such that a higher proportion of these cells corresponds to reduced insulin secretion. Here, we use these cells as a model to dissect the developmental control of β-cell heterogeneity. We define the specific molecular and metabolic characteristics of TH+ β-cells and show differences in their developmental restriction in mice and humans. We show that TH expression in β-cells is restricted by DNA methylation during β-cell differentiation. Ablation of de novo DNA methyltransferase Dnmt3a in the embryonic progenitors results in a dramatic increase in the proportion of TH+ β-cells, whereas β-cell-specific ablation of Dnmt3a does not. We demonstrate that maintenance of Th promoter methylation is essential for its continued restriction in postnatal β-cells. Loss of Th promoter methylation in response to chronic overnutrition increases the number of TH+ β-cells, corresponding to impaired β-cell function. These results reveal a regulatory role of DNA methylation in determining β-cell heterogeneity.


Conflict of interest statement

Duality of Interest. No potential conflicts of interest relevant to this article were reported.

Figures

Figure 1
Figure 1
TH+ islets cells co-expressing insulin (Ins) represent a bona fide β-cell subpopulation. A and B: Immunostaining for TH (gray) (A); TH (red) and insulin (green) (B); and DAPI (blue). C: Quantification of TH+ cells assessed for insulin expression (shown as percentage of total TH+ cells) at P5 (left panel: n = 700 β-cells/pancreas, n = 11 pancreas) and P21 (right panel: n = 1,200 β-cells per pancreas, n = 8 pancreas). D: Representative images from Ins1-Cre:Rosa26 YFP mice (2 months old) stained for TH (red), yellow fluorescent protein (YFP; green), and DAPI (blue). E and F: Immunostaining for TH (red) with Glut2 (green) (E) or Urocortin3 (Ucn3; green) (F), and DAPI (blue). The far right panel in E and the three right panels in F show a ×2.5 magnification of the area marked by a white square. G: Immunostaining for TH (red), Pdx1/Nkx6.1/MafA/NeuroD1 (green), with DAPI (blue). H: Immunostaining for TH (red) with Tuj1 (green). Right panel is a ×2.5 magnification of the area in the white box. I and J: Quantification of Tuj1 plus fiber contact with TH+ and TH β-cells (n = 2,000 β-cells per slide, two slides spanning 100 μm for each pancreas, n = 4 pancreas), showing percentages of contact with none, one, or two fibers (I), and comparison of each category between the TH+ and TH β-cells (J). A, B, D–H: Representative images from adult (aged 2 months) C57BL/6J mice (n = 5 mice); at least 25 independent images per pancreas were acquired. C: Data from 11 and 8 C57BL/6J pups at P5 and P21, respectively. I and J: Average distribution (I) and individual (J) data from four mice, with each point in I representing data from individual mice. Error bars show SEM. *P < 0.05, **P < 0.01, ***P < 0.005 by two-tailed Student t test (C) and one-way ANOVA with Fisher least significant difference test for (J). Scale bars: 50 μm.
Figure 2
Figure 2
Developing human pancreas contains TH+ β-cells. A: A violin plot of TH mRNA expression data in different endocrine cell populations generated from publicly accessible scRNA-seq data (27) hosted at the authors’ website (https://powersbrissovalab.shinyapps.io/scRNAseq-Islets/#). B: Immunostaining for TH (red), insulin (Ins) (green), and DAPI (blue) in adult human pancreas (n = 3), showing islets of different sizes. A minimum of 30 images covering the entire pancreas section were acquired. C: Immunofluorescence images from three neonatal human pancreata showing TH (red), Ins (green), and DAPI (blue). Arrows indicate TH+ β-cells. D: Quantification of TH+ β-cells in neonatal and adult human pancreatic tissue (n = 3); 2,000 β-cells per sample were counted. E: A Uniform Manifold Approximation and Projection (UMAP) plot showing the distribution of TH expression in early and late human stem cell–derived β-cells (sc-β) and adult β-cells. Plot generated from a publicly accessible data set (30) hosted at (https://singlecell.broadinstitute.org/). F: Bar graph output of a β-Cell Hub (28,29) query showing normalized transcripts counts for TH in islet-derived or human stem cell–derived β-like cells, without or with ROCK inhibitor treatment (islet-β, β-like, and β-like plus ROCK-Inh, respectively). The β-Cell Hub is hosted at https://hiview.case.edu/public/BetaCellHub/versusisletResult.php. Error bars show SEM. *P < 0.05 by two-tailed Student t test (D). Scale bars: 50 μm. Inh, inhibitor; UMI, unique molecular identifier.
Figure 3
Figure 3
TH+ β-cells display distinct molecular and metabolic characteristics. A: Analysis of scRNA-seq of mouse pancreatic islets from adult C57BL/6J mice fed regular chow. A Uniform Manifold Approximation and Projection (UMAP) plot is shown with individual cell types marked with specific colors. B: Distribution of Th expression within β-cell subtypes. The four major β-cell clusters (0–3) are marked by open circles. C: Volcano plot showing DEGs between Th+ and Th cells in all β-cell clusters. D: Gene-set enrichment analysis of the differentially expressed genes showing top enriched pathways for Th+ vs. Th cells in β-cell clusters. The up- and downregulated pathways are noted in top (light green) and bottom (light red) boxes. Enrichment was calculated for Gene Ontology Biological Process terms. E: NADH lifetime signatures for individual islets from each animal plotted for TH+ (red) vs. TH (blue) β-cells. Different symbols indicate data points from each animal. F: Lifetime modes for single islets were transformed onto phasor plots and averaged for each individual pancreas. Modes of phasor plot for TH+ (red) vs. TH (blue) for each individual animal (n = 8 islets/mouse, n = 4 mice) were plotted onto a G vs. S graph (arbitrary units). G: Representative immunofluorescence images for TH (red), Erol1b (green), and DAPI (blue) in pancreata from 2-month-old C57BL/6J mice (n = 5 mice, n = 25 images acquired per mouse sample). Arrows mark TH+ cells. A–D: Meta-analysis of pooled scRNA-seq data from three independent islet preparations from 9-week-old C57BL/6J mice fed a regular diet. Error bars show SEM. ****P < 0.001 by paired t test (E). Scale bar: 50 μm. NES, normalized enrichment score; p.adjust, adjusted P value.
Figure 4
Figure 4
The TH+ β-cells can replicate in postnatal life and are not senescent. We analyzed and quantified markers of replication (namely Ki67, pHH3) and senescence (namely, presence of p21, γH2AX, p16, and absence of LaminB1) in TH+ and TH β-cells. A: Quantification of TH+ β-cells shown as percentage of total β-cells at indicated stages in postnatal life (n = 5 mice/group; n = 700 β-cells/pancreas for P2–14; n = 1,500 β-cells per pancreas for P21 to 1 month; and n = 2,000 β-cells per pancreas for 2.5 months to 1 year). P values shown are compared with P2. B and C: Immunostaining (B) and quantification of specimens from 11 pups at P5 (C) for Ki67 (green), TH (red), insulin (Ins) (cyan), with DAPI (blue) in total, TH+, and TH β-cells. Insets in B show a ×2 view of the areas marked by white boxes. β-Cells (n = 700/slide), two slides spanning 100 μm for each pancreas, n = 11 pups. D and E: Immunofluorescence labeling (D) and quantification from five pups at P5 (E) for phospho-histone H3 (pHH3; red) with Ins (gray), TH (green), DAPI (blue) in total, TH+, and TH β-cells. β-Cells (n = 700/slide), two slides spanning 100 μm for each pancreas, n = 5 pups. F and G: Immunostaining (F) and quantification (n = 6 mice, 2 months old) (G) for p21 (red) and TH (green), with DAPI (blue) in TH+, and TH β-cells. H and I: Immunofluorescence (H) and quantification (n = 6 mice, 2 months old) (I) for γH2AX (red) and TH (green), with DAPI (blue) in TH+, and TH β-cells. J and K: Immunostaining (J) and quantification (n = 5 mice, 2 months old) (K) for p16 (red) and TH (green), with DAPI (blue) in TH+, and TH β-cells. L and M: Immunofluorescence (L) and quantification (n = 5 mice, 2 months old) (M) for LaminB1 (LmnB1; red) and TH (green), with DAPI (blue) in TH+, and TH β-cells. LmnB1 marks nuclear membrane in nonsenescent cells and should be absent from senescent cells. Inset in L shows a ×2 view of the areas marked by white boxes. All data are from wild-type C57BL/6J mice. Panels show representative confocal images (from at least 25 islet fields acquired) or mean data from indicated sample sizes with at least five mice per group at indicated ages. G and I: β-Cells (n = 2,000/slide were counted, two slides spanning 100 μm for each pancreas, n = 6 mice. L and M: A similar number of cells and slides were counted in five pups. Error bars show SEM. *P < 0.05, **P < 0.01, ***P < 0.005 by one-way ANOVA with Bonferroni post hoc test (A, C, and E) and paired t test (G, I, K, and M). Scale bars: 50 μm.
Figure 5
Figure 5
Th promoter undergoes Dnmt3a-dependent methylation during endocrine progenitor to β-cell differentiation. A: Bisulfite sequencing analysis of the Th promoter −2K region in purified mouse embryonic pancreatic progenitors, endocrine progenitors, and β-cells. Each line with dots is an independent clone; filled and open circles denote methylated and unmethylated CpGs, respectively. BD: Representative immunostaining for Dnmt3a (red), with Pdx1 (green) at E11.5 (B), Ngn3-GFP (green) at E13.5 (C), and insulin (Ins) (green) at E17.5 (D), with DAPI in blue (C and D). E: ChIP analysis for Dnmt3a binding to the −2K region of the Th promoter or a negative control region in sorted pancreatic progenitors, endocrine progenitors, and β-cells, showing the percentage of bound DNA (over input) in Dnmt3a or control IgG immunoprecipitation. A: Representative data from one of three samples. E: Mean of three independent samples per group, each sample being a biological replicate pool of cells derived from multiple embryos, with error bars showing SEM. ***P < 0.005 by one-way ANOVA followed by a Bonferroni post hoc test. Scale bars: 50 μm.
Figure 6
Figure 6
Dnmt3a ablation in progenitors, but not β-cells, leads to Th promoter demethylation and dysregulation in β-cells. AF: Representative images (chosen from at least 25 images per mouse pancreas, n = 5 mice) (AC) and quantification of TH expression (DF) in pancreatic sections from 2.5-month-old mice with Dnmt3a ablation at various stages of pancreas development and littermate controls. TH (red), insulin (Ins) (cyan), and DAPI (blue). Insets show a ×2 magnified view of areas marked by white boxes. β-Cells (n = 2,500/slide) were counted, two slides spanning 100 μm for each pancreas, n = 8 pancreas (mice). GI: Bisulfite sequencing analysis of the Th promoter −2K region in islets from adult (2.5 months old) 3aPancKO, 3aEndoKO, and 3aBetaKO mice and corresponding littermate controls. Each horizontal line with dots represents an independent clone; 25 clones are shown here, with filled circles representing a methylated CpG and open circles denoting an unmethylated CpG residue. AC: Examples from five independent samples. DF: Mean data from eight mice per group, with error bars representing SEM. ****P < 0.001, determined by two-tailed Student t test. G, H, and I: Representative data for one of the five independent islet preparations from individual KO and control mice. Scale bars: 50 μm.
Figure 7
Figure 7
Dnmt3a-dependent restriction of Th expression occurs prior to β-cell maturation and needs to be maintained for its continued restriction. AH: Immunofluorescence analysis (AD) and quantification (EH) of TH expression in pancreata from mice with Dnmt3a or Dnmt1 ablation in different lineages, along with littermate controls at indicated ages. TH (red), insulin (Ins) (green), and DAPI (blue). β-Cells (n = 500) counted per slide for P0, 700 β-cells counted per slide for P5, two slides spanning 80 μm for each pancreas; n = 8 pups in E and n = 5 pups for FH. I and J: Immunostaining (I) and quantification (J) of TH in pancreata from 1-month-old mice with β-cell–specific Dnmt1 ablation (1RCBetaKO), and littermate controls. TH (red), Ins (green), and DAPI (blue). K: Bisulfite sequencing of the −2K region of Th locus in β-cells sorted from 1-month-old 1RCBetaKO and control mice. Each horizontal line with dots represents an independent clone, with 25 clones shown here. Filled circles represent a methylated CpG; open circles indicate an unmethylated CpG residue. AJ: Representative images (from at least 20 images acquired per sample) or mean data from eight samples for 3aPancKO and controls, and five for the other groups. K: Representative data for one of the three independent β-cell preparations from individual KO and control mice. Error bars show SEM. ****P < 0.001, determined by two-tailed Student t test. Scale bars: 50 μm.
Figure 8
Figure 8
Chronic HFD leads to promoter demethylation–dependent dysregulation of Th expression in β-cells. AC: Immunofluorescence for TH (red) and Ins (green), with DAPI in blue (A), β-cell mass (B), and quantification of TH+ β-cells (C) in wild-type, 7-week-old mice fed a HFD or control diet for a short term (HFD-S or CD-S, respectively). DF: Immunostaining for TH (red) insulin (green), and DAPI (blue) (D), β-cell mass (E), and quantification of TH+ β-cells (F), in wild-type, 7-week-old mice fed an HFD or control diet for a long term (HFD-L or CD-L, respectively). Representative images shown are from at least 30 images acquired per pancreas sample. For quantification, 2,500 β-cells per slide were counted, two slides spanning 100 μm for each pancreas, n = 5 pancreas (mice). G: Bisulfite sequencing analysis of the Th promoter −2K region in islets from mice fed an HFD or CD for 8 weeks (HFD-S, CD-S) or 16 weeks (HFD-L, CD-L). Each horizontal line with dots represents an independent clone; 25 clones are shown for each sample, with filled circles indicating methylated CpG and open circles indicating unmethylated CpG. Immunofluorescence data show representative images from five samples. The data on β-cell mass and TH+ β-cell quantification are a mean of five independent samples per group, whereas the bisulfite-sequencing data are from representative clones from one of the three independent samples per group. Error bars show SEM of the mean. **P < 0.01, ***P < 0.005 determined by two-tailed Student t test. Scale bars: 50 μm.

Comment in

References

    1. Benninger RKP, Kravets V. The physiological role of β-cell heterogeneity in pancreatic islet function. Nat Rev Endocrinol 2022;18:9–22 - PMC - PubMed
    1. Gutierrez GD, Gromada J, Sussel L. Heterogeneity of the pancreatic beta cell. Front Genet 2017;8:22. - PMC - PubMed
    1. Avrahami D, Kaestner KH. Epigenetic regulation of pancreas development and function. Semin Cell Dev Biol 2012;23:693–700 - PMC - PubMed
    1. Parveen N, Dhawan S. DNA methylation patterning and the regulation of beta cell homeostasis. Front Endocrinol (Lausanne) 2021;12:651258. - PMC - PubMed
    1. Georgia S, Kanji M, Bhushan A. DNMT1 represses p53 to maintain progenitor cell survival during pancreatic organogenesis. Genes Dev 2013;27:372–377 - PMC - PubMed

Publication types

Substances