. 2023 Mar 2;83(5):700-719.
doi: 10.1158/0008-5472.CAN-22-2224.

Integrative Single-Cell Analysis Reveals Transcriptional and Epigenetic Regulatory Features of Clear Cell Renal Cell Carcinoma

Affiliations

Integrative Single-Cell Analysis Reveals Transcriptional and Epigenetic Regulatory Features of Clear Cell Renal Cell Carcinoma

Zhenyuan Yu et al. Cancer Res. .

Abstract

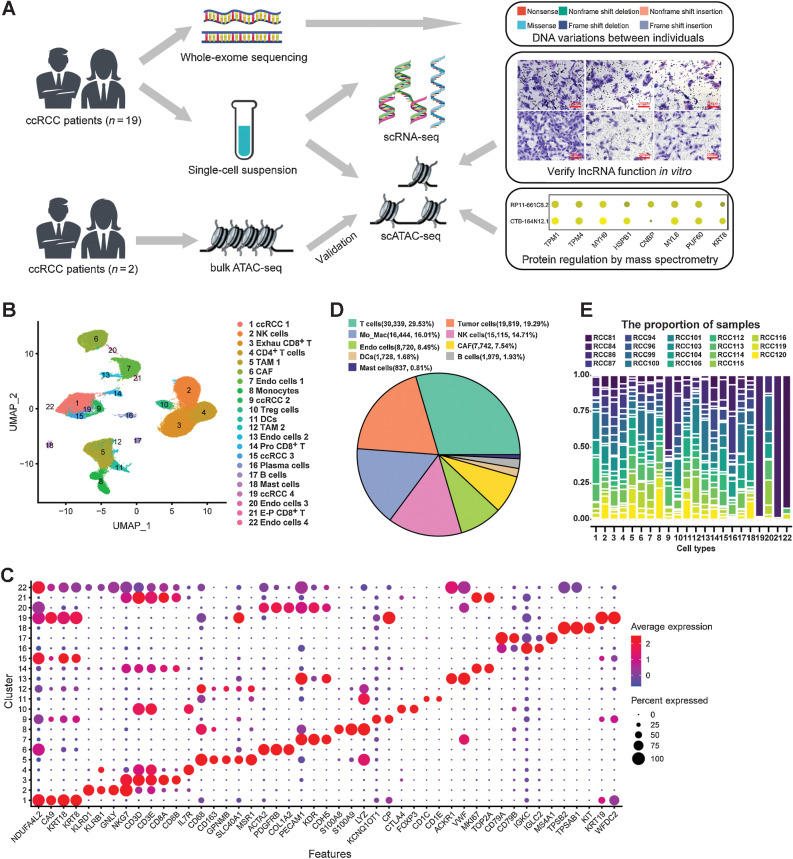
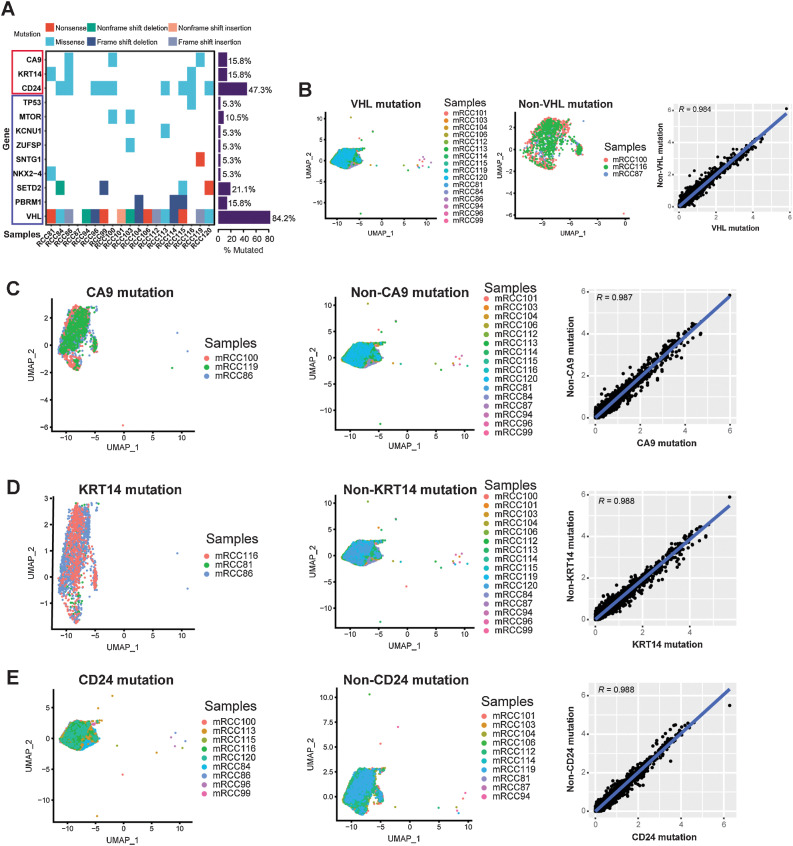
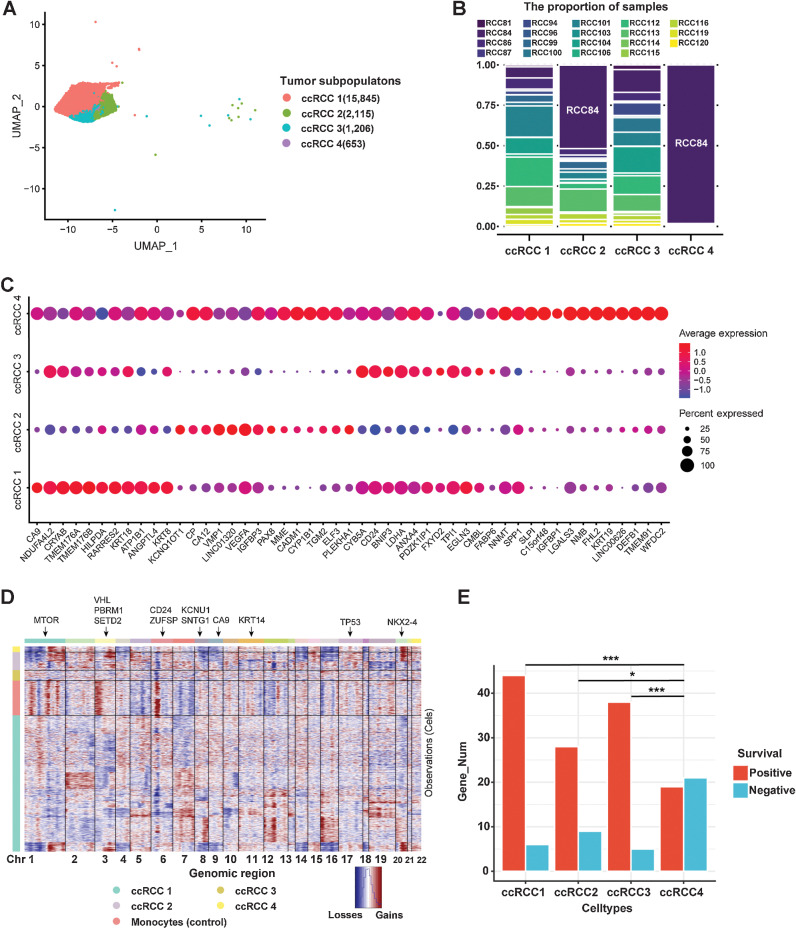
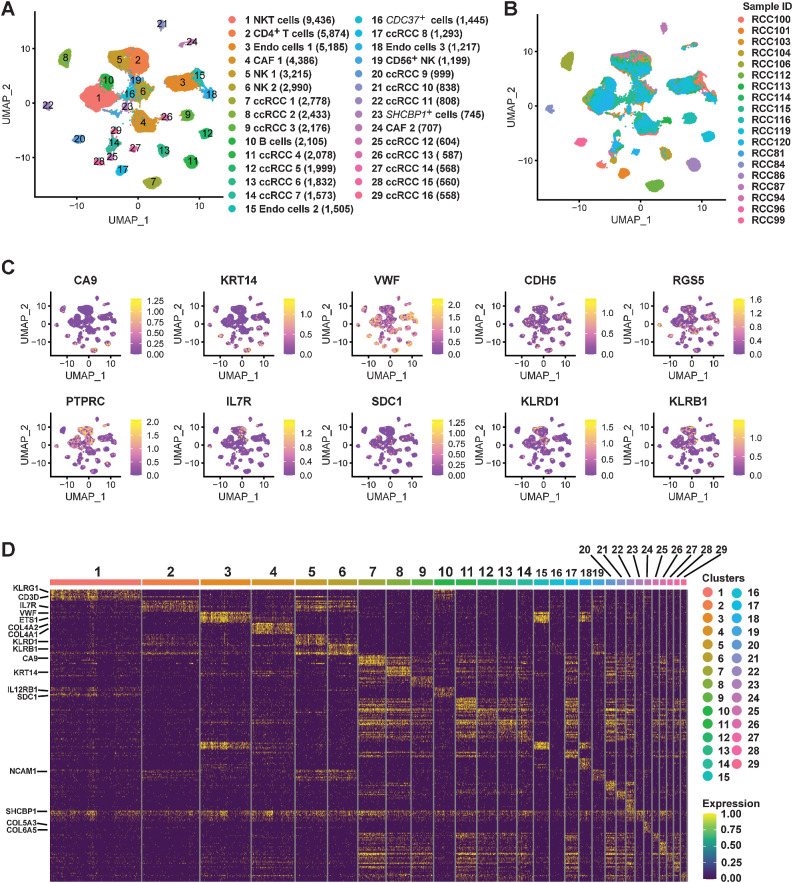
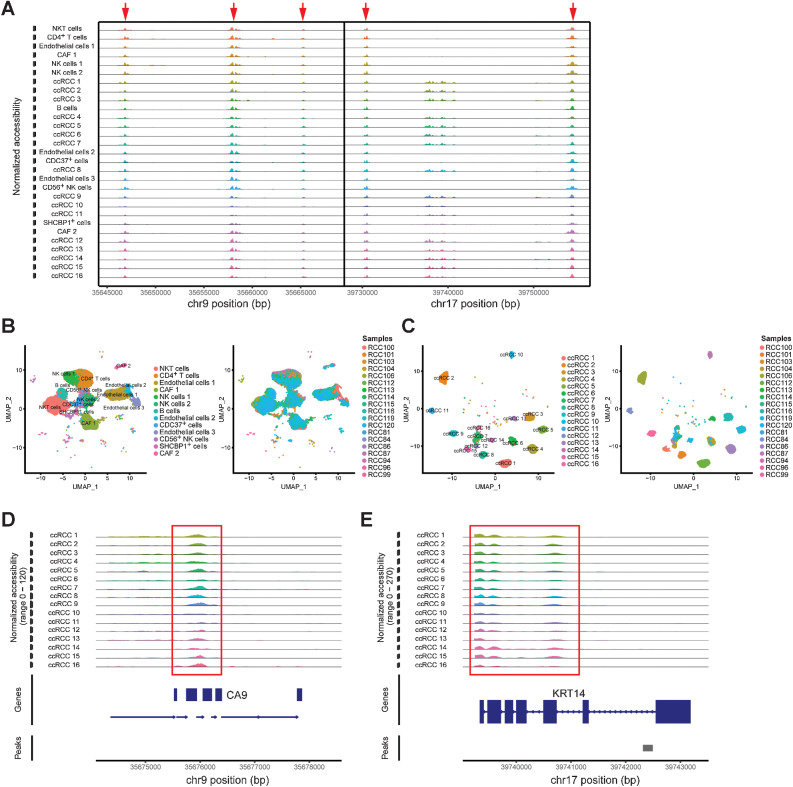
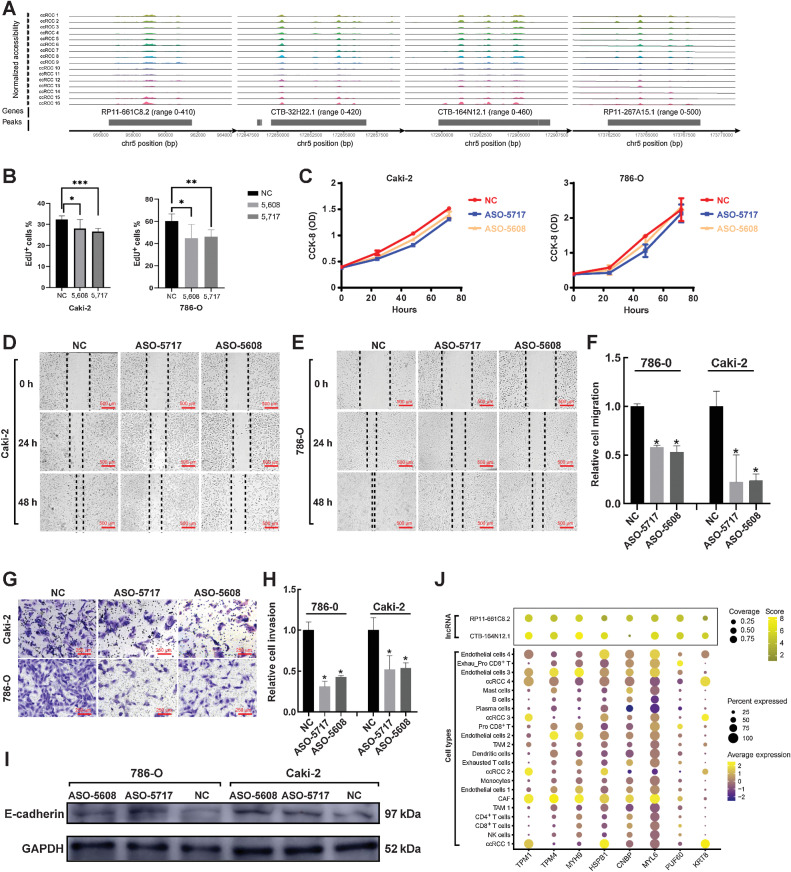
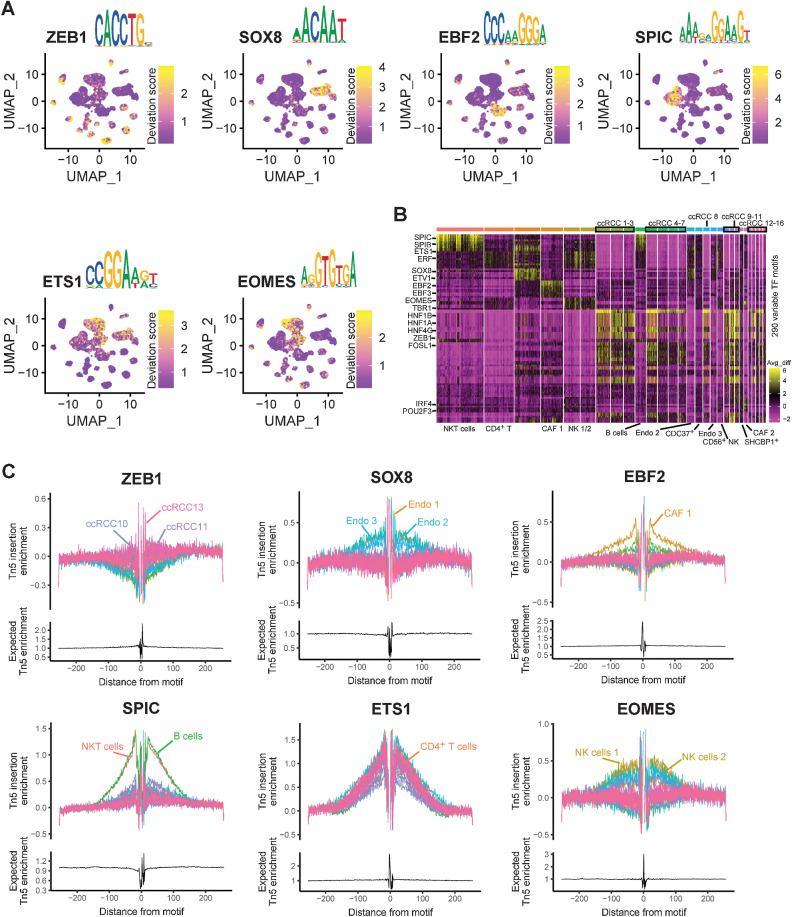
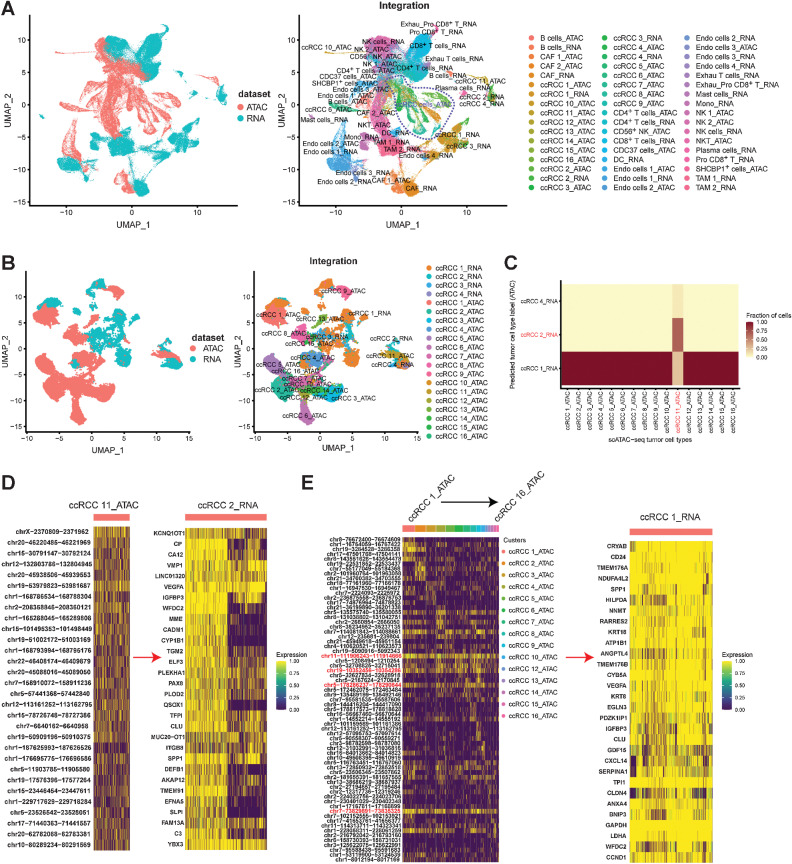
Clear cell renal cell carcinoma (ccRCC) frequently features a high level of tumor heterogeneity. Elucidating the chromatin landscape of ccRCC at the single-cell level could provide a deeper understanding of the functional states and regulatory dynamics underlying the disease. Here, we performed single-cell RNA sequencing (scRNA-seq) and single-cell assay for transposase-accessible chromatin using sequencing (scATAC-seq) on 19 ccRCC samples, and whole-exome sequencing was used to understand the heterogeneity between individuals. Single-cell transcriptome and chromatin accessibility maps of ccRCC were constructed to reveal the regulatory characteristics of different tumor cell subtypes in ccRCC. Two long noncoding RNAs (RP11-661C8.2 and CTB-164N12.1) were identified that promoted the invasion and migration of ccRCC, which was validated with in vitro experiments. Taken together, this study comprehensively characterized the gene expression and DNA regulation landscape of ccRCC, which could provide new insights into the biology and treatment of ccRCC.

Significance: A comprehensive analysis of gene expression and DNA regulation in ccRCC using scATAC-seq and scRNA-seq reveals the DNA regulatory programs of ccRCC at the single-cell level.


Figures

Figure 1. Overview of single-cell transcriptomic atlas of ccRCC sample. A, Schematic of the experimental design for this study. The same images from Fig. 6G and J were used for the right panel in A. B, UMAP plot representation of ccRCC with 22 distinct cell types. The exhausted (Exhau) CD8+ T cells, TAMs, CAFs, DCs, proliferative (Pro) CD8+ T cells, and exhausted-proliferative (E-P) CD8+ T cells. C, Bubble chart showing the marker genes of each cluster. Dot size represents the proportion of cells, and the color represents gene expression with high or low. D, Pie graph showing the fraction of main cell types. E, Proportion of 19 ccRCC samples in each cell type.
Figure 1.
Overview of single-cell transcriptomic atlas of ccRCC sample. A, Schematic of the experimental design for this study. The same images from Fig. 6G and J were used for the right panel in A. B, UMAP plot representation of ccRCC with 22 distinct cell types. The exhausted (Exhau) CD8+ T cells, TAMs, CAFs, DCs, proliferative (Pro) CD8+ T cells, and exhausted-proliferative (E-P) CD8+ T cells. C, Bubble chart showing the marker genes of each cluster. Dot size represents the proportion of cells, and the color represents gene expression with high or low. D, Pie graph showing the fraction of main cell types. E, Proportion of 19 ccRCC samples in each cell type.
Figure 2. scRNA-seq revealed the relationship between gene mutation and gene expression in ccRCC. A, WES for ccRCC samples. Each row represents a gene, and the frequency of mutations is indicated on the right side of the bars. Cluster of tumor cells in VHL (B), CA9 (C), KRT14 (D), and CD24 (E) mutated samples are shown in the left. Cluster of tumor cells in VHL (B), CA9 (C), KRT14 (D), and CD24 (E) nonmutated samples are shown in the middle. Scatterplot showing the log1p of the average expression per gene of VHL (B), CA9 (C), KRT14 (D), and CD24 (E) mutated/nonmutated samples in the right.
Figure 2.
scRNA-seq revealed the relationship between gene mutation and gene expression in ccRCC. A, WES for ccRCC samples. Each row represents a gene, and the frequency of mutations is indicated on the right side of the bars. B–E, Left, cluster of tumor cells in VHL (B), CA9 (C), KRT14 (D), and CD24 (E) mutated samples are shown. Middle, cluster of tumor cells in VHL (B), CA9 (C), KRT14 (D), and CD24 (E) nonmutated samples are shown. Right, scatterplot showing the log1p of the average expression per gene of VHL (B), CA9 (C), KRT14 (D), and CD24 (E) mutated/nonmutated samples.
Figure 3. Heterogeneity of tumor cells in human ccRCC. A, UMAP plot of four subtypes of ccRCC tumor cells (ccRCC1, ccRCC2, ccRCC3, and ccRCC4). B, Proportion of samples in each tumor cell type. C, Bubble chart showing DEGs in each tumor cluster (color represents the expression level, and dot sizes represent the relative abundance). D, CNV landscape of tumor cells (monocytes were used as the reference cells; the red color represents gains of copy number, whereas the blue color represents losses of copy number). The annotated gene represents its chromosomal location (arrows). E, The number of genes associated with prognosis is found by integrating differentially expressed genes from tumor cells into TCGA database on ccRCC (*, P < 0.05; **, P < 0.01; ***, P < 0.001).
Figure 3.
Heterogeneity of tumor cells in human ccRCC. A, UMAP plot of four subtypes of ccRCC tumor cells (ccRCC1, ccRCC2, ccRCC3, and ccRCC4). B, Proportion of samples in each tumor cell type. C, Bubble chart showing DEGs in each tumor cluster (color represents the expression level, and dot sizes represent the relative abundance). D, CNV landscape of tumor cells. Monocytes were used as the reference cells. Red, gains of copy number; blue, losses of copy number. The annotated gene represents its chromosomal location (arrows). E, The number of genes associated with prognosis is found by integrating differentially expressed genes from tumor cells into TCGA database on ccRCC. *, P < 0.05; ***, P < 0.001.
Figure 4. Single-cell chromatin accessibility landscape in ccRCC. A, UMAP plot shows the cell landscape of ccRCC identified by scATAC-seq. B, Proportion of 19 ccRCC samples in each cell type. C, UMAP plots shows the gene activity scores of marker genes identified from each cell cluster. The color represents the grade. D, Heatmap represents the top 10 peaks for each cell cluster identified by scATAC-seq.
Figure 4.
Single-cell chromatin accessibility landscape in ccRCC. A, UMAP plot shows the cell landscape of ccRCC identified by scATAC-seq. B, Proportion of 19 ccRCC samples in each cell type. C, UMAP plots shows the gene activity scores of marker genes identified from each cell cluster. The color represents the grade. D, Heatmap represents the top 10 peaks for each cell cluster identified by scATAC-seq.
Figure 5. Single-cell chromatin accessibility characteristics in ccRCC. A, Chromatin accessibility profiles of each cluster in chr 9 and chr 17. B, UMAP of non-tumor cells identifies cell clusters (left) and sample origin (right). C, UMAP of tumor cells identifies cell clusters (left) and sample origin (right). D and E, Specific chromatin accessibility region of tumor cells identified by scATAC-seq.
Figure 5.
Single-cell chromatin accessibility characteristics in ccRCC. A, Chromatin accessibility profiles of each cluster in chr 9 and chr 17. B, UMAP of nontumor cells identifies cell clusters (left) and sample origin (right). C, UMAP of tumor cells identifies cell clusters (left) and sample origin (right). D and E, Specific chromatin accessibility region of tumor cells identified by scATAC-seq.
Figure 6. Discovery and validation of specific lncRNAs in ccRCC tumor cells. A, Specific lncRNAs in ccRCC tumor cells were identified by scATAC-seq. B, ASO-5717 hit the CTB-164N12.1 specifically, while ASO-5608 hit the RP11-661C8.2. Cell proliferation was assessed by immunofluorescence using the EdU incorporation assay (*, P < 0.05; **, P < 0.01; ***, P < 0.001). C, Absorbance of 786-O and Caki-2 cell lines was measured at 450 nm after ASO treatment. D and E, Wound-healing assay reflected the migration of ccRCC after ASO treatment (scale bar: 500 μm). F, Results of wound-healing assay were statistically analyzed (*, P < 0.05). G, Transwell assay reflected the invasion of ccRCC after ASO treatment (scale bar: 250 μm). H, Results of transwell assay were statistically analyzed (*, P < 0.05). I, Western blotting analysis after ASO treatment in 786-O and Caki-2 cells. J, Integrating protein mass spectrometry (above panel) and scRNA-seq results (below panel), mapping the closely binding proteins found by protein mass spectrometry to gene expression in cell types identified by scRNA-seq.
Figure 6.
Discovery and validation of specific lncRNAs in ccRCC tumor cells. A, Specific lncRNAs in ccRCC tumor cells were identified by scATAC-seq. B, ASO-5717 hit the CTB-164N12.1 specifically, while ASO-5608 hit the RP11-661C8.2. Cell proliferation was assessed by immunofluorescence using the EdU incorporation assay. C, Absorbance of 786-O and Caki-2 cell lines was measured at 450 nm after ASO treatment. D and E, Wound-healing assay reflected the migration of ccRCC after ASO treatment. Scale bar, 500 μm. F, Results of wound-healing assay were statistically analyzed. G, Transwell assay reflected the invasion of ccRCC after ASO treatment. Scale bar, 250 μm. H, Results of transwell assay were statistically analyzed. I, Western blotting analysis after ASO treatment in 786-O and Caki-2 cells. J, Integrating protein mass spectrometry (top) and scRNA-seq results (bottom), mapping the closely binding proteins found by protein mass spectrometry to gene expression in cell types identified by scRNA-seq. *, P < 0.05; **, P < 0.01; ***, P < 0.001.
Figure 7. Characteristics of TFs in ccRCC were identified by scATAC-seq. A, UMAP plot highlighting TF motif scores for ZEB1, SOX8, EBF2, SPIC, ETS1, and EOMES. B, Heatmap represents the 290 variable TF motifs from each cluster by scATAC-seq. C, TF footprints of ZEB1, SOX8, EBF2, SPIC, ETS1, and EOMES with motifs in each cluster by scATAC-seq. The Tn5 insertion bias track is shown below.
Figure 7.
Characteristics of TFs in ccRCC were identified by scATAC-seq. A, UMAP plot highlighting TF motif scores for ZEB1, SOX8, EBF2, SPIC, ETS1, and EOMES. B, Heatmap represents the 290 variable TF motifs from each cluster by scATAC-seq. C, TF footprints of ZEB1, SOX8, EBF2, SPIC, ETS1, and EOMES, with motifs in each cluster by scATAC-seq. The Tn5 insertion bias track is shown below.
Figure 8. Integrating scRNA-seq and scATAC-seq analysis. A, Integrating all cell types from scRNA-seq and scATAC-seq by UMAP plot. B, Integrating tumor cell types from scRNA-seq and scATAC-seq by UMAP plot. C, Heatmap showing the proportions of tumor cells from each scATAC-seq cluster (x axis) that were annotated with cluster labels transferred from scRNA-seq clusters (y axis). D, ccRCC 11 (scATAC-seq cluster) specific chromatin accessibility regulated the gene expression characteristics of ccRCC 2 (scRNA-seq cluster). E, ccRCC 1–10, 12–16 (scATAC-seq cluster) specific chromatin accessibility regulated the gene expression characteristics of ccRCC 1 (scRNA-seq cluster).
Figure 8.
Integrating scRNA-seq and scATAC-seq analysis. A, Integrating all cell types from scRNA-seq and scATAC-seq by UMAP plot. B, Integrating tumor cell types from scRNA-seq and scATAC-seq by UMAP plot. C, Heatmap showing the proportions of tumor cells from each scATAC-seq cluster (x-axis) that were annotated with cluster labels transferred from scRNA-seq clusters (y-axis). D, ccRCC 11 (scATAC-seq cluster)–specific chromatin accessibility regulated the gene expression characteristics of ccRCC 2 (scRNA-seq cluster). E, ccRCC 1–10, 12–16 (scATAC-seq cluster)–specific chromatin accessibility regulated the gene expression characteristics of ccRCC 1 (scRNA-seq cluster).

References

    1. Sung H, Ferlay J, Siegel RL, Laversanne M, Soerjomataram I, Jemal A, et al. . Global cancer statistics 2020: GLOBOCAN estimates of incidence and mortality worldwide for 36 cancers in 185 countries. CA Cancer J Clin 2021;71:209–49. - PubMed
    1. Capitanio U, Bensalah K, Bex A, Boorjian SA, Bray F, Coleman J, et al. . Epidemiology of renal cell carcinoma. Eur Urol 2019;75:74–84. - PMC - PubMed
    1. Xu W, Atkins MB, McDermott DF. Checkpoint inhibitor immunotherapy in kidney cancer. Nat Rev Urol 2020;17:137–50. - PubMed
    1. Motzer RJ, Hutson TE, Tomczak P, Michaelson MD, Bukowski RM, Rixe O, et al. . Sunitinib versus interferon alfa in metastatic renal-cell carcinoma. N Engl J Med 2007;356:115–24. - PubMed
    1. Wan X, Zhang Y, Tan C, Zeng X, Peng L. First-line nivolumab plus ipilimumab vs sunitinib for metastatic renal cell carcinoma: a cost-effectiveness analysis. JAMA Oncol 2019;5:491–6. - PMC - PubMed

Publication types