. 2023 Jan 6;9(1):eadd8856.
doi: 10.1126/sciadv.add8856. Epub 2023 Jan 6.

Neurexin-2: An inhibitory neurexin that restricts excitatory synapse formation in the hippocampus

Affiliations

Neurexin-2: An inhibitory neurexin that restricts excitatory synapse formation in the hippocampus

Pei-Yi Lin et al. Sci Adv. .

Expression of concern in

  • Editorial expression of concern.
    Thorp HH. Thorp HH. Sci Adv. 2025 Oct 3;11(40):eaec3110. doi: 10.1126/sciadv.aec3110. Epub 2025 Oct 1. Sci Adv. 2025. PMID: 41032620 Free PMC article. No abstract available.

Abstract

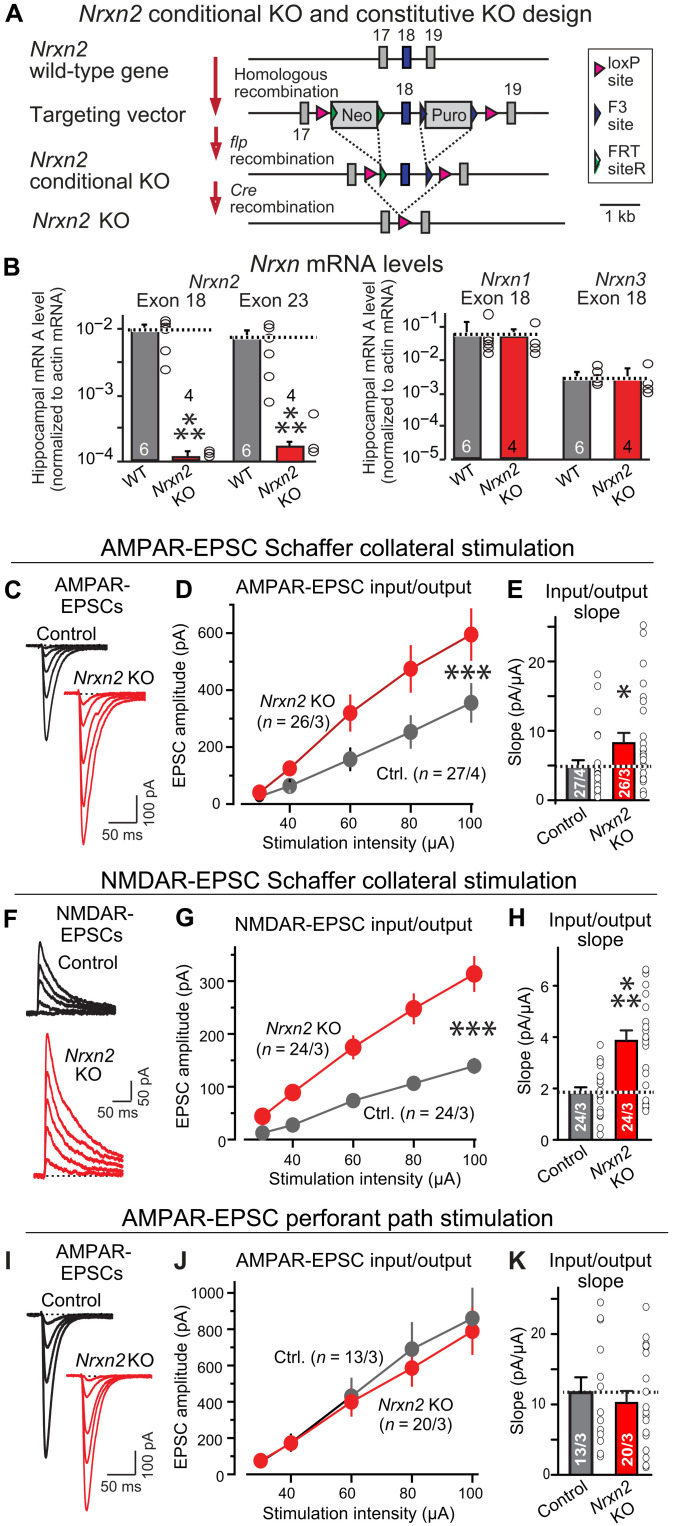
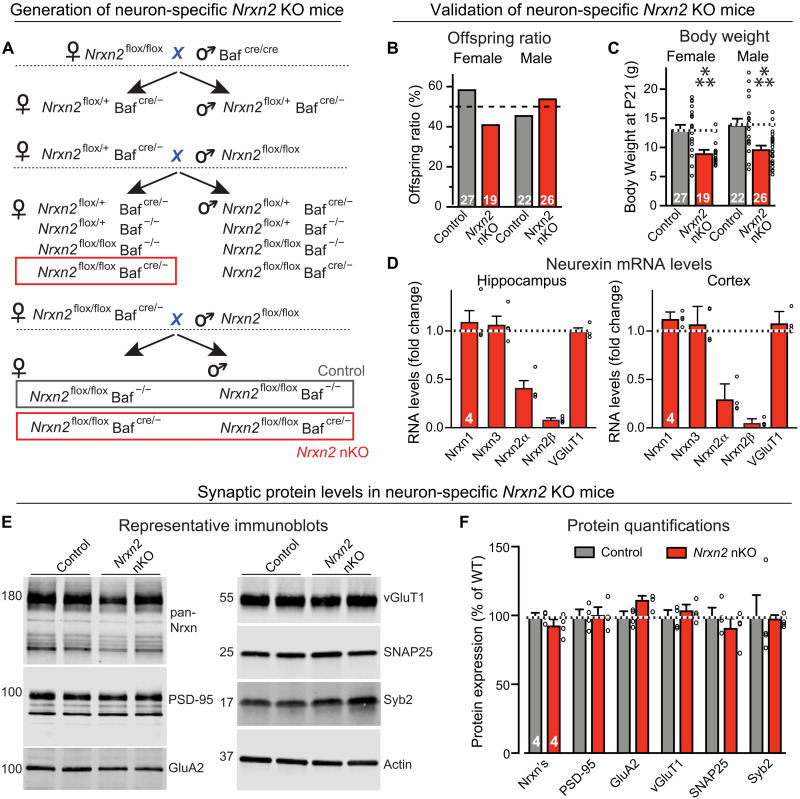
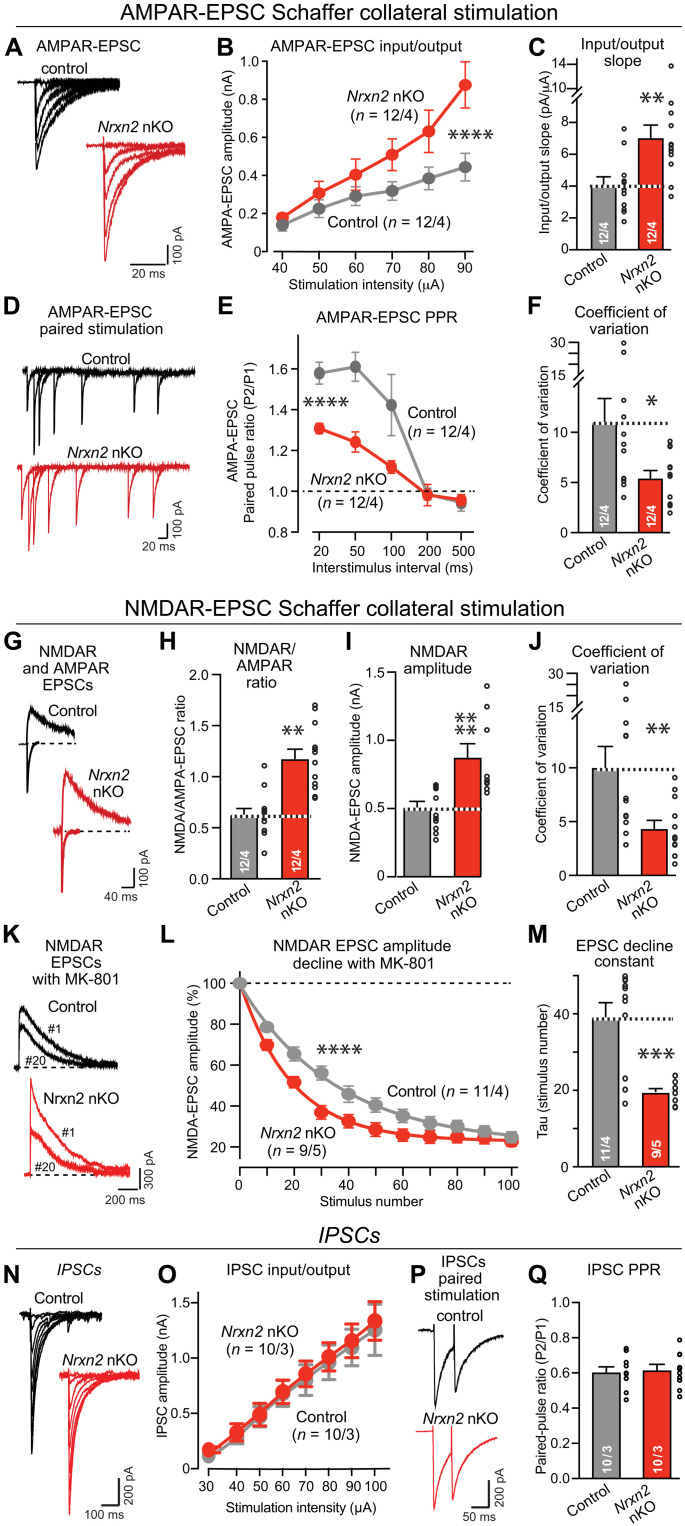
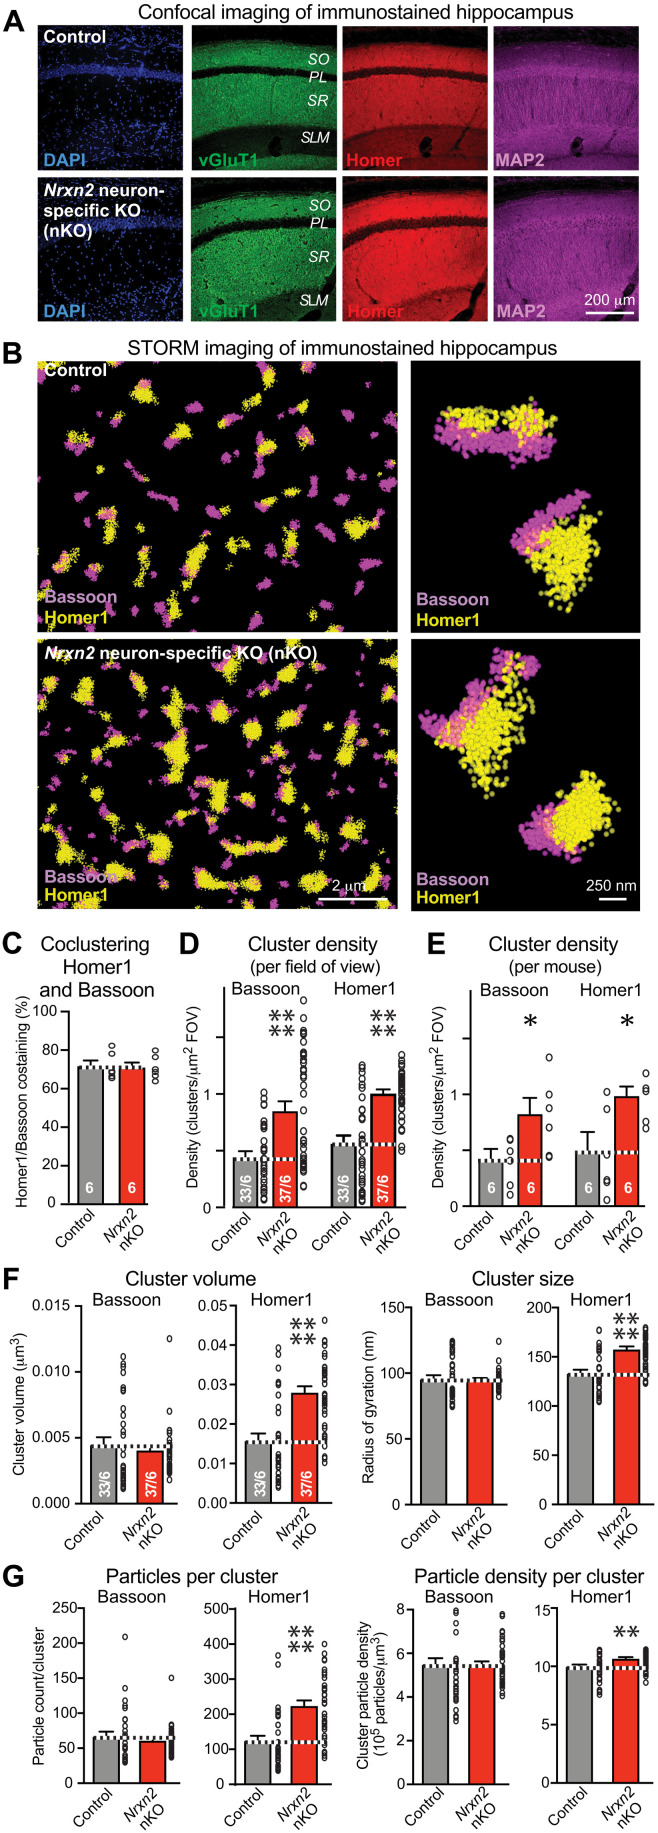
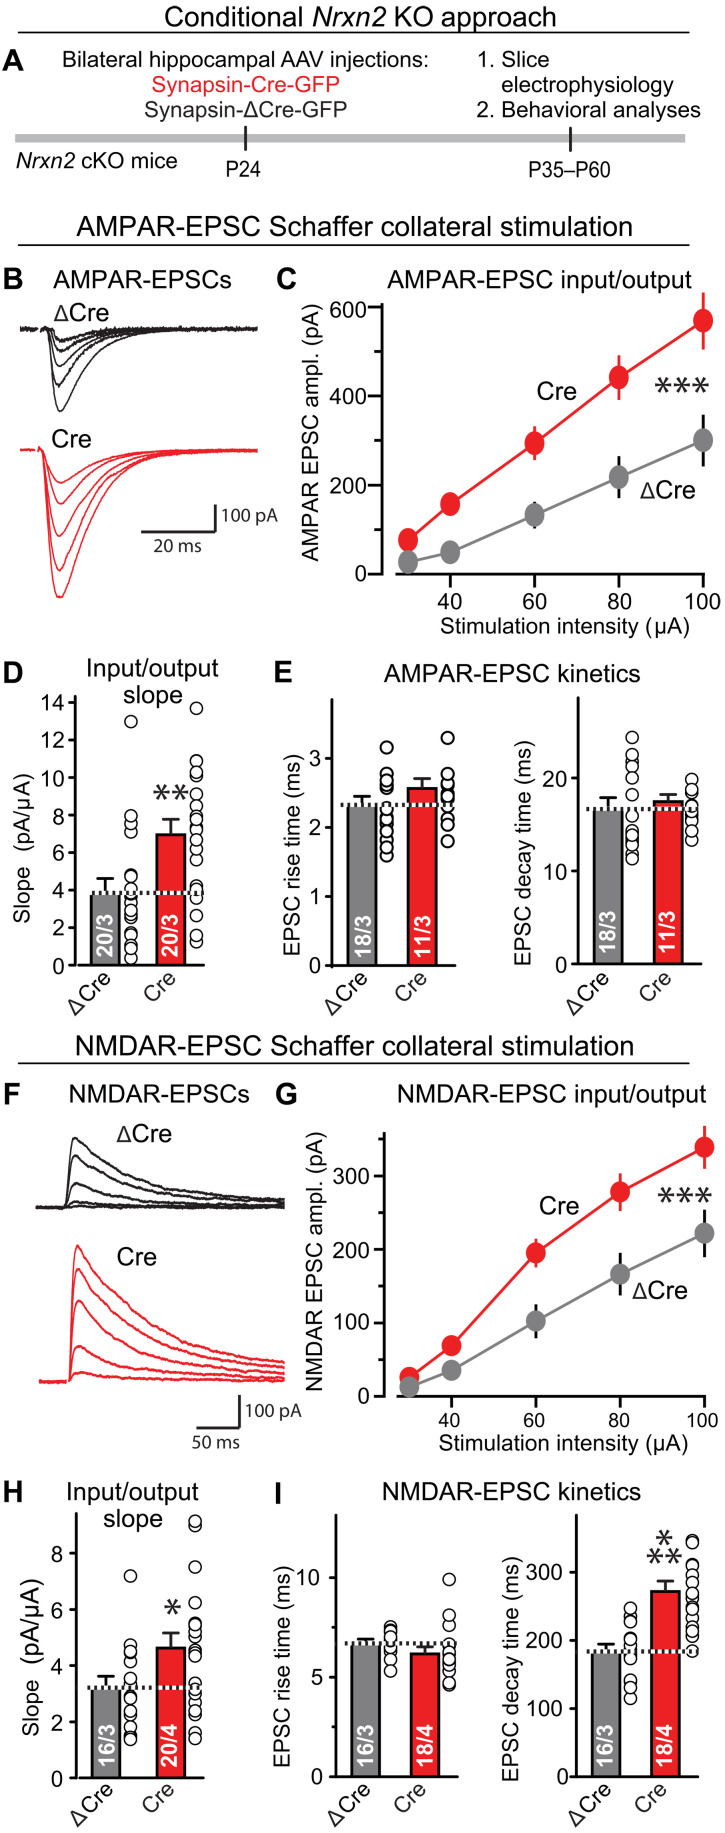
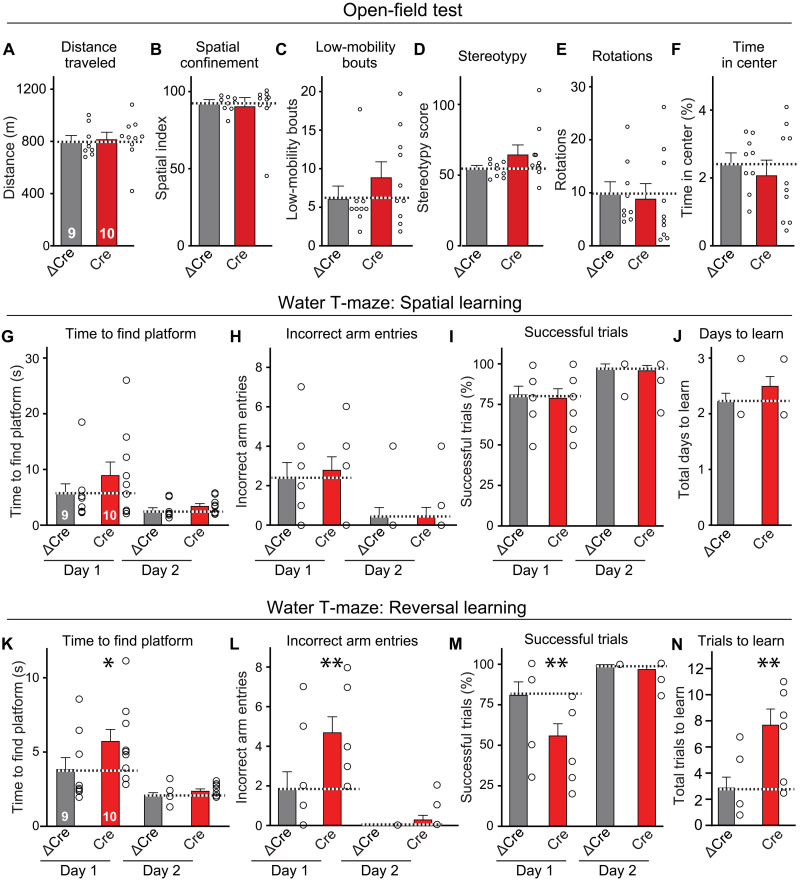
Neurexins are widely thought to promote synapse formation and to organize synapse properties. Here we found that in contrast to neurexin-1 and neurexin-3, neurexin-2 unexpectedly restricts synapse formation. In the hippocampus, constitutive or neuron-specific deletions of neurexin-2 nearly doubled the strength of excitatory CA3➔CA1 region synaptic connections and markedly increased their release probability. No effect on inhibitory synapses was detected. Stochastic optical reconstruction microscopy (STORM) superresolution microscopy revealed that the neuron-specific neurexin-2 deletion elevated the density of excitatory CA1 region synapses nearly twofold. Moreover, hippocampal neurexin-2 deletions also increased synaptic connectivity in the CA1 region when induced in mature mice and impaired the cognitive flexibility of spatial memory. Thus, neurexin-2 controls the dynamics of hippocampal synaptic circuits by repressing synapse assembly throughout life, a restrictive function that markedly differs from that of neurexin-1 and neurexin-3 and of other synaptic adhesion molecules, suggesting that neurexins evolutionarily diverged into opposing pro- and antisynaptogenic organizers.


Figures

Fig. 1.
Fig. 1.. Constitutive deletion of Nrxn2 increases CA3➔CA1 synaptic connections in the hippocampus.
(A) Nrxn2 cKO and constitutive KO strategy. Two selectable markers [puromycin (Puro) and neomycin (Neo)] were required to obtain embryonic stem cell clones with homologous recombination of the Nrxn2 gene. Exon 18, the first exon shared between Nrxn2α and Nrxn2β, was flanked by loxP sites, enabling Cre-mediated deletion of both Nrxn2α and Nrxn2β. (B) Nrxn2 cKO mice were bred with cytomegalovirus (CMV)–Cre mice to generate littermate wild-type (WT) and constitutive Nrxn2 KO mice. The constitutive Nrxn2 KO suppresses Nrxn2 mRNA levels but leaves Nrxn1 and Nrxn3 mRNA levels unchanged. The exon 18 Nrxn2 mRNA level measurements monitor the exon that is deleted, with the remaining 1% of mRNA detected likely because of background of quantitative reverse transcription polymerase chain reaction (RT-PCR) measurements. The decrease in the exon 23 mRNA levels is likely due to nonsense-mediated decay because the exon 18 deletion should not block Nrxn2 transcription, only the production of a functional protein. (C to E) Nrxn2 KO increases the AMPAR-mediated synaptic responses elicited by Schaffer collateral stimulation [(C) representative traces of AMPAR-EPSCs evoked by increasingly stronger stimuli and recorded at −70 mV in 50 μM picrotoxin and 50 μM D-D-AP-5 (2R)-amino-5-phosphonopentanoate) (2R)-amino-5-phosphonopentanoate); (D) input/output plot of the EPSC amplitude versus stimulus strength; (E) slope of the input/output relation]. (F to H) Nrxn2 KO increases NMDAR-mediated synaptic responses elicited by Schaffer collateral stimulation [same as (C) to (E) except that the responses were recorded at a holding potential of +40 mV in the presence of 20 μM 6-cyano-7-nitroquinoxaline-2,3-dione (CNQX)]. (I to K) Nrxn2 KO has no effect on AMPAR-mediated synaptic responses elicited by stimulation of entorhinal cortex–derived axons [same as (C) to (E)]. Data are means ± SEM; the numbers of neurons per mice analyzed are listed in bar graphs. Statistical assessments were performed by the Mann-Whitney test comparing KO to control (B, E, H, and K) or by two-way analysis of variance (ANOVA) tests (D, G, and J), with *P < 0.05, **P < 0.01, and ***P < 0.001. Ctrl., control.
Fig. 2.
Fig. 2.. The pan-neuronal deletion of Nrxn2 (Nrxn2 nKO) partly decreases Nrxn2 mRNAs but does not affect the levels of other mRNAs or protein levels.
(A) Breeding strategy for generating pan-neuronal Nrxn2 KO (Nrxn2 nKO) mice by crossing Nrxn2 cKO mice with Baf53b-Cre mice (47). (B) The Nrxn2 nKO does not impair mouse survival. The graph depicts the genotype distribution in surviving offspring from matings of homozygous Nrxn2 cKO (control) and Nrxn2 nKO mice, with an expected 50% offspring survival ratio for Nrxn2 cKO control and Nrxn2 nKO mice, assessed at postnatal day 21 (P21). (C) Body weight of the mice analyzed in (B). (D) Quantification of the indicated neurexin mRNA levels in the hippocampus and cortex of littermate Nrxn2 cKO control and Nrxn2 nKO mouse brains, expressed as the fraction of the mRNA levels in the nKO mice compared to controls. Note that the remaining Nrxn2α mRNA levels are higher than Nrxn2β mRNA levels because Nrxn2α but not Nrxn2β is also expressed in astrocytes and OPCs (oligodendrocyte precursor cells). (E and F) Immunoblotting analyses show that the neuron-specific Nrxn2 deletion (Nrxn2 nKO) does not significantly alter the levels of key synaptic proteins, including that of total neurexins [(E) representative blots; (F) summary graph of protein levels as determined by quantitative blotting using fluorescent secondary antibodies and Licor detection]. Data in (B) to (D) and (F) are means ± SEM; the numbers of analyzed mice or of cells per mice are shown in the bars. Statistical analyses were performed using the Mann-Whitney test comparing KO to WT, with ***P < 0.001.
Fig. 3.
Fig. 3.. The pan-neuronal deletion of Nrxn2 (Nrxn2 nKO) elevates CA3➔CA1 synaptic connectivity and increases the release probability at CA3➔CA1 synapses.
(A to C) Nrxn2 neuron-specific KO (nKO) increases AMPAR-mediated synaptic responses elicited by Schaffer collateral stimulation in acute slice from littermate control and Nrxn2 nKO mice [(A) representative traces of AMPAR-EPSCs evoked by electrical stimulation with increasing intensity; (B) input/output curve; (C) summary graph of the input/output slope]. (D to F) Nrxn2 nKO increases presynaptic release probability as demonstrated by a decreased paired-pulse ratio (PPR) and a lower coefficient of variation of AMPAR-EPSCs [(D) representative traces; (E) summary plot of PPRs; (F) summary graph of the coefficient of variation]. (G to J) Nrxn2 nKO enhances NMDAR/AMPAR ratio by increasing NMDAR-mediated synaptic responses more strongly than AMPAR-mediated responses [(G) representative traces of NMDAR-EPSCs and AMPAR-EPSCs monitored in the same cell at a +40- and −70-mV holding potential; (H to J) summary graphs of the NMDAR-EPSC/AMPAR-EPSC ratio (H), the absolute NMDAR-EPSC amplitude (I), and the coefficient of variation of NMDAR-EPSCs (J)]. (K to M) Nrxn2 nKO increases presynaptic release probability as measuring the rate of NMDAR-EPSC decline during 0.1-Hz stimulus trains in the presence of 20 μM MK-801 [(K) representative traces of the 1st and 20th NMDAR-EPSCs in the train; (L) normalized NMDAR-EPSC amplitudes in the presence of MK-801; (M) summary graph of the decay constant]. (N and O) The Nrxn2 nKO has no effect on inhibitory postsynaptic currents (IPSCs) [(N) representative traces of IPSCs evoked by electrical stimulation with increasing intensity; (O) input/output curve]. (P and Q) Nrxn2 nKO has no effect on PPR in inhibitory synapses monitored with a 50-ms interstimulus interval [(P) representative traces; (Q) summary graph of the PPR). Numerical data are means ± SEM; the numbers of analyzed cells per mice are listed in bar graphs. Statistical assessments were performed by two-way ANOVA (B, E, L, and O) or Mann-Whitney tests comparing the Nrxn2 nKO to controls, with *P < 0.05; **P < 0.01, ***P < 0.001, and ****P < 0.0001.
Fig. 4.
Fig. 4.. STORM superresolution microscopy reveals that the pan-neuronal Nrxn2 deletion (Nrxn2 nKO) increases the excitatory synapse density in the CA1 region.
(A) The pan-neuronal deletion of Nrxn2 does not alter the overall synaptic architecture of the hippocampal CA1 region. Representative images show low-magnification confocal views of cryosections that were labeled for 4′,6-diamidino-2-phenylindole (DAPI) (blue), vGluT1 (green), Homer1 (red), and MAP2 (magenta). (B) Representative dSTORM images of presynaptic Bassoon clusters (magenta) and postsynaptic Homer1 clusters (yellow) in S. radiatum of the CA1 region from control and Nrxn2 nKO mice. (C) Summary graph documenting that the majority of Bassoon and Homer1 clusters colocalize and that their colocalization is unaffected by the neuron-specific Nrxn2 deletion. (D and E) Summary graphs showing that the Nrxn2 nKO markedly increases the density of Bassoon and Homer1 clusters in the S. radiatum of the CA1 region, as analyzed by dSTORM quantifying the number of clusters either per field of view (FOV) (D) or per mouse (E). (F and G) Summary graphs demonstrating that the pan-neuronal deletion of Nrxn2 increases the volume [(F) left], size [(F) right], particle numbers [(G) left], and particle density [(G) right] of Homer1 clusters but has no detectable effect on these parameters in Bassoon clusters. Data in (C) to (F) are means ± SEM; the numbers of analyzed mice (C and E) or sections per mice (D and F) are listed in bar graphs. Statistical assessments were performed by Mann-Whitney tests comparing the nKO to controls, with *P < 0.05, **P < 0.01, and ****P < 0.0001.
Fig. 5.
Fig. 5.. Conditional deletion of Nrxn2 from the hippocampus of adolescent mice enhances the strength of CA3➔CA1 synaptic connections.
(A) Experimental approach. The hippocampal formation of Nrxn2 cKO mice was stereotactically infected at P24 with AAVs expressing inactive (ΔCre, control) or active Cre recombinase (Cre), and mice were analyzed by electrophysiologically and behaviorally 2 to 5 weeks later. (B to E) Conditional Nrxn2 deletion at P24 increases AMPAR-EPSCs elicited by Schaffer collateral stimulation [(B) representative traces of AMPAR-EPSCs induced by increasingly stronger electrical stimulation and recorded at −70 mV in 50 μM picrotoxin and 50 μM D-AP-5 (2R)-amino-5-phosphonopentanoate); (C) input/output plot of the EPSC amplitude versus stimulus strength; (D) slope of the input/output relation; (E) rise and decay times of AMPAR-EPSCs]. (F to I) Conditional Nrxn2 deletion also increases NMDAR-mediated synaptic responses elicited by Schaffer collateral stimulation. Same as (B) to (E), except those responses were recorded at a holding potential of +40 mV in the presence of 20 μM CNQX instead of 50 μM D-AP-5 (2R)-amino-5-phosphonopentanoate). Data are means ± SEM; the numbers of neurons per mice analyzed are listed in the graphs. Statistical assessments were performed by two-way ANOVA (C and G) or Mann-Whitney test (all bar graphs) comparing the Cre condition to the ΔCre controls, with *P < 0.05, **P < 0.01, and ***P < 0.001.
Fig. 6.
Fig. 6.. Conditional deletion of Nrxn2 in the hippocampus of adolescent mice selectively impairs spatial reversal learning.
(A to F) The conditional Nrxn2 deletion in the hippocampal formation at P24 has no effect on the mouse behavior in the open-field test, arguing against a global disruption in brain function. (G to J) Behavioral assays show that the conditional deletion of Nrxn2 in the hippocampus does not impair acquisition of spatial memory in the water T-maze test. For more assays, see fig. S7. (K to N) Conditional deletion of Nrxn2 in the hippocampus induces a significant impairment in spatial reversal learning in the water T-maze test, suggesting an inability in relearning a new spatial situation. Data are means ± SEM; the numbers of mice analyzed are listed in the graphs. Statistical assessments were performed by two-way ANOVA (G to I and K to M) or Mann-Whitney test (A to F, J, and N) comparing the Cre condition to the ΔCre controls, with *P < 0.05 and **P < 0.01

References

    1. J. R. Sanes, S. L. Zipursky, Synaptic specificity, recognition molecules, and assembly of neural circuits. Cell 181, 536–556 (2020). - PubMed
    1. H. Y. Kim, J. W. Um, J. Ko, Proper synaptic adhesion signaling in the control of neural circuit architecture and brain function. Prog. Neurobiol. 200, 101983 (2021). - PubMed
    1. S. Jang, H. Lee, E. Kim, Synaptic adhesion molecules and excitatory synaptic transmission. Curr. Opin. Neurobiol. 45, 45–50 (2017). - PubMed
    1. A. Ribic, T. Biederer, Emerging roles of synapse organizers in the regulation of critical periods. Neural Plast. 2019, 1538137 (2019). - PMC - PubMed
    1. T. C. Südhof, The cell biology of synapse formation. J. Cell Biol. 220, e202103052 (2021). - PMC - PubMed