. 2023 Jan 6;8(79):eabp9940.
doi: 10.1126/sciimmunol.abp9940. Epub 2023 Jan 6.

Epithelial-intrinsic defects in TGFβR signaling drive local allergic inflammation manifesting as eosinophilic esophagitis

Affiliations

Epithelial-intrinsic defects in TGFβR signaling drive local allergic inflammation manifesting as eosinophilic esophagitis

Karen Laky et al. Sci Immunol. .

Abstract

Allergic diseases are a global health challenge. Individuals harboring loss-of-function variants in transforming growth factor-β receptor (TGFβR) genes have an increased prevalence of allergic disorders, including eosinophilic esophagitis. Allergic diseases typically localize to mucosal barriers, implicating epithelial dysfunction as a cardinal feature of allergic disease. Here, we describe an essential role for TGFβ in the control of tissue-specific immune homeostasis that provides mechanistic insight into these clinical associations. Mice expressing a TGFβR1 loss-of-function variant identified in atopic patients spontaneously develop disease that clinically, immunologically, histologically, and transcriptionally recapitulates eosinophilic esophagitis. In vivo and in vitro, TGFβR1 variant-expressing epithelial cells are hyperproliferative, fail to differentiate properly, and overexpress innate proinflammatory mediators, which persist in the absence of lymphocytes or external allergens. Together, our results support the concept that TGFβ plays a fundamental, nonredundant, epithelial cell-intrinsic role in controlling tissue-specific allergic inflammation that is independent of its role in adaptive immunity.


Conflict of interest statement

Competing interests: Authors declare that they have no competing interests.

Figures

Fig 1.
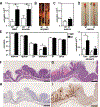
Fig 1.. R1 mice spontaneously develop clinical and histological features that phenocopy human EoE.
(A, B) Gross photos of esophagi from WT (A) and R1 (B) mice show esophageal dilation and food impaction in R1 mice. (C) Esophagi of WT or R1 mice were flushed and then the lyophilized contents were weighed. Each bar is the mean ± SEM of 5–7 mice analyzed individually. (D, E) Cross-sections of H&E-stained esophagi from WT (D) and R1 (E) mice show dilation and inflammation in R1 mice. (F-J). IHC for eosinophil granule major basic protein (MBP) in cross-sections of esophagi from representative WT (F) and R1 (G) mice illustrate examples of >15 eosinophils per hpf (G, H), eosinophilic micro-abscess (I) and surface layering of eosinophils (J) in R1 esophagi. (K-N). H&E-stained tissues show basal cell hyperplasia (L), abscess (M) and rete peg expansion (E, N) in R1 mice, none of which are seen in WT esophagi (D, K). D-G Scale bars 200μM; H-N Scale bars 50μM. Mice were ≥24 wk old.
Fig 2.
Fig 2.. Transcriptional profile of R1 esophagi is consistent with EoE endotype 2.
(A) Correlation analysis of Tgfbr1M318R mice based on gene expression of the EoE Diagnostic Panel of Shoda et al. (7). The Pearson’s correlation coefficient was calculated across all 96 genes for 9 individual 16 wk old R1 mice versus the mean expression in the discovery cohort for each endotype. (B) RNA isolated from the inner esophagus of 8–10 wk old WT and R1 mice was analyzed by RT-PCR. Data shown are the mean fold change ± SEM for N= 12 mice per group. (C-E) R1 esophagi show no signs of fibrostenosis, a hallmark feature of EoE endotype 3. (C) Heat map of RNA-seq expression data depicting collagen gene expression in 16 wk old R1 esophagi. The representative collagen gene in the human EoE diagnostic panel Col8a2, is highlighted (◄). Collagen genes whose promoter contains a SMAD binding element or have been previously demonstrated to be induced by TGFβ are marked by asterisks (*)(8, 98). (D) WT or R1 esophagi from representative ≥24 wk old mice stained with Masson’s Trichrome. Scale bars, 50 μM. (E) Hydroxyproline content in esophagus, lung, or liver, from ≥24 wk old WT and R1 mice was quantified as an indication of collagen content. Each bar is the mean ± SEM of 5–7 mice analyzed individually. See also Fig. S1.
Fig. 3.
Fig. 3.. R1 mice develop early onset EoE that is independent of T cells.
(A) RNASeq was performed using RNA isolated from the inner esophagus of 16 wk old WT and R1 mice. Heat map depicts the relative expression of genes characteristic of the hematopoietic cell lineages indicated. (B-G) R1 mice develop early onset EoE with characteristics of EoEe2. The number of total CD45+ cells (B) or eosinophils (C) isolated from esophagi of 3.5–24 wk old WT and R1 mice was enumerated using flow cytometry. Each data point is the mean ± SEM of ≥7 mice per group. (D) Modified Giemsa stained cytospin of eosinophils isolated from R1 esophagi. (E, F) H&E-stained images of esophagi from 3.5 wk old WT (E) and R1 (F) weanlings. (G) IHC for MBP in the esophagus of a representative 3.5 wk old R1 weanling with >15 eosinophils per hpf. (H) The inflammatory infiltrates isolated from esophagi of 8 wk old WT and R1 mice on RAG-sufficient and RAG-deficient backgrounds were analyzed by flow cytometry. Data are mean ± SEM of ≥14 mice per group. See also Figs. S2 and S3. (I-O) Images of esophagi from ≥24 wk old RAG−/− (I, J, L, N) and RAG−/−R1 (I, K, M, O) mice. H&E-stained sections illustrate dilation with food impaction (K) and basal cell hyperplasia (M) in RAG−/−R1 mice. IHC for MBP+ (N, O). Scale bars for x-sections 500 μM (E, F, J, K); all others 50 μM.
Fig. 4.
Fig. 4.. Non-hematopoietic cells are necessary and sufficient to initiate allergic inflammation in esophagi of R1 mice.
(A-D) WT and R1 mice were irradiated and reconstituted with CD45-congenic WT BM as adults or neonates (A, B). Conversely, WT mice were irradiated and reconstituted with R1 BM (C, D). Eight weeks after reconstitution the number of donor BM-derived eosinophils in the esophagus was enumerated. Data are mean ± SEM of ≥8 mice per group. Gross images illustrate that only R1 mice reconstituted with WT BM developed esophageal dilation with food impaction (B). (E-I) Features characteristic of EoE co-localize with stratified squamous epithelium. The number of eosinophils isolated from various tissues of 4–8 wk old WT and R1 mice was calculated. Data are mean ± SEM of ≥4 per group. Images of stomach from representative ≥24 wk old WT (F, H) or R1 (G, I) mice stained with H&E (F, G) or anti-MBP (H, I). Scale bars 500 μM.
Fig. 5.
Fig. 5.. No evidence of impaired barrier function in esophagi of R1 mice.
(A) Heat map of RNA-seq expression data from 16 wk old WT and R1 mice depicts relative expression of genes encoding structural proteins characteristic of each strata of epithelium. Genes associated with severe dermatitis, multiple selected developmentally regulated structural elements (●), cadherins (◄), claudins (←), and keratins (*) are highlighted. (B-Q) Ultrastructural features of esophagi from 8–16 wk old WT and R1 mice were analyzed by transmission electron microscopy. Scale bars are 2 μM except G, J 200 nm; K, P 4 μM; L 6 μM; N 5 μM. (R-T) Transepithelial electrical resistance (R) and paracellular permeability of 4 kD (S) or 70 kD (T) dextran through the esophageal wall of 8 wk old WT or R1 mice was measured using a Ussing Chamber. One chamber was left empty (hashed bars) to determine the maximum amount of transfer possible during the 3 h assay. Data are mean ± SEM of ≥4 mice per group. (U) Mean distance between cell bodies of adjacent basal epithelial cells in transmission electron microscopy images of esophagi from 8–16 wk old WT and R1 mice. Data are mean ± SEM of N=15 fields scored per genotype. See also Fig S5.
Fig. 6.
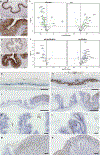
Fig. 6.. R1 esophageal epithelial cells show signs of distress and excessive proliferation.
(A, B) IHC showing the expression pattern of keratin 14 in esophagi from ≥24 wk old WT (A) and R1 (B) mice. (C) Volcano plots of RNA-seq expression data from esophagi from 16 wk old WT and R1 mice for genes differentially expressed between differentiated or basal keratinocyte genes (25). Horizontal dashed lines indicate significance (FDR<0.01). Differentially expressed genes whose promoter contains a SMAD2/3 binding element and/or have been previously reported to be transcriptionally regulated by TGFβ are blue (, –103). (D, E) IHC showing the expression of keratin 6 in esophagi of ≥24 wk old R1 (B) and WT (A) mice. (F) Volcano plots of RNA-seq expression data from esophagi from 16 wk old WT and R1 mice for genes encoding proteins that induce cell cycle arrest or promote proliferation (28, 104, 105). Horizontal dashed lines indicate significance (FDR<0.01). Differentially expressed genes whose promoter contains a SMAD2/3 binding element or have been previously demonstrated to be subject to regulation by TGFβ are blue (28, 98, 101, 102, 104, 105). (G-N) IHC for the thymidine-analogue BrdU in the esophagus (G, H), forestomach (I, J, K, L), and glandular stomach (I, J, M, N), of ≥20 wk old WT (G, I, K, M) and R1 (H, J, L, N) mice. Scale bars 100 μM except I, J 1 mm.
Fig. 7.
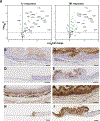
Fig. 7.. R1 epithelial cells show signs of chronic activation associated with tissue-restricted inflammation.
(A) Volcano plots of RNA-seq expression data from esophagi from 16 wk old WT and R1 mice depicting genes transcriptionally regulated by IL-1 and TNFα (, , , , –108). Horizontal dashed lines indicate significance (FDR<0.01). Differentially expressed genes whose promoter contains a SMAD2/3 binding element and/or have been previously demonstrated to be transcriptionally regulated by TGFβ are blue(–103, 105). (B-E) IHC staining of S100A9 in esophagi (B, C) and stomachs (D, E) of ≥24 wk old WT (B, D) and R1 (C, E) mice. (F-I) IHC staining of eosinophil chemotactic factor like protein in esophagi (F, G) and stomachs (H, I) of ≥24 wk old WT (F, H) and R1 (G, I) mice. Scale bars esophagus 50 μM, stomach 500 μM. See also Fig S7.
Fig. 8.
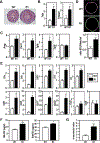
Fig. 8.. Cell intrinsic changes in R1 esophageal epithelial cells drive allergic inflammation.
(A) Representative images of H&E-stained organoids generated from WT and R1 esophageal epithelial cells. Scale bars 500 μM. (B, C) RNA isolated from WT and R1 organoids was analyzed by RT-PCR for expression of EoEe2 signature genes (B) and genes encoding epithelial growth factors (C). Each bar is the mean fold change ± SEM of 6 wells analyzed per genotype. (D) Organoids generated from WT and R1 esophageal epithelial cells were pulsed with the thymidine analogue EdU. Nuclei were stained for EdU (green) and Hoechst33342 (purple) and then the ratios of EdU+ cells amongst total nucleated Hoechst33342+ cells were calculated. Each bar is the mean ± SEM of ≥5 wells analyzed per genotype. (E) RNA isolated from WT and R1 organoids was analyzed by RT-PCR for expression of the genes indicated. Each bar is the mean fold change ± SEM of ≥4 wells analyzed per genotype. (F) The concentration of RANTES and GM-CSF protein secreted by WT and R1 epithelial organoids was quantified in culture supernatants using Luminex immunoassays. Each bar is the mean ± SEM of 6 wells analyzed per genotype. (G) Supernatants from R1 and WT organoids were added to the lower chamber of a Transwell apparatus. Eosinophils were plated in the top chamber and then allowed to migrate for 3 h before counting. Each bar is the mean ± SEM of ≥15 wells analyzed per genotype.

References

    1. Davis BP, Rothenberg ME, Mechanisms of Disease of Eosinophilic Esophagitis. Annu Rev Pathol 11, 365–393 (2016). - PMC - PubMed
    1. Frischmeyer-Guerrerio PA, Guerrerio AL, Oswald G, Chichester K, Myers L, Halushka MK, Oliva-Hemker M, Wood RA, Dietz HC, TGFbeta receptor mutations impose a strong predisposition for human allergic disease. Sci Transl Med 5, 195ra194 (2013). - PMC - PubMed
    1. Gallo EM, Loch DC, Habashi JP, Calderon JF, Chen Y et al., Angiotensin II-dependent TGF-beta signaling contributes to Loeys-Dietz syndrome vascular pathogenesis. J Clin Invest 124, 448–460 (2014). - PMC - PubMed
    1. Cardoso S, Robertson SP, Daniel PB, TGFBR1 mutations associated with Loeys-Dietz syndrome are inactivating. J Recept Signal Transduct Res 32, 150–155 (2012). - PubMed
    1. Collins MH, Martin LJ, Alexander ES, Boyd JT, Sheridan R et al., Newly developed and validated eosinophilic esophagitis histology scoring system and evidence that it outperforms peak eosinophil count for disease diagnosis and monitoring. Dis Esophagus 30, 1–8 (2017). - PMC - PubMed

Publication types

Substances

Supplementary concepts