. 2023 Jan 5;186(1):178-193.e15.
doi: 10.1016/j.cell.2022.11.027.

An approximate line attractor in the hypothalamus encodes an aggressive state

Affiliations

An approximate line attractor in the hypothalamus encodes an aggressive state

Aditya Nair et al. Cell. .

Abstract

The hypothalamus regulates innate social behaviors, including mating and aggression. These behaviors can be evoked by optogenetic stimulation of specific neuronal subpopulations within MPOA and VMHvl, respectively. Here, we perform dynamical systems modeling of population neuronal activity in these nuclei during social behaviors. In VMHvl, unsupervised analysis identified a dominant dimension of neural activity with a large time constant (>50 s), generating an approximate line attractor in neural state space. Progression of the neural trajectory along this attractor was correlated with an escalation of agonistic behavior, suggesting that it may encode a scalable state of aggressiveness. Consistent with this, individual differences in the magnitude of the integration dimension time constant were strongly correlated with differences in aggressiveness. In contrast, approximate line attractors were not observed in MPOA during mating; instead, neurons with fast dynamics were tuned to specific actions. Thus, different hypothalamic nuclei employ distinct neural population codes to represent similar social behaviors.

Keywords: MPOA; VMH; aggression; calcium imaging; courtship; dynamical systems; hypothalamus; innate behavior; line attractor; rSLDS.


Conflict of interest statement

Declaration of interests The authors declare no competing interests.

Figures

Figure 1:
Figure 1:. Cytoarchitectures and cellular representations in a neural system regulating social behavior
A, B: cytoarchitecture of MPOA (A) and VMHvl (B). C, D: example traces from Esr1 + neurons in MPOA (C) and VMHvl (D). E, F: clustering of recorded Esr1+ neurons in MPOA (E, n =306 neurons from 3 mice) and VMHvl (F, n = 391 neurons from 4 mice) using a regression model. Rows, hand-annotated behaviors; columns, individual neurons.
Figure 2:
Figure 2:. Dynamical analysis of VMHvl neural activity reveals an integrator dimension that correlates with aggressive escalation
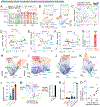
A: schematic illustrating rSLDS analysis. B: time constants of rSLDS dimensions (see A➀) in attack enriched state from VMHvl mouse 1. Dimensions with longest (red dot) and shortest (yellow dot) time constants are indicated. C: projection onto time axis of integration dimension with overlayed behavior annotations. D: average time constant of all dimensions, arranged in decreasing order. (***p < 0.001, n = 6 mice). E: average F1 score of binary decoder of behavior pairs trained on integration dimension activity (**p < 0.005, *p<0.01, n = 6 mice). F: cumulative distribution of integration dimension value (normalized) for different behaviors. G: projection of fastest dimension in example VMHvl mouse 1. H: performance of binary decoder of behavior pairs trained on fastest dimension activity (n = 6 mice). For additional data see Supplemental Figure S1, S2 and S3.
Figure 3:
Figure 3:. VMHvl contains an approximate line attractor that integrates aggressive escalation
A: behavior rasters shown with first two principal components of dynamical system (see Methods) for example VMHvl mouse 1. B: inferred dynamics shown as a flow field (with attractor highlighted) and 3D landscape for point attractors (left) and line attractors (right). C: neural state space with population trajectories and inferred flow field colored by rSLDS states for VMHvl mouse 1, with line attractor highlighted. D-F: neural state space for VMHvl mouse 1 (D), mouse 2 (E) and mouse 3 (F) with line attractor highlighted (see Methods). G: line attractor score (see Methods) for VMHvl (red bar, n = 6 mice). H,I: inferred 3D dynamic landscape in VMHvl mouse 1(H,I). J,K: Same as H but for VMHvl mouse 2 (J) and mouse 3 (K) L: position of various behaviors along trough, i.e PC1 in neural state space (n = 6 mice, **p<0.005, *p<0.01) M: schematic showing quantification of dynamic velocity. N: dynamic velocity for various behaviors in VMHvl (***p<0.001, n = 6 mice) O: relationship between the time spent attacking and the time constant of the integration dimension of individual mice (r2: 0.77, n = 14 animals). For additional data see Supplemental Figure S4.
Figure 4:
Figure 4:. Mating behaviors are represented using rotational dynamics in the MPOA
A: time constants of rSLDS dimensions in mating behavior-enriched state in MPOA (n = 3 mice) B: behavior rasters shown with first two principal components of latent factors for example MPOA mouse 2. C: behavior triggered average of top two principal components aligned to USV+ mount onset (left) and intromission (right) onset (n = 3 mice). D: neural state space with rotational population trajectories from mating episodes shown in E of MPOA mouse 1, colored by behaviors performed by resident mouse. E: sequential activity of MPOA neurons during mating episodes whose rotational population trajectories are shown in D. F,G: same as D,E but for MPOA mouse 2. H: sequential index for MPOA (n = 3 mice, ***p<0.001). I: calculation of angle of rotation (θ) aligned to the start of sniffing during mating episodes (top). Empirical cumulative distribution of θ for various behaviors (n = mice, bottom). J: quantification of θ for various mating behaviors (n = 3 mice, ***p<0.001, **p<0.005, *p<0.01, top). Schematic depicting θ for mating behaviors (bottom). K: dynamic velocity for mating behavior in MPOA (n = 3 mice).. L: line attractor score for MPOA activity in mating behaviors towards females (left, pink bar, n = 3 mice) and VMHvl activity in aggressive behavior towards males (right, grey bar, n = 6 mice, **p<0.005, data from Fig 3G reproduced for comparative purposes). For additional data see Supplemental Figure S5.
Figure 5:
Figure 5:. Distinct neural coding schemes for similar behavior in VMHvl vs MPOA
A: line attractor score for mating behavior in MPOA and aggressive behavior in VMHvl (n = 3 mice for MPOA, n = 6 mice for VMHvl), reproduced from Figure 4L. B: scatter plot for line attractor score versus attractor stability score (magnitude of largest time constant) separates VMHvl and MPOA. C,D: dynamic velocity score in VMHvl during aggression (C) and MPOA during mating (D), reproduced from Figure 3N and Figure 4K respectively. E: empirical cumulative distribution of value of integration dimension (normalized) in VMHvl for various aggressive behaviors, reproduced from Figure 2F. F: empirical cumulative distribution of angle of rotation (normalized) in MPOA for various mating behaviors, reproduced from Figure 4I. G,H: Sequentiality index in MPOA (n = 3 mice), reproduced from Figure 4E, and in VMHvl (H) in aggression (n = 3 mice). I: summary of line attractor dynamics in VMHvl. J: summary of rotational dynamics in MPOA.
Figure 6:
Figure 6:. Distinct coding schemes of VMHvl and MPOA are region-specific, not intruder-specific
A: left: time constants of rSLDS dimensions of mating enriched state from example VMHvl mouse 1. The red dot highlights the integration dimension. B: projection of integration dimension with overlayed behavior annotations. C: F1 score for decoding behavior pairs from integration dimension (**p < 0.005, *p<0.01, n = 4 mice for comparisons involving intromission as only 4/6 mice showed this behavior. n = 6 mice for all other comparisons). D: time constant arranged in decreasing order. (p < 0.001, n = 6 mice). E: behavior rasters shown with PCs of dynamical system for example VMHvl mouse 1. F: neural state space with population trajectories for VMHvl mouse 1 colored by behavior annotations and flow field showing a line attractor. G: quantification of dynamic velocity during mating behavior in VMHvl (p<0.001, n = 6 mice). H: line attractor score for MPO (n = 3 mice) and VMHvl (n = 6 mice) during mating behavior with females (**p<0.005). I: time constants of rSLDS dimensions from MPOA during aggression. J: behavior rasters shown with PCs of dynamical system for example MPOA mouse 1. K: neural state space with population trajectories for MPOA mouse 1 colored by behavior annotations and flow field. L: dynamic velocity during aggressive behavior in MPOA (**p<0.005, n = 3 mice). M: line attractor score for MPO (n = 3 mice) and VMHvl (n = 6 mice, reproduced from Fig 3G) during aggressive behavior (**p<0.005). N: Schematic illustrating two line attractors discovered in VMHvl encoding aggressiveness and mating intent. 0: Schematic illustrating dynamics seen in MPOA showing similarity in stability of behaviors during interactions with males and females. For additional data see Supplemental Figure S5.

References

    1. Hahn JD, Sporns O, Watts AG, and Swanson LW (2019). Macroscale intrinsic network architecture of the hypothalamus. Proc Natl Acad Sci U S A 116, 8018–8027. 10.1073/pnas.1819448116. - DOI - PMC - PubMed
    1. Saper CB, and Lowell BB (2014). The hypothalamus. Curr Biol 24, R1111–1116. 10.1016/j.cub.2014.10.023. - DOI - PubMed
    1. Paredes RG, and Baum MJ (1997). Role of the medial preoptic area/anterior hypothalamus in the control of masculine sexual behavior. Annu Rev Sex Res 8, 68–101. - PubMed
    1. Siegel A, Roeling TA, Gregg TR, and Kruk MR (1999). Neuropharmacology of brain-stimulation-evoked aggression. Neurosci Biobehav Rev 23, 359–389. 10.1016/s0149-7634(98)00040-2. - DOI - PubMed
    1. Canteras NS. (2002). The medial hypothalamic defensive system: hodological organization and functional implications. Pharmacology Biochemistry and Behavior 71, 481–491. - PubMed

Publication types

MeSH terms

LinkOut - more resources