. 2023 Jan 5;30(1):52-68.e13.
doi: 10.1016/j.stem.2022.12.006.

METTL16 drives leukemogenesis and leukemia stem cell self-renewal by reprogramming BCAA metabolism

Affiliations

METTL16 drives leukemogenesis and leukemia stem cell self-renewal by reprogramming BCAA metabolism

Li Han et al. Cell Stem Cell. .

Abstract

N6-methyladenosine (m6A), the most prevalent internal modification in mammalian mRNAs, is involved in many pathological processes. METTL16 is a recently identified m6A methyltransferase. However, its role in leukemia has yet to be investigated. Here, we show that METTL16 is a highly essential gene for the survival of acute myeloid leukemia (AML) cells via CRISPR-Cas9 screening and experimental validation. METTL16 is aberrantly overexpressed in human AML cells, especially in leukemia stem cells (LSCs) and leukemia-initiating cells (LICs). Genetic depletion of METTL16 dramatically suppresses AML initiation/development and maintenance and significantly attenuates LSC/LIC self-renewal, while moderately influencing normal hematopoiesis in mice. Mechanistically, METTL16 exerts its oncogenic role by promoting expression of branched-chain amino acid (BCAA) transaminase 1 (BCAT1) and BCAT2 in an m6A-dependent manner and reprogramming BCAA metabolism in AML. Collectively, our results characterize the METTL16/m6A/BCAT1-2/BCAA axis in leukemogenesis and highlight the essential role of METTL16-mediated m6A epitranscriptome and BCAA metabolism reprograming in leukemogenesis and LSC/LIC maintenance.

Keywords: AML; BCAA metabolism; BCAT1; BCAT2; LSCs/LICs; METTL16; leukemia stem cells; leukemia-initiating cells; m6A modification; self-renewal.


Conflict of interest statement

Declaration of interests J.C. is a scientific advisory board member of Race Oncology.

Figures
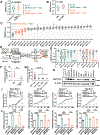
Figure 1.
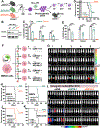
Figure 1.. CRISPR-Cas9 Screenings and in vitro Functional Studies Reveal the Dependency of METTL16 for AML Cell Survival and Proliferation.
(A) Comparison of METTL16 CERES scores between the 47 leukemia cell lines and the 761 non-leukemia cell lines. (B) Comparison of METTL16 CERES scores between the 22 AML cell lines and the 25 non-AML leukemia cell lines. (C) Violin plots depicting the CERES scores of all the METTL family members across the 22 AML cell lines. (D) Schematic describing our in-house CRISPR screening in two NB4 cas9 single clones. (E) Violin plots presenting the CRISPR scores of indicated gene in two NB4 cas9 single clones. Killer gene was served as a positive control. The *** (p < 0.001) represents the p values of unpaired t test of METTL16 vs. Ctrl, METTL16 vs. METTL3, METTL16 vs. METTL14, and METTL16 vs. METTL4 (n=25 sgRNAs). (F) Comparison of expression levels of METTL16 between AML samples (n=10 patients) and healthy controls (n=4 healthy donors) as determined by RNA-seq (mean ± SD). (G) Relative expression levels of METTL16 in human AML samples (n=45 cell lines), healthy MNC (n=16 healthy donors), healthy MNC-derived CD34 cells (n=11 healthy donors) and healthy MNC-derived CD34+ cells (n=5 healthy donors) as determined by qPCR (mean ± SD). (H) Western blotting showing expression of METTL16 in AML cells (n=11 cell lines) and healthy controls. β-actin was used as a loading control. (I, J) The effects of METTL16 KO with or without METTL16 restoration on the proliferation/growth (I; detected by MTT assay) and myeloid differentiation (J; detected by flow cytometry) of human AML cell lines (mean ± SD, n = 3 independent experiments). Statistical analysis: Unpaired t test (A, B, E, F, and G); Two-way ANOVA (I); One-way ANOVA (J). **p < 0.01; ***p < 0.001. See also Figure S1.
Figure 2.
Figure 2.. METTL16 is Required for Leukemogenesis in vivo.
(A) Schematic overview of in vivo primary bone marrow transplantation (BMT) assay and in vitro colony-forming/replating assay (CFA). (B) Western blot confirming depletion of Mettl16 in MA9-transduced murine Lin HSPCs. (C) Effect of Mettl16 KO on the colony forming ability of MA9-transduced Lin HSPCs. Data are represented as mean ± SD (n = 4 independent experiments). (D) Kaplan-Meier survival curves of mice transplanted with MA9 transduced WT, Mettl16 Hetero, and Mettl16 Homo Lin HSPCs (n = 5 mice per group). (E) Percentage of the MA9 AML donor cells (CD45.2+) in the PB, spleen, and BM of primary BMT recipient mice (CD45.1+). The samples were collected on day 78 post transplantation. (mean ± SD, n = 5 mice per group) (F) Schematic of xenotransplantation assay with human AML cells and NRGS immune-deficient recipient mice. (G) Representative in vivo bioluminescent images of NRGS recipient mice xeno-transplanted with luciferase+/Cas9+ MMC6 AML cells transduced with indicated lentiviruses (see Figure 2F for the annotation). (H-J) Kaplan-Meier survival curves of NRGS recipient mice xeno-transplanted with luciferase+/Cas9+ MMC6 cells transduced with indicated lentiviruses. n = 6 mice per group. (K) Kaplan-Meier survival curves of NRGS recipient mice xeno-transplanted with luciferase+ MA9.3ITD AML cells that were virally transduced with indicated lentiviruses. n = 8 mice per group. (L) In vivo bioluminescent images of NRGS recipient mice xeno-transplanted with luciferase+ MA9.3ITD cells transduced with indicated lentiviruses. n= 8 mice per group. Statistical analysis: Log-rank test (D, and H-K); Unpaired t test (C and E). *p < 0.05; **p < 0.01; ***p < 0.001. See also Figure S2.
Figure 3.
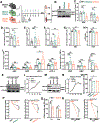
Figure 3.. METTL16 is highly Expressed in LSCs/LICs and Genetic Depletion of METTL16 Attenuates LSC/LIC Self-renewal.
(A) In vivo bioluminescent images of PDX mouse models with human AML 2017-129 cells (1×10⁶ per recipient) transduced with indicated lentiviruses. (B) Kaplan-Meier curves showing the effect of METTL16 KO alone or with restored METTL16 expression on the survival of AML 2017-129 PDX models (1×10⁶ per recipient). n = 5 mice per group. (C) In vivo bioluminescent images of AML 2017-129 PDX models upon METTL16 KO (2×10⁵ per recipient). (D) Kaplan-Meier curves showing the effect of METTL16 level changes on survival of AML 2017-129 PDX models (2×10⁵ per recipient). n = 6 mice for sgNS+EV; n = 6 mice for sgM16-1+EV; n = 4 mice for sgM16-2+M16-MUT1. (E, F) Kaplan-Meier curves showing the effect of METTL16 KO on the survival of AML HTB22-0148 (E) and 2016-35 (F) PDX models (5×10⁶ per recipient). n = 5 mice per group. (G) Histogram Plot showing CD34 surface staining and METTL16 intracellular staining in bulk BM-derived mononuclear cells (BMMNCs) of healthy donors (n = 3) and AML patients (n = 7). (H) Histogram Plot showing METTL16 abundance in CD34 and CD34+ population in BM cells from AML patients (n = 7). (I) Comparison of METTL16 abundance between paired CD34 and CD34+ BMMNCs from AML patients and healthy control donors (n = 10). (J) Scheme depicting the gating strategy for GMP-L LSC population in BM MNCs of primary MA9 AML mice. The representative data from Mettl16 WT and heterozygous KO groups were shown. The samples were collected on 78 days post BMT. (K) Percentage of GMP-L LSCs in the BM of Mettl16 WT and Mettl16fl/+ MA9 AML mice (mean ± SD, n = 4 mice per group). (L) In vivo limiting dilution assay showing the effect of Mettl16 depletion on LSC frequency. Table (left panel) shows the donor cell numbers used for secondary MA9 BMT and the ratios of the recipient mice with AML symptom 8 weeks post transplantation. Graph (right panel) shows LSC/LIC frequency, and the p values as determined by ELDA software. n = 5 mice per group. Statistical analysis: Log-rank test (B, D, E, and F); Paired t test (I); Unpaired t test (K). **p < 0.01; ***p < 0.001. See also Figure S3.
Figure 4.
Figure 4.. METTL16 Deletion Shows Moderate Effect on Normal Hematopoiesis.
(A) Schematic overview of poly(I:C)-induced conditional KO of Mettl16 in mice. (B) Western blotting showing the Mettl16 KO in murine Lin HSPCs. The samples were collected 4 weeks post poly(I:C) treatment. (C-H) PB analysis of Mettl16 WT, heterozygous KO and homozygous KO mice. The PB samples were collected 4 weeks post poly(I:C) treatment. The levels of white blood cells (WBC) and lymphoma cells (LYM) (C), palates (PLT) (D), granulocytes (Granu) (E), Monocyte (MONO) (F), Red blood cells (RBC) (G), and HGB (H) were displayed (mean ± SD) (n = 7 WT mice, n =7 heterozygous mice, n = 5 homozygous mice). (I, J) Frequencies of various hematopoietic progenitors in the BM of Mettl16 WT, heterozygous KO and homozygous KO mice. The PB samples were collected 4 weeks post poly(I:C) treatment (mean ± SD, n = 5 mice per group). (K) Western blotting showing KD efficiency of METTL16 shRNAs in human cord blood CD34+ HSPCs. (L) Effect of METTL16 KD on cell proliferation/growth of human cord blood CD34+ HSPCs (mean ± SD, n = 3 independent experiments). (M) Western blotting showing KD efficiency of Mettl16 shRNAs in murine Lin HSPCs. (N) Effect of Mettl16 KD on cell proliferation/growth of murine Lin HSPCs (mean ± SD, n = 3 independent experiments) (O) Effect of METTL16 KD on the colony-forming ability of human normal BM CD34+ HSPCs (mean ± SD, n = 3 independent experiments). (P) Comparison of the effects of METTL16 KD on the colony-forming ability between human normal BM CD34+ HSPCs and AML BM CD34+ LSCs/LICs. (Q) Effect of Mettl16 deletion on the colony-forming ability of murine normal Lin HSPCs (mean ± SD, n = 3 independent experiments). (R) Comparison of the effects of Mettl16 deletion on the colony-forming ability between murine normal Lin HSPCs and AML MA9 LSCs/LICs (mean ± SD, n = 3 independent experiments). Statistical analysis: Unpaired t test (C-J, O-R); Two-way ANOVA (L and N). **p < 0.01; ***p < 0.001. See also Figure S4.
Figure 5.
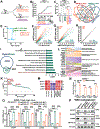
Figure 5.. The Methyltransferase Activity of METTL16 is Required for its Tumor-Promoting Function in AML.
(A) Schematic representation of the location of mutations in the MTase-domain of METTL16. MTase-domain: Methyltransferase domain. PP185/186AA: Catalytic-dead mutant. F187G: RNA-binding mutant. (B, C) Effect of restoration of WT or two loss-of-function mutants of METTL16 on cell proliferation/growth (B) or apoptosis (C) of NOMO-1 AML cells upon endogenous METTL16 KO (mean ± SD, n = 3 independent experiments). (D) MeRIP-seq analysis showing the overlap of m6A-hypo transcripts in NOMO-1 cells upon two sgRNAs-mediated METTL16 KO from two biological replicates. MeRIP-seq, m6A specific methylated RNA immunoprecipitation. (E) Principal component analysis (PCA) of RNA-seq data from the three groups of NOMO-1 cells (n = 2 biological replicates). (F-H) Scatterplot showing the changes of gene expression between Ctrl and sgM16 groups (F), between sgM16+M16 and sgM16 groups (G), or between Ctrl and sgM16+M16 groups (H). Significantly upregulated and downregulated genes were highlighted in orange and green, respectively. FC, fold change. (I) Venn diagram showing the overlap between the transcripts with m6A-hypo peaks upon METTL16 KO (MeRIP-seq) and the significantly downregulated transcripts upon METTL16 KO (RNA-seq) in NOMO-1 cells. (J) GSEA analysis of overlapping transcripts in Figure 5I. Top 10 significantly enriched pathways and the −log(P) value for each pathway were shown. (K) Hockey-stick plot representing all the core enriched genes in the Top 10 significantly enriched pathways in Figure 5J. Genes were ranked according to their −logFC (Ctrl vs sgM16) values based on our RNA-seq results. The genes associated with Valine, leucine and isoleucine biosynthesis pathway are shown in red. (L) Sankey diagram showing the top 20 down-regulated core enriched gene in Figure 5K and their corresponding pathways. (M) Heatmap showing the expression levels of BCAT1, BCAT2, LARS1 and IARS1 in NOMO-1 cells transduced with indicated lentiviruses. The results were derived from our RNA-seq. (N) RIP-qPCR analysis showing that METTL16 directly binds to BCAT1, BCAT2, LARS1 and IARS1 transcripts in NOMO-1 cells (mean ± SD, n = 3 independent experiments). (O) qPCR analysis of BCAT1, BCAT2, LARS1 and IARS1 mRNA levels changes upon modulating METTL16 expression in NOMO-1 cells (mean ± SD, n = 3 independent experiments). (P) Protein level changes of BCAT1, BCAT2 and LARS1 in NOMO-1 cells upon METTK16 KO with or without METTL16 restoration, as detected by Western blotting. For IARS1, we didn’t find an appropriate antibody to detect its expression. Statistical analysis: Two-way ANOVA (B); One-way ANOVA (C and O); Unpaired t test (N). ***p < 0.001. See also Figure S5.
Figure 6.
Figure 6.. METTL16 positively Regulates BCAT1 and BCAT2 Expression in an m6A-Dependent Manner.
(A) Gene-specific m6A qPCR analysis of m6A enrichment on BCAT1 and BCAT2 mRNA transcripts in MMC6 cells (mean ± SD, n = 3 independent experiments). (B) Schematic describing the in vitro (cell-free) methyltransferase assays with recombinant METTL16 protein. (C) Evaluation of the m6A methyltransferase activity of METTL16 in methylating BCAT1 and BCAT2 mRNAs by QQQ-MS. (D) METTL16 RIP-qPCR analysis showing METTL16 directly binds to BCAT1 and BCAT2 mRNA in MMC6 cells (mean ± SD, n = 3 independent experiments). (E) The stability changes of BCAT1 and BCAT2 mRNAs in MMC6 cells upon METTL16 KO (mean ± SD, n = 3 independent experiments). (F) qPCR analysis of rescue effect of WT or catalytic inactive mutant (PP185/186AA and F187G) METTL16 on BCAT1 and BCAT2 expression in MMC6 cells with endogenous METTL16 KO (mean ± SD, n = 3 independent experiments). (G) Effect of YTHDC1 KD on the stability of BCAT1 (left panel) and BCAT2 (right panel) mRNAs in MMC6 cells (mean ± SD, n = 3 independent experiments). (H) Determination of the direct binding of YTHDC1 with BCAT1/BCAT2 mRNA transcripts in MMC6 cells (mean ± SD, n = 3 independent experiments). Statistical analysis: One-way ANOVA (A and F); Unpaired t test (D and H). **p < 0.01; ***p <0.001. See also Figure S6.
Figure 7.
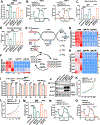
Figure 7.. METTL16 KO Subverts BCAA Metabolism in AML.
(A) Intracellular free BCAA concentration in MMC6 cells after transduction with indicated lentiviruses (mean ± SD, n = 3 independent experiments). (B) Measurement of oxygen consumption rates (OCR) in MMC6 cells infected with indicated lentiviruses (mean ± SD, n = 4 independent experiments). (C, D) Effect of METTL16 changes on basal (C) and maximal (D) respiration in MMC6 cells (mean ± SD, n = 4 independent experiments). (E) Schematic outline of leucine tracing assay. Red circles indicate 13C-labeled carbons. Blue circles indicate 15N-labeled nitrogens. KIC, α-ketoisocaproate; NEAAs, non-essential amino acids; TCA, tricarboxylic acid. (F-H) Heatmap showing the relative labeling ion count changes detected by LC-MS analysis of TCA cycle metabolites (F), labeling amino acids (G) and labeling nucleotides (H) in MMC6 cells upon METTL16 depletion. (I) Relative proliferation rate changes of MMC6 cells upon METTL16 KO in the BCAA-free medium (mean ± SD, n = 3 independent experiments). (J) Validation of expression of METTL16, BCAT1 and BCAT2 in MMC6 cells after transduction with indicated lentiviruses via Western blotting. (K-M) The effects of BCAT1 and BCAT2 overexpression on cell proliferation (K and L) and apoptosis (M) in MMC6 cells upon METTL16 KO (mean ± SD, n = 3 independent experiments). (N, O) Seahorse assays displaying the effects of forced expression of BCAT1 and BCAT2 on restoring OCR in MMC6 cells upon METTL16 KO (mean ± SD, n = 4 independent experiments). Statistical analysis: One-way ANOVA (A, C, D, and M); Two-way ANOVA (K and L); Unpaired t test (I). ns, not significant; *p < 0.05; **p < 0.01; ***p < 0.001. See also Figure S7.

Comment in

References

    1. Dohner H, Weisdorf DJ, and Bloomfield CD (2015). Acute Myeloid Leukemia. N Engl J Med 373, 1136–1152. 10.1056/NEJMra1406184. - DOI - PubMed
    1. Hope KJ, Jin L, and Dick JE (2004). Acute myeloid leukemia originates from a hierarchy of leukemic stem cell classes that differ in self-renewal capacity. Nature immunology 5, 738–743. 10.1038/ni1080. - DOI - PubMed
    1. Pollyea DA, and Jordan CT (2017). Therapeutic targeting of acute myeloid leukemia stem cells. Blood 129, 1627–1635. 10.1182/blood-2016-10-696039 - DOI - PubMed
    1. Stubbs MC, and Armstrong SA (2007). Therapeutic implications of leukemia stem cell development. Clin Cancer Res 13, 3439–3442. - PubMed
    1. Krivtsov AV, Twomey D, Feng Z, Stubbs MC, Wang Y, Faber J, Levine JE, Wang J, Hahn WC, Gilliland DG, et al. (2006). Transformation from committed progenitor to leukaemia stem cell initiated by MLL-AF9. Nature 442, 818–822. 10.1038/nature04980. - DOI - PubMed

Publication types