. 2023;15(6):1293-1310.
doi: 10.1016/j.jcmgh.2022.12.016. Epub 2023 Jan 4.

Enteroendocrine Cells Protect the Stem Cell Niche by Regulating Crypt Metabolism in Response to Nutrients

Affiliations

Enteroendocrine Cells Protect the Stem Cell Niche by Regulating Crypt Metabolism in Response to Nutrients

Heather A McCauley et al. Cell Mol Gastroenterol Hepatol. 2023.

Abstract

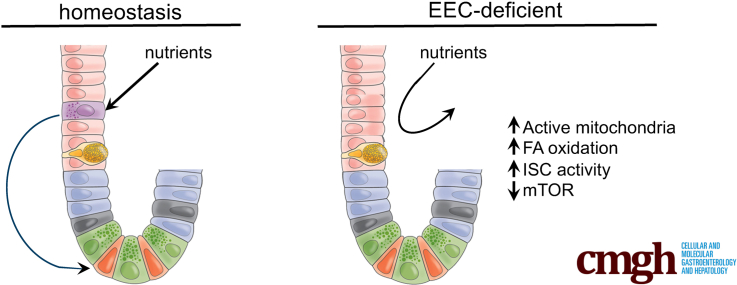
Background & aims: The intestinal stem cell niche is exquisitely sensitive to changes in diet, with high-fat diet, caloric restriction, and fasting resulting in altered crypt metabolism and intestinal stem cell function. Unlike cells on the villus, cells in the crypt are not immediately exposed to the dynamically changing contents of the lumen. We hypothesized that enteroendocrine cells (EECs), which sense environmental cues and in response release hormones and metabolites, are essential for relaying the luminal and nutritional status of the animal to cells deep in the crypt.

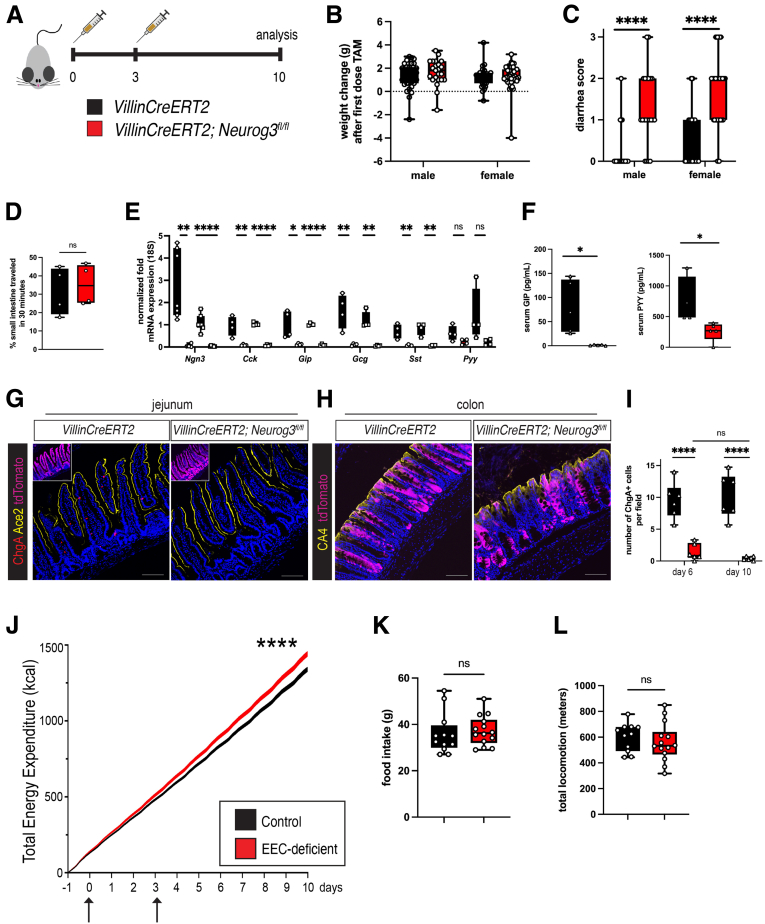
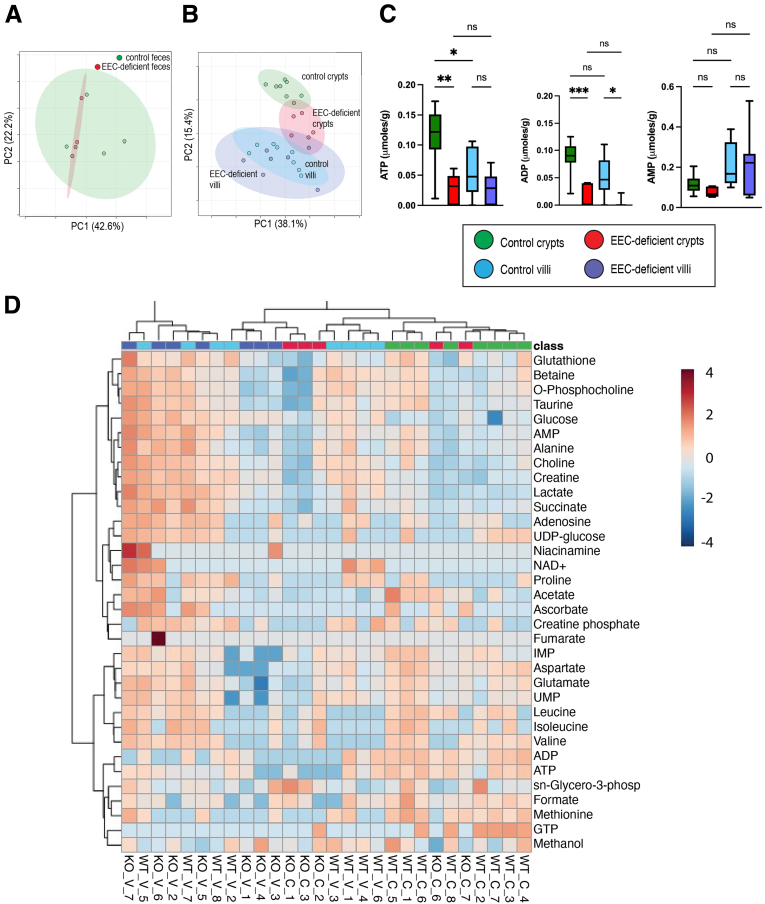
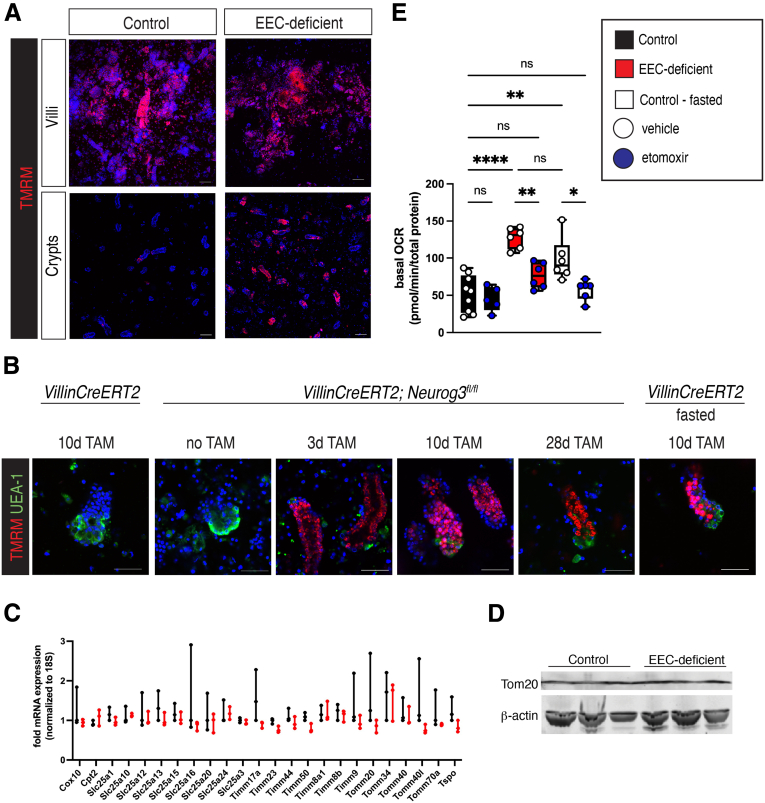
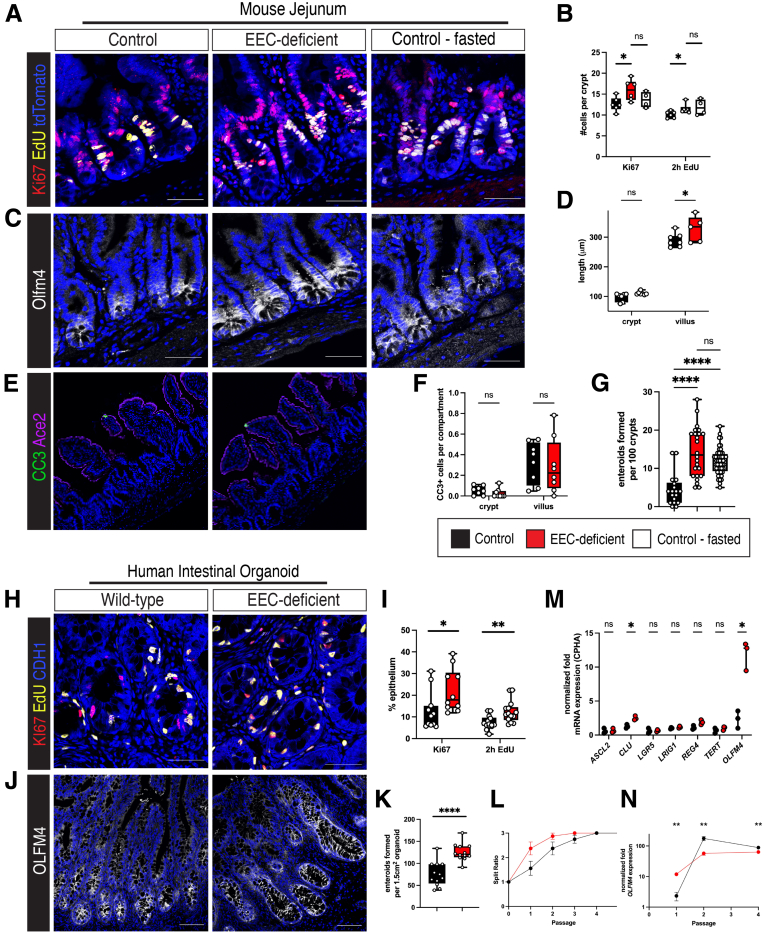
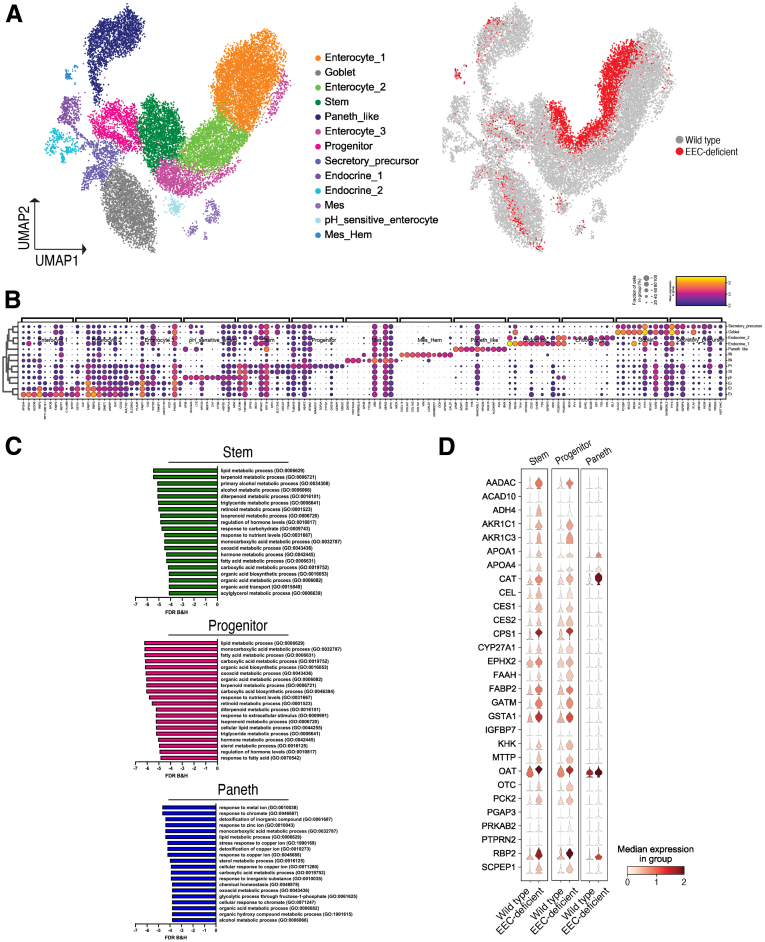
Methods: We used the tamoxifen-inducible VillinCreERT2 mouse model to deplete EECs (Neurog3fl/fl) from adult intestinal epithelium and we generated human intestinal organoids from wild-type and NEUROGENIN 3 (NEUROG3)-null human pluripotent stem cells. We used indirect calorimetry, 1H-Nuclear Magnetic Resonance (NMR) metabolomics, mitochondrial live imaging, and the Seahorse bioanalyzer (Agilent Technologies) to assess metabolism. Intestinal stem cell activity was measured by proliferation and enteroid-forming capacity. Transcriptional changes were assessed using 10x Genomics single-cell sequencing.

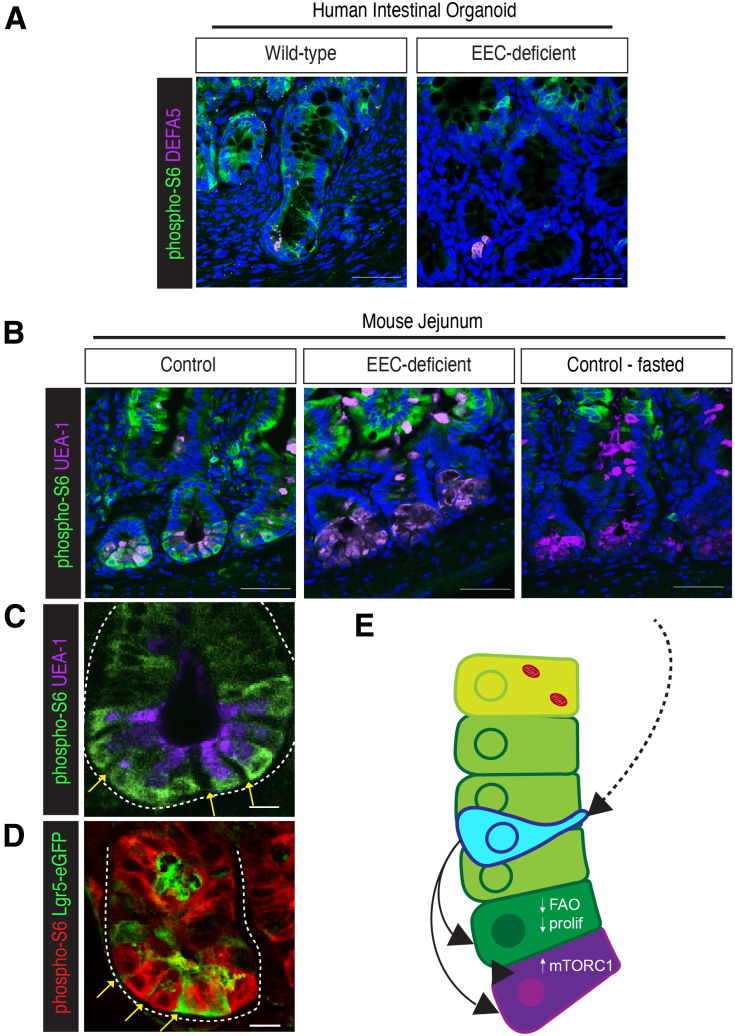
Results: Loss of EECs resulted in increased energy expenditure in mice, an abundance of active mitochondria, and a shift of crypt metabolism to fatty acid oxidation. Crypts from mouse and human intestinal organoids lacking EECs displayed increased intestinal stem cell activity and failed to activate phosphorylation of downstream target S6 kinase ribosomal protein, a marker for activity of the master metabolic regulator mammalian target of rapamycin (mTOR). These phenotypes were similar to those observed when control mice were deprived of nutrients.

Conclusions: EECs are essential regulators of crypt metabolism. Depletion of EECs recapitulated a fasting metabolic phenotype despite normal levels of ingested nutrients. These data suggest that EECs are required to relay nutritional information to the stem cell niche and are essential regulators of intestinal metabolism.

Keywords: Enteroendocrine Cells; Intestinal Metabolism; Intestinal Stem Cell; Mitochondria.


Figures

None
Graphical abstract
Figure 1
Figure 1
EECs are required to maintain whole-body metabolism. (A) Schematic of tamoxifen (TAM) dosing strategy. Mice aged 8 weeks or older were administered 2 doses of tamoxifen (25 mg/kg) 3 days apart. Animals were harvested 10 days after the initial dose to evaluate loss of EECs. Age-matched, nonlittermate VillinCreERT2 mice were used as controls. Some animals also carried the Ai9 Rosa26-flox-STOP-flox-tdTomato reporter allele to evaluate the efficiency of recombination. (B) Body weight of animals dosed with tamoxifen. Statistical significance was determined by 2-way analysis of variance. n = 31 control females, 35 control males, 39 experimental females, and 23 experimental males. (C) Diarrhea score of VillinCreERT2;Neurog3fl/fl animals (red bars) compared with VillinCreERT2 control animals (black bars) dosed with tamoxifen (male, ∗∗∗∗P < .0001; female, ∗∗∗∗P < .0001). Notably, many VillinCreERT2 control animals showed mild diarrhea 10 days after tamoxifen treatment. Statistical significance was determined by 2-way analysis of variance. n = 31 control females, 35 control males, 39 experimental females, and 23 experimental males. (D) Transit time of control VillinCreERT2 and VillinCreERT2;Neurog3fl/fl animals. Statistical significance was determined by unpaired t test. n = 4 animals per genotype. (E) Jejunum of VillinCreERT2 and VillinCreERT2;Neurog3fl/fl animals were harvested 6 days after initial tamoxifen treatment, separated into crypt (circles) and villus (squares) compartments, and analyzed for expression of enteroendocrine-specific genes by quantitative PCR. Ngn3 (crypt, ∗∗P = .001405; villus, ∗∗∗∗P = .000029), Cck (crypt, ∗∗P = .007638; villus, ∗∗∗∗P < .000001), Gip (crypt, ∗P = .02405; villus, ∗∗∗∗P < .000001), Gcg (crypt, ∗∗P = .007729; villus, ∗∗P = .001133), Sst (crypt, ∗∗P = .008389; villus, ∗∗P = .001345), and Pyy (crypt, P = .071144; villus, P = .099997). Statistical significance was determined using the Holm–Sidak method. n = 4–7 samples per compartment per genotype. (F) Serum levels of GIP and PYY 10 days after tamoxifen administration (GIP, P = .0114; PYY, ∗P = .0141). Statistical significance was determined using 1-way analysis of variance with the Tukey multiple comparison test. n = 5 mice per genotype. (G) Immunofluorescence staining for Chromogranin A (ChgA) in VillinCreERT2;Neurog3fl/fl;tdTomato and VillinCreERT2;tdTomato control jejunum 6 days after tamoxifen administration. Ace2 marks the brush border. Scale bars: 100 mm. (H) tdTomato expression in the colon of control VillinCreERT2;tdTomato and VillinCreERT2;Neurog3fl/fl;tdTomato animals 10 days after tamoxifen administration. Carbonic anhydrase 4 (CA4) marks the surface epithelial cells of colonocytes. Scale bars: 100 mm. (I) Quantification of the representative image shown in panel F (day 6, ∗∗∗∗P < .0001; day 10, ∗∗∗∗P < .0001; no difference between days 6 and 10). n = 6 mice per genotype per time point. Statistical significance was determined using 2-way analysis of variance with the Tukey multiple comparison test. (J) Total energy expenditure over time was measured by whole-body respirometry. Arrows indicate tamoxifen injections. n = 12 control, n = 14 EEC-deficient mice. ∗∗∗∗P < .0001; statistical significance was determined using simple linear regression. (K) Total food eaten by control and EEC-deficient animals as measured by metabolic cages. n = 12 controls, n = 14 EEC-deficient mice. (L) Total activity performed by control and EEC-deficient animals as measured by metabolic cages. n = 12 controls, n = 14 EEC-deficient mice. GIP, glucose-dependent insulinotropic polypeptide; mRNA, messenger RNA; PYY, peptide YY.
Figure 2
Figure 2
EECs are required to maintain intestinal metabolism along the crypt–villus axis. (A) Principal component (PC) analysis score plot of 1H-NMR metabolomics data, PC1 (42.6% expected value (EV)) and PC2 (22.2% EV), indicating no significant difference in metabolic profiles in feces isolated from control and EEC-deficient animals. Green, control animals (n = 4); red, EEC-deficient animals (n = 4). (B) PCA score plot of 1H-NMR metabolomics data, PC1 (38.1% EV) and PC2 (15.4% EV), indicating the presence of unique metabolic profiles in crypts and villi from control and EEC-deficient animals. Green, control crypt (n = 8); red, EEC-deficient crypt (n = 5); light blue, control villi (n = 8); and purple, EEC-deficient villi (n = 7). (C) Normalized concentrations of ATP and ADP per gram of tissue. Significance was calculated by 1-way analysis of variance with the Tukey multiple comparison test. ATP, ∗P = .0231, ∗∗P = .0029, ∗∗P = .0019; and ADP, ∗P = .0113, ∗∗∗P = .0006, ∗∗∗∗P < .00001. (D) Ward Euclidean hierarchical clustering heatmap depicting the 34 metabolites identified by 1H-NMR metabolomics across the control and EEC-deficient crypt (C) and villus (V) samples. AMP, adenosine monophosphate; ADP, adenosine diphosphate; ATP, adenosine triphosphate; GTP, guanine triphosplate; IMP, inosine monophosphate; NAD, nicotinamide adenine dinucleotide; UDP, uridine diphosphate; UMP, uridine monophosphate.
Figure 3
Figure 3
EECs regulate mitochondrial activity in intestinal crypts. (A) Crypts and villi were separated from jejunum of control and EEC-deficient animals and incubated in TMRM and Hoechst to visualize active mitochondria via live confocal microscopy. Scale bars: 10 mm. Images shown are representative of 11 experiments. (B) High magnification of crypts from representative control mice, VillinCreERT2;Neurog3fl/fl mice without tamoxifen (n = 2), 3 days after tamoxifen (n = 2), 10 days after tamoxifen (n = 11), 28 days after tamoxifen (n = 2), and control mice after a 16-hour overnight fast (n = 4). Paneth cells are labeled with Ulex europaeus Agglutinin 1 (UEA-1). Scale bars: 50 mm. (C) TaqMan array for genes encoding inner- and outer-mitochondrial membrane proteins in control and EEC-deficient crypts. n = 3 animals per genotype. (D) Crypt cells were probed for mitochondrial membrane protein Tom20 by Western blot. β-actin was used as a loading control. n = 3 animals per genotype. (E) Crypts of control and EEC-deficient animals were plated for Seahorse analysis of mitochondrial activity. Basal oxygen consumption of control and EEC-deficient crypts, with and without the fatty acid oxidation inhibitor etomoxir (∗∗∗∗P= .00001, control vs EEC-deficient; ∗P = .018, control vs control-fasted; and ∗∗P = .005, EEC-deficient v EEC-deficient + etomoxir). Statistics calculated using 1-way analysis of variance with the Tukey multiple comparison test. Error bars represent the SEM. Each experiment was conducted on at least 7 replicates of 500 crypts per well. N = 5–9 experiments per condition. mRNA, messenger RNA; TAM, tamoxifen.
Figure 4
Figure 4
EECs regulate intestinal stemcelland progenitor activity. (A) Immunofluorescence staining for Ki67 and 5-ethynyl-2'-deoxyuridine (EdU) (2-hour pulse) in control, EEC-deficient, and fasted control mouse jejunal crypts. 4′,6-Diamidino-2-phenylindole (DAPI) counterstains nuclei in blue. Scale bars: 50 mm. (B) Quantification of proliferation in panel A. ∗P = .02, Ki67; ∗P = .04, EdU. Statistics were calculated using an unpaired t test with the 2-stage step-up (Benjamini, Krieger, and Yekutiele method). N = 6 mice per genotype. (C) Immunofluorescence staining for Olfactomedin-4 (Olfm4) in control, EEC-deficient, and fasted control mouse jejunal crypts. DAPI counterstained nuclei is shown in blue. Scale bars: 50 mm. Representative images shown from 6 mice per genotype. (D) Quantification of crypt depth and villus height in control and EEC-deficient jejunum. Statistics were calculated by 2-way analysis of variance with the Sidak multiple comparison test. ∗P = .028. n = 7 animals per genotype. (E) Immunofluorescence staining for cleaved caspase-3 (CC3) in control and EEC-deficient small intestine. Angiotensin converting enzyme 2 (Ace2) marks the brush border and DAPI counterstained nuclei. Scalebars: 50 mm. Representative image of 8 mice per genotype. (F) Quantification of panel E. Three well-oriented images per mouse were averaged and the number of cleaved caspase-3–positive cells per number of crypts and villi per image is represented. n = 8 mice per genotype. (G) Enteroid forming capacity of control, EEC-deficient, and fasted control mouse jejunal crypts (∗∗∗∗P < .0001). n = 18 wells from 3 control mice, 24 wells from 4 EEC-deficient mice, and 48 wells from 4 fasted control mice. Statistics were calculated using ordinary 1-way analysis of variance with the Tukey multiple comparison test. (H) Immunofluorescence staining for Ki67 and EdU (2-hour pulse) in wild-type and EEC-deficient human intestinal organoids (HIO). DAPI counterstained nuclei in blue. Scale bars: 50 mm. (I) Quantification of proliferation in panel H. ∗P = .032, Ki67; ∗∗P = .007, EdU. Statistics were calculated using an unpaired t test with the Holm–Sidak method. N = 11–14 organoids. (J) Immunofluorescence staining for OLFM4 in wild-type and EEC-deficient human intestinal organoids. DAPI counterstained nuclei in blue. Scale bars: 20 mm. Representative images shown from 5 organoids per genotype. (K) Enteroid forming capacity of wild-type and EEC-deficient human intestinal organoid crypts (∗∗∗∗P < .0001). n = 12 wells from 2 independent organoids per genotype. Statistics were calculated using an unpaired 2-tailed t test. (L) Visualization of HIO-derived enteroid growth as depicted by split ratios at each passage. The slope of the curves was significantly (∗P = .03) different from passage 0 to passage 2. Statistical significance was determined by simple linear regression. n = 3–4 independent enteroid lines per genotype. (M) Normalized (to cyclophilin, CPHA) messenger RNA (mRNA) expression for a selection of intestinal stem cell genes at first passage of enteroids derived from wild-type and EEC-deficient human intestinal organoids. Statistics were calculated by an unpaired 2-tailed t test. n = 3 independent enteroid lines per genotype. (N) Quantitative PCR (qPCR) depicting normalized mRNA expression for OLFM4 in HIO-derived enteroids collected at passages 1, 2, and 4. Statistics were calculated by an unpaired 2-tailed t test. n = 3–4 independent enteroid lines per genotype.
Figure 5
Figure 5
Without EECs, intestinal stem and progenitor cells up-regulate lipid metabolism genes. (A) Transplanted human intestinal organoids were dissociated into single cells and sequenced using the 10x Genomics platform (n = 3 wild-type, n = 1 EEC-deficient). Uniform manifold approximation and projection (UMAP) depicting the integrated data set of all cells colored by cluster (left) and colored by genotype (right). (B) Dot plot depicting the expression of the top 10 genes in each cell cluster in the integrated data set. (C) Gene Ontology analysis of the differentially expressed genes in EEC-deficient stem (top, green), progenitor (middle, pink), and Paneth-like (bottom, blue) cell clusters. The top 20 biological processes are displayed. (D) Violin plots for a selection of genes represented in GO:0006629, lipid metabolic process, in the stem, progenitor, and Paneth-like cell clusters in wild-type and EEC-deficient human intestinal organoids. B&H, Benjamini and Hochberg; FDR, false discovery rate.
Figure 6
Figure 6
Without EECs, intestinal stem and progenitor cells down-regulate master nutrient sensor mTORC1 in Paneth cells. (A) Immunofluorescence staining for phospho-S6 in crypts of wild-type and EEC-deficient human intestinal organoids. Defensin A5 (DEFA5) marks Paneth cells. 4′,6-Diamidino-2-phenylindole (DAPI) counterstained nuclei in blue. Scale bar: 50 mm. Representative image of 5 organoids per genotype. (B) Immunofluorescence staining for phospho-S6 in small intestinal crypts of control, EEC-deficient, and fasted control mice. Ulex europaeus Agglutinin 1 (UEA-1) marks Paneth cells. DAPI counterstained nuclei in blue. Scale bar: 50 mm. Representative image of 6 control, 6 EEC-deficient, and 3 fasted control mice. (C) Higher magnification of crypt of control mouse in panel B. Arrows point to areas negative for phospho-S6 staining between Paneth cells. (D) Immunofluorescence staining for phospho-S6 in small intestinal crypts of Lgr5-eGFP-CreERT2 reporter mice. Arrows point to (eGFP)+ crypt–base columnar cells negative for phospho-S6 staining. Scale bar: 10 mm. Representative image of 3 mice. (E) Model depicting EEC regulation of crypt homeostasis and metabolism in response to nutrients (dashedarrow). In the fed condition, EECs (blue) activate mTORC1 signaling in Paneth cells (purple) and restrict intestinal stem cell activity, proliferation, and fatty acid oxidation (FAO) (dark green) (solid arrows). As progenitors (light green) move toward the villus and differentiate into absorptive enterocytes (light yellow), mitochondria undergoing FAO become abundant. eGFP, enhanced green fluorescent protein; prolif, proliferation.

Comment in

References

    1. Duée P.-H., Darcy-Vrillon B., Blachier F., Morel M.-T. Fuel selection in intestinal cells. Proc Nutr Soc. 1995;54:83–94. - PubMed
    1. Beumer J., Clevers H. Cell fate specification and differentiation in the adult mammalian intestine. Nat Rev Mol Cell Biol. 2021;22:39–53. - PubMed
    1. Gribble F.M., Reimann F. Enteroendocrine cells: chemosensors in the intestinal epithelium. Annu Rev Physiol. 2016;78:277–299. - PubMed
    1. Lu V.B., Rievaj J., O’Flaherty E.A., et al. Adenosine triphosphate is co-secreted with glucagon-like peptide-1 to modulate intestinal enterocytes and afferent neurons. Nat Commun. 2019;10:1029. - PMC - PubMed
    1. Wang J., Cortina G., Wu S.V., et al. Mutant neurogenin-3 in congenital malabsorptive diarrhea. N Engl J Med. 2006;355:270–280. - PubMed

Publication types