

Perceptions of Water Safety and Tap Water Taste and Their Associations With Beverage Intake Among U.S. Adults
- PMID: 36609168
- PMCID: PMC10239313
- DOI: 10.1177/08901171221150093
Perceptions of Water Safety and Tap Water Taste and Their Associations With Beverage Intake Among U.S. Adults
Abstract
Objectives: Examine differences in perceptions of tap water (TW) and bottled water (BW) safety and TW taste and their associations with plain water (PW) and sugar-sweetened beverage (SSB) intake.
Design: Quantitative, cross-sectional study.
Setting: United States.
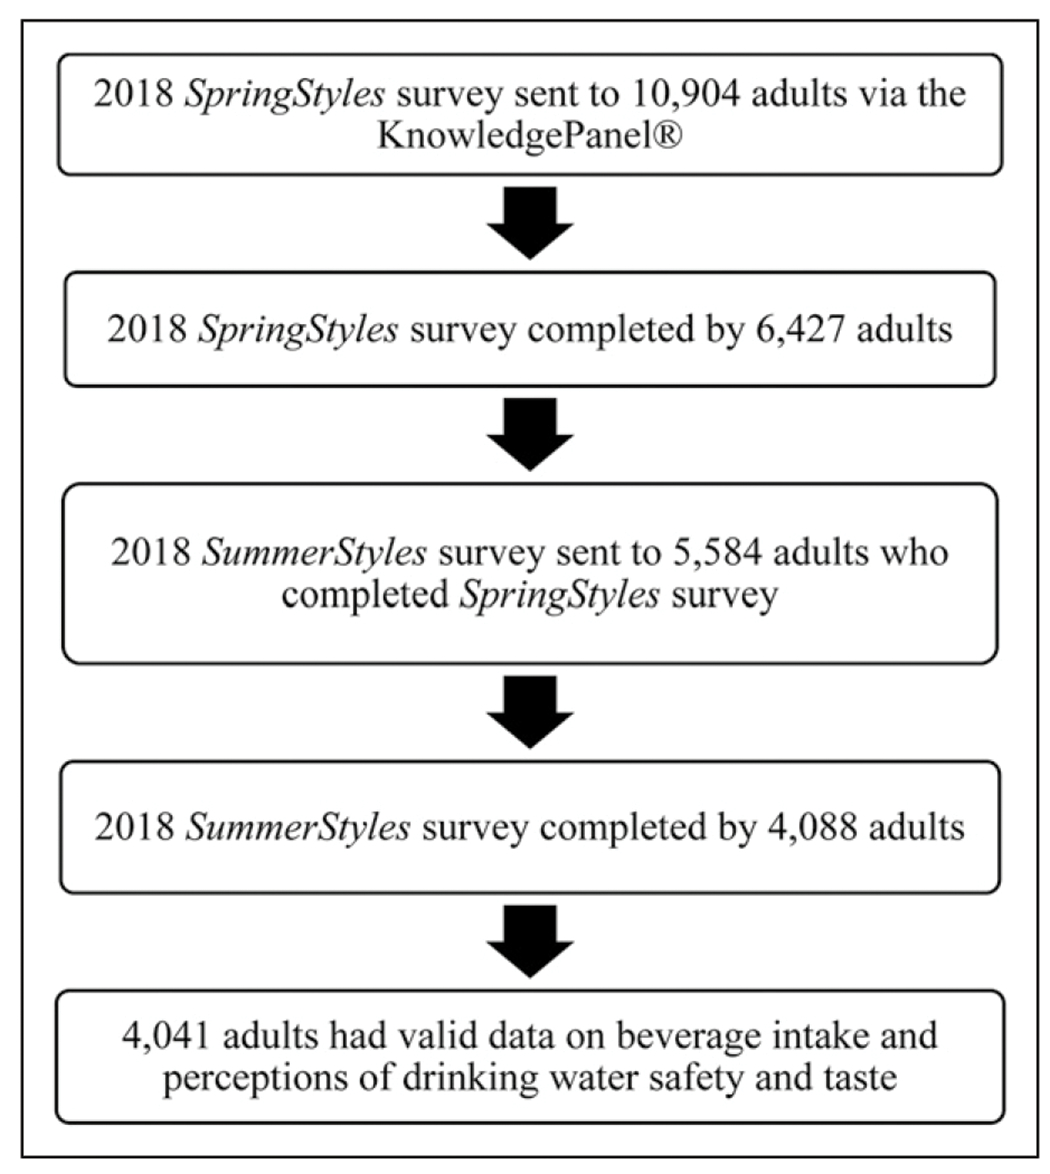
Subjects: 4,041 U.S. adults (≥18 years) in the 2018 SummerStyles survey data.
Measures: Outcomes were intake of TW, BW, PW (tap and bottled water), and SSB. Exposures were perceptions of TW and BW safety and TW taste (disagree, neutral, or agree). Covariates included sociodemographics.
Analysis: We used chi-square analysis to examine sociodemographic differences in perceptions and multivariable logistic regressions to estimate adjusted odds ratios (AOR) for consuming TW ≤ 1 cup/day, BW > 1 cup/day, PW ≤ 3 cups/day, and SSB ≥ 1 time/day by water perceptions.
Results: One in 7 (15.1%) of adults did not think their home TW was safe to drink, 39.0% thought BW was safer than TW, and 25.9% did not think their local TW tasted good. Adults who did not think local TW was safe to drink had higher odds of drinking TW ≤ 1 cup/day (AOR = 3.12) and BW >1 cup/day (AOR = 2.69). Adults who thought BW was safer than TW had higher odds of drinking TW ≤1 cup/day (AOR = 2.38), BW > 1 cup/day (AOR = 5.80), and SSB ≥ 1 time/day (AOR = 1.39). Adults who did not think TW tasted good had higher odds of drinking TW ≤ 1 cup/day (AOR = 4.39) and BW > 1 cup/day (AOR = 2.91).
Conclusions: Negative perceptions of TW safety and taste and a belief BW is safer than TW were common and associated with low TW intake. Perceiving BW is safer than TW increased the likelihood of daily SSB intake. These findings can guide programs and services to support water quality to improve perceptions of TW safety and taste, which might increase TW intake and decrease SSB intake.
Keywords: bottled water; characteristics; plain water; sociodemographic; sugar-sweetened beverages; tap water; water perception.
Conflict of interest statement
Declaration of Conflicting Interests
The author(s) declared no potential conflicts of interest with respect to the research, authorship, and/or publication of this article.
Figures
Similar articles
-
Factors Related to Water Filter Use for Drinking Tap Water at Home and Its Association With Consuming Plain Water and Sugar-Sweetened Beverages Among U.S. Adults.Am J Health Promot. 2022 Jun;36(5):813-822. doi: 10.1177/08901171211073304. Epub 2022 Mar 2. Am J Health Promot. 2022. PMID: 35081754 Free PMC article.
-
The relationship of perceptions of tap water safety with intake of sugar-sweetened beverages and plain water among US adults.Public Health Nutr. 2014 Jan;17(1):179-85. doi: 10.1017/S1368980012004600. Epub 2012 Oct 26. Public Health Nutr. 2014. PMID: 23098620 Free PMC article.
-
Perceptions of drinking water safety and their associations with plain water intake among US Hispanic adults.J Water Health. 2019 Aug;17(4):587-596. doi: 10.2166/wh.2019.015. J Water Health. 2019. PMID: 31313996 Free PMC article.
-
Tap Water Consumption and Perceptions in United States Latinx Adults.Nutrients. 2021 Aug 28;13(9):2999. doi: 10.3390/nu13092999. Nutrients. 2021. PMID: 34578876 Free PMC article. Review.
-
Beverage Consumption and Growth, Size, Body Composition, and Risk of Overweight and Obesity: A Systematic Review [Internet].Alexandria (VA): USDA Nutrition Evidence Systematic Review; 2020 Jul. Alexandria (VA): USDA Nutrition Evidence Systematic Review; 2020 Jul. PMID: 35349233 Free Books & Documents. Review.
Cited by
-
Apparently healthy young black adults report lower total fluid intake and exhibit higher plasma copeptin than young White adults.Nutr Res. 2025 Apr;136:81-93. doi: 10.1016/j.nutres.2025.02.007. Epub 2025 Mar 6. Nutr Res. 2025. PMID: 40157008
-
Food inequity and insecurity and MASLD: burden, challenges, and interventions.Nat Rev Gastroenterol Hepatol. 2024 Oct;21(10):668-686. doi: 10.1038/s41575-024-00959-4. Epub 2024 Jul 29. Nat Rev Gastroenterol Hepatol. 2024. PMID: 39075288 Review.
-
Sustainable HEalthy Diet practices: a cross-sectional analysis of an adult Greek sample.Nutr J. 2025 Feb 26;24(1):32. doi: 10.1186/s12937-025-01096-7. Nutr J. 2025. PMID: 40012074 Free PMC article.
-
The effect of water filter pitchers on the mineral concentration of tap water.J Public Health Dent. 2025 Mar;85(1):21-28. doi: 10.1111/jphd.12649. Epub 2024 Nov 6. J Public Health Dent. 2025. PMID: 39505386 Free PMC article.
References
-
- Hernández-Cordero S, Barquera S, Rodríguez-Ramírez S, et al. Substituting water for sugar-sweetened beverages reduces circulating triglycerides and the prevalence of metabolic syndrome in obese but not in overweight Mexican women in a randomized controlled trial. J Nutr. 2014;144(11):1742–1752. - PMC - PubMed
-
- An R, McCaffrey J. Plain water consumption in relation to energy intake and diet quality among US adults, 2005-2012. J Hum Nutr Diet. 2016;29(5):624–632. - PubMed
-
- U.S. Department of Agriculture U.S. Department of Health and Human Services. Dietary Guidelines for Americans, 2020-2025. 9th Edition; 2020. https://www.dietaryguidelines.gov/sites/default/files/2020-12/Dietary_Gu....
-
- Bowman SA, Clemens JC, Friday JE, LaComb RP, Paudel D, Shimizu M, Added sugars in adults’ diet: what we eat in America, NHANES 2015-2016. Food Surveys Research Group. Dietary Data Brief No 24; 2019.
MeSH terms
Substances
Grants and funding
LinkOut - more resources
Full Text Sources
Medical
Miscellaneous
