Review
. 2024 Oct;37(5):531-545.
doi: 10.1177/19714009221150848. Epub 2023 Jan 7.

Fat in the brain: Facts and features

Affiliations
Review

Fat in the brain: Facts and features

Sunitha Palasamudram Kumaran et al. Neuroradiol J. 2024 Oct.

Abstract

The presence of fat within a lesion in the brain is not only easy to identify on both CT/MRI but also can help narrow the differential. The purpose of this paper is to illustrate the spectrum of common and rare fat-containing lesions in the brain that are encountered in clinical practice. This paper intends to discuss 15 such lesions which are confirmed by MRI findings and histopathological correlation. We divided the spectrum of fat-containing lesions into lesions with adipose cells, lesions with cholesterol-rich content and tumours with lipomatous differentiation/transformation. Knowledge of these common and rare fat-containing lesions is essential for making the right diagnosis or narrowing the differential diagnosis.

Keywords: CT; Fat; MRI; MRS; adipose; brain; cholesterol; lipid.


Conflict of interest statement

Declaration of conflicting interestsThe author(s) declared no potential conflicts of interest with respect to the research, authorship, and/or publication of this article.

Figures
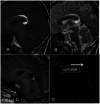
Figure 1.
Figure 1.
(a and b): Pericallosal lipoma (1A) – Curvilinear hyperintense lesion on sagittal T1, T2 images (a, b) along the posterior peri callosal region, involving splenium demonstrating suppression on fat sat images (c) with lipid peak on MRS (d).
Figure 2.
Figure 2.
Interhemispheric lipoma with cortical dysplasia (1B): Hyperintense lesion. On axial T1, T2 images (a, b) along the right interhemispheric fissure (large arrow). Showing suppression on fat sat images. There is also an adjacent thickened right. Frontal cortex (small arrow) suggestive of cortical dysplasia.
Figure 3.
Figure 3.
Encephalo craniocutaneous lipomatosis (ECCL) clinical picture (a) of. Patient (taken with permission to publish) showing focal alopecia (arrow), hypertrophy of bulbar conjunctiva of left eye with a soft limbal nodule encroaching. On the cornea (small arrow) and soft skin-coloured papules in the left perioral and. Periorbital area (arrowheads). Axial T1 and T2W images (b–f) show a left temporal arachnoid cyst (block arrow on c), left cerebellopontine angle lipomas (not shown in the figure) with incomplete opercularization adjacent to left Sylvian fissure (small arrow on f), dilated occipital horn of left lateral ventricle (arrowhead on e) and dural lipomatosis seen involving left frontoparietal convexity (arrows on b, d and e).
Figure 4.
Figure 4.
Ruptured intracranial dermoid. Axial T1W image showing hyperintensities disseminated in bilateral subarachnoid spaces (a), suppressed on fat sat image post-contrast Axial T1W image (b) (arrows). Predominantly hyperintense lesion (arrows) on axial T2W (c) and axial T1W (d) images in the frontal location which is further suppressed on axial T1 fat-sat image (e) (arrow). Histopathological examination (f) shows a cyst lined by stratified squamous epithelium shows cholesterol clefts with foci of calcification.
Figure 5.
Figure 5.
Immature teratoma in the posterior third ventricle. Sagittal T1W and T2W images (a and b) demonstrate a cystic lesion in the location of the posterior third ventricle with curvilinear peripheral hyperintensity and show susceptibility. Artefact on axial gradient images (arrow on c) suggestive of fat. Histopathological examination (d) shows adipocytic tissue admixed with few intestinal glands having goblet cells.
Figure 6.
Figure 6.
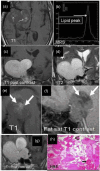
Suprasellar angiolipoma. Axial T1W image shows an isointense lesion in the sellar and right parasellar region (a) with few hyperintensities (arrows). MRS (b) shows the lipid peak at 1.2 ppm (arrow). Coronal post-contrast T1W image (c) demonstrates homogenous enhancement with contrast. Coronal T2W image (d) shows hyperintensity within the lesion. Magnified sagittal T1 and post-contrast fat-suppressed T1 image (e, f) showing suppressed areas of fat (arrows) within the lesion. (g) Post-contrast T1W coronal image demonstrates persistent enhancement with contrast. Histopathological image (h) confirms the diagnosis of angiolipoma.
Figure 7.
Figure 7.
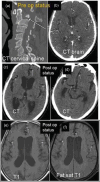
Dissemination of fat in post-operative status. Sagittal CT of the cervical spine (a) in a patient with trauma shows type III odontoid fracture with left pars interarticularis fracture, grade III listhesis of C2 over C3 vertebra. (b) CT angio was unremarkable. The patient underwent surgery including C3 corpectomy with grafting and C2-4 screw plate fixation and C1 to C5 fusion. Post-op day 10, the patient became unresponsive and axial CT brain images (c, d) demonstrating multiple foci of hypo densities (arrows) were noted in subarachnoid spaces. Repeat MRI axial T1W image (e) shows hyperintense foci in the subarachnoid spaces (arrows) that are suppressed on axial fat sat T1 image (f) confirming fat as a result of marrow fat mobilization due to increased intramedullary pressure secondary to surgical fixation of fractures.
Figure 8.
Figure 8.
Epidermoid cyst in the right medulla and peri medullary cistern. Axial T1W (a) and T2W (b) images show an intramedullary lesion extending to the premedullary cistern. Post-contrast sagittal T1 (c) image shows no enhancement of the lesion. Axial diffusion and ADC images (d and e) reveal restricted diffusion in the posterior component of the lesion. The posterior aspect of the lesion is hypo. Intense on T1 and hyperintense on T2 images and correlates with the appearance of a usual epidermoid cyst which restricts diffusion (black epidermoid). The anterior aspect of the lesion is hyperintense on T1 and hypointense on T2W images and shows no restriction of diffusion and corresponds to ‘white epidermoid’ which is rare in occurrence. The existence of both varieties (usual ‘black’ and rarer ‘white’ epidermoid) in a single lesion is an infrequent finding in imaging. Histopathological examination (f) shows concentric lamellae of anucleate keratin.
Figure 9.
Figure 9.
Suprasellar craniopharyngioma. Sagittal T1W and coronal T2W images (a and b) show solid cystic lesions (pink block arrows) where the cyst is hyperintense on T1, T2 images (cholesterol-rich contents) in the suprasellar region extending into the left temporal region with lipid peak (blue arrow at 1.2 ppm) on MRS (c). Fat-suppressed post-contrast sagittal T1 image (d) shows mild suppression of the T1 hyperintense cystic contents with the enhancement of solid components and rim enhancement of the cyst. Histopathological examination (e) demonstrates cholesterol crystals, consistent with the imaging diagnosis.
Figure 10.
Figure 10.
Atypical intracranial dermoid in left cerebellum. Axial T1W, T2W and post-contrast T1W MRI (a–c) showed a non-enhancing lesion in the left cerebellum. The lesion is predominantly hypointense on T1 and homogenously hypointense on T2 with peripheral mural nodule which shows a heterogeneous signal. Diffusion and ADC images (d and e) show no restricted diffusion within the lesion. Axial non-contrast CT image (f) shows a homogeneously hyperdense lesion (large arrow) with peripheral areas of calcification (small arrow) and fat density (curved arrow). In correlation with CT, the hyperintense signal in the peripheral mural nodule on T1 and T2 images (short arrows on a, b) correspond to fat. Histopathological study (g) shows keratinized stratified squamous epithelium with proliferating sebaceous gland (arrow).
Figure 11.
Figure 11.
Cholesterol granuloma. Axial T1W image shows a homogenously hyperintense lesion along the right petrous apex (arrow in a) with no restricted diffusion on B1000 image (b). Location with imaging characteristics (hyperintense on T2 with no restriction on diffusion images) confirmed the diagnosis. As the patient was not symptomatic for this lesion, this was not operated and was periodically followed-up.
Figure 12.
Figure 12.
Asymmetrical pneumatization with fatty marrow signal (normal variant). There is evidence of asymmetrical pneumatization. In the left petrous apex on non-contrast CT (arrow in a) as compared to the right side. The corresponding area shows fatty marrow signal with T1 hyperintensity (arrow in b) that is further suppressed on post-contrast fat saturation T1 sequence (arrow in c).
Figure 13.
Figure 13.
Meningeal lipohamartoma of scalp. Sagittal T1W and coronal T2W images (a and b) showing a lesion in the right parietal scalp with fat component (large arrows) visualized as a hyperintense signal on T1 and T2. Axial T1 and post-contrast fat-suppressed T1W image (c and d) demonstrate the suppressed fat on fat-sat images and enhancing soft tissue component in the centre of the lesion (small arrows). Histopathological evaluation (e, f, and g) suggests predominant adipose tissue with a minor component of meningioma. The meningioma component showed EMA IHC positivity and adipose tissue showed S-100 positivity.
Figure 14.
Figure 14.
Grade I lipomatous meningioma. Axial T1W and T2W images (a and b) show a heterogeneous dural-based lesion along left frontal convexity. Post contrast coronal T1W image (c) reveals heterogeneous enhancement with a dural tail and a lipid peak at 1.2 ppm (arrow) on MRS (d) suggestive of a subtle fat component on histopathological correlation (e and f) shows meningothelial cells interspersed between the adipocytes. Meningioma component showing EMA IHC highlighting the meningothelial cells.
Figure 15.
Figure 15.
Cerebellar liponeurocytoma. Axial T1W and T2W images (a and b). Demonstrating T1 isointense and T2 hyperintense lesion with central linear hyper. Intensities, which shows susceptibility artefact on axial gradient images (c) and suppress on post-contrast fat sat axial T1 images (d) suggestive of fat. There is a lipid peak on MRS (e). Multiple non-enhancing T2 hyperintense lesions were additionally noted in the cerebellum on coronal T2W images (b). Histopathological examination (f, g, h and i) shows (f) glioneuronal component with focal immunopositivity for glial fibrillary acidic protein (inset), lipomatous areas (straight arrow), (g) microvascular proliferation (curved arrow) with focal strong positivity for synaptophysin in neuronal component (Inset), (h) eosinophilic neuropil-like matrix between the tumour cells and (i) focal oligodendroglia-like areas with a perinuclear halo with MIB-1 labelling index of approximately 6%.
Figure 16.
Figure 16.
Lipoastrocytoma. Axial T1W and T2W images (a and b). Reveal a heterogeneous lesion in the left frontal cortex. Axial post-contrast T1W image (c) shows heterogeneous contrast enhancement. Owing to the cortical location, attempted MRS was non-contributory to the diagnosis. Imaging did not show any evidence of fat within the lesion and the likely diagnosis presumed was a low-grade glioma. Histopathological evaluation (e, f and g) showed a glial neoplasm with a focal perivascular arrangement. Several large clear cells (adipocytes) are admixed amidst the glial cells and immunohistochemistry for glial fibrillary acidic protein and S-100 protein is positive in tumour cells.
Figure 17.
Figure 17.
Glioblastoma with fatty transformation. Axial T1W and T2W images (a and b) demonstrate a left temporal intraaxial cortical lesion, iso on T1 with some T1 hyperintensities (arrows), suppressed on axial gradient fat sat image (c). Coronal post-contrast T1 image (d) shows heterogeneous enhancement and multivoxel MRS (e) centred on the T1 hyperintensities shows a lipid peak at 1.2 ppm (arrow). On histopathological evaluation (f and g): The tumour was composed of cells with moderate cellular and nuclear pleomorphism areas of necrosis, pseudo palisading, glomeruloid vascular proliferation and mitotic activity were noted. There was evidence of focal lipomatous change and a diagnosis of glioblastoma with lipidization was established.

References

    1. Kale HA, Prabhu AV, Sinelnikov A, et al. Fat: friend or foe? a review of fat-containing masses within the head and neck. Br J Radiol 2016; 89(1067): 20150811. - PMC - PubMed
    1. Buyukkaya R, Buyukkaya A, Ozturk B, et al. CT and MR imaging characteristics of intravestibular and cerebellopontine angle lipoma. Iran J Radiol [Internet] 2014; 11(2). [cited 2022 Nov 28]. Available from https://brief.land/iranjradiol/articles/17946.html - PMC - PubMed
    1. Alkhaibary A, Alsubaie N, Alharbi A, et al. Hypothalamic lipoma: outcome of an intracranial developmental lesion. T ttenberg J, editor. Case Rep Surg 2022; 2022: 1–8. - PMC - PubMed
    1. Yildiz H, Hakyemez B, Koroglu M, et al. Intracranial lipomas: importance of localization. Neuroradiology 2006; 48(1): 1–7. - PubMed
    1. Taglialatela G, Galasso R, Conforti R, et al. Lipoma of corpus callosum: case report and literature review. Riv Ital Neurobiol 2008; 54: 221–227.

MeSH terms

LinkOut - more resources