

The impact of social determinants of health on obesity and diabetes disparities among Latino communities in Southern California
- PMID: 36609302
- PMCID: PMC9817265
- DOI: 10.1186/s12889-022-14868-1
The impact of social determinants of health on obesity and diabetes disparities among Latino communities in Southern California
Abstract
Background: Social determinants of health (SDoH) describe the complex network of circumstances that impact an individual before birth and across the lifespan. SDoH contextualize factors in a community that are associated with chronic disease risk and certain health disparities. The main objective of this study was to explore the impact of SDoH on the prevalence of obesity and diabetes, and whether these factors explain disparities in these health outcomes among Latinos in Southern California.
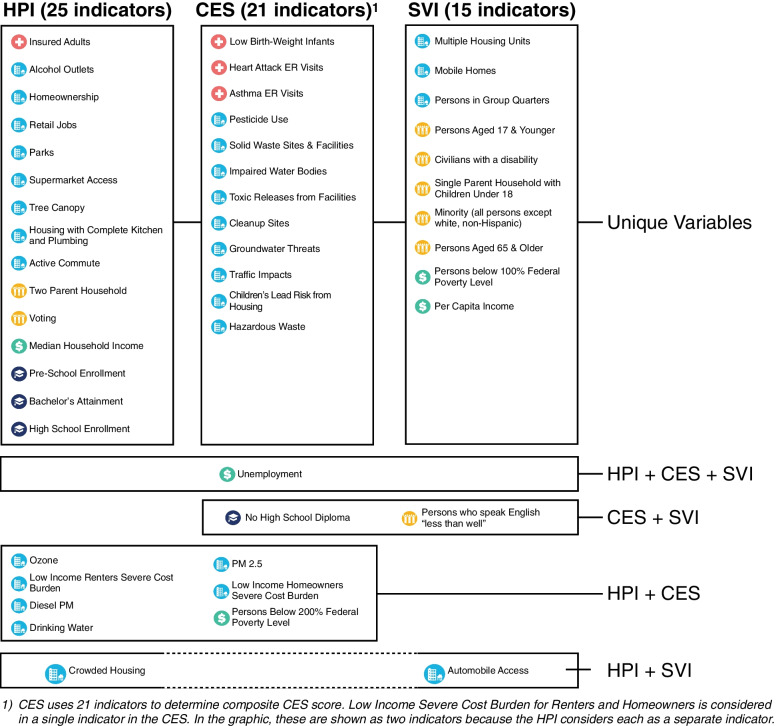
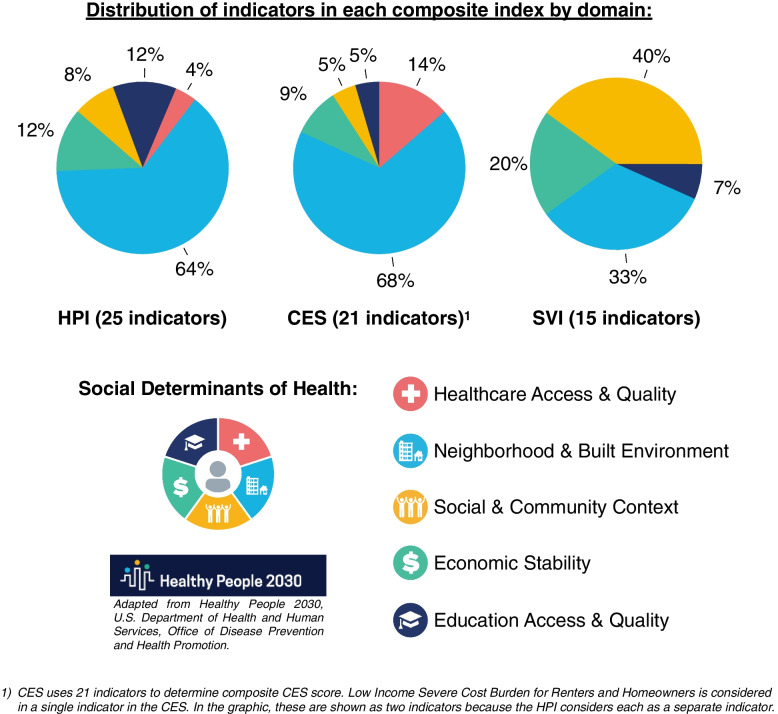
Methods: We utilized three composite indices that encompass different SDoH: the Healthy Places Index (HPI), Social Vulnerability Index (SVI), and CalEnviroScreen (CES). Univariate linear regression models explored the associations between index scores with adult obesity, adult diabetes, and childhood obesity.
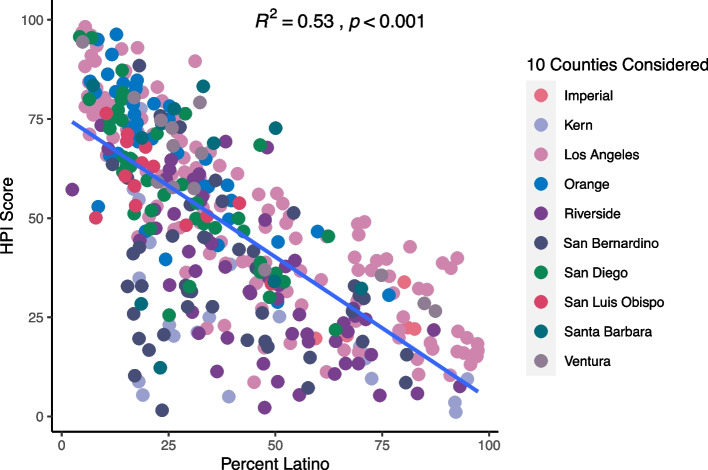
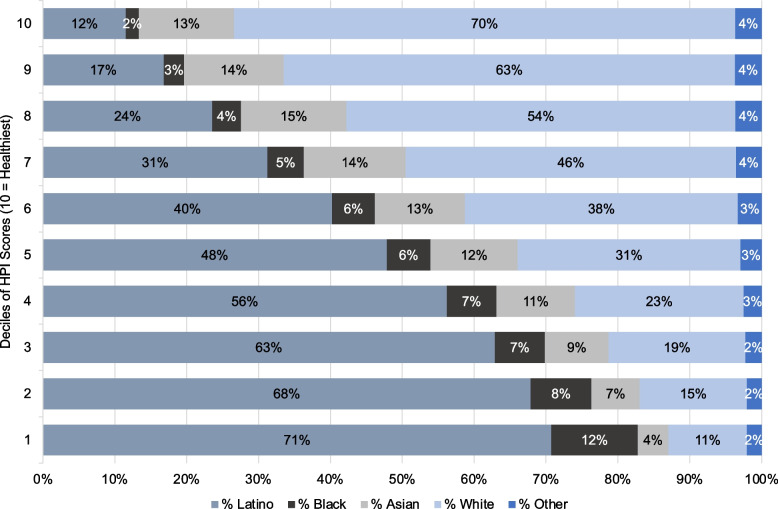
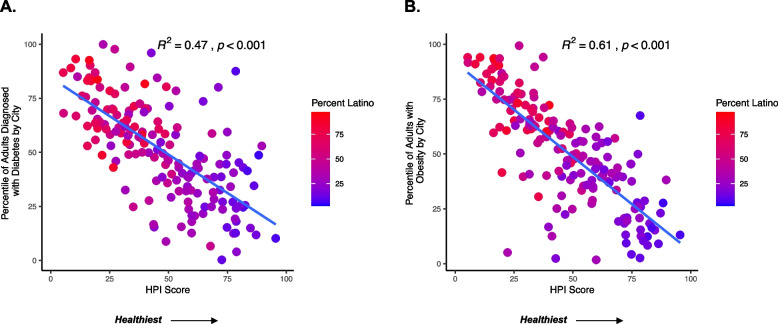
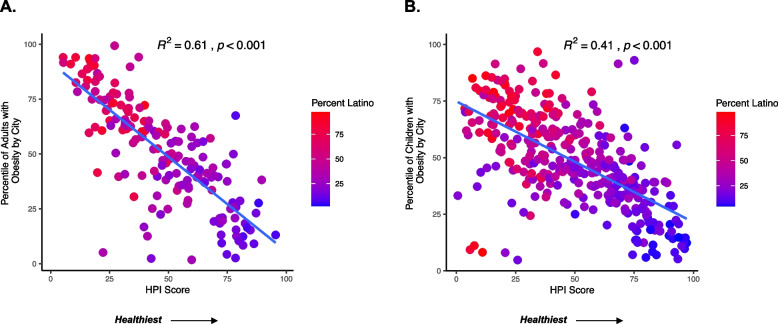
Results: Communities with lower HPI scores were associated with higher prevalence of metabolic disease and a greater proportion of Latino residents. Cities in the lowest decile of HPI scores had 71% of the population identifying as Latino compared to 12% in the highest decile. HPI scores explained 61% of the variability in adult obesity (p < 0.001), 41% of the variability in childhood obesity (p < 0.001), and 47% of the variability in adult diabetes (p < 0.001). Similar results were observed when examining SVI and CES with these health outcomes.
Conclusions: These results suggest that Latinos in Southern California live in communities with adverse SDoH and face a greater burden of adult obesity, diabetes, and childhood obesity.
Keywords: CalEnviroScreen; Childhood Obesity; Healthy Places Index; Latino; Obesity; Social Determinants of Health; Social Vulnerability Index; Type 2 Diabetes.
© 2022. The Author(s).
Conflict of interest statement
Michael I. Goran receives book royalties. Michael I. Goran is a scientific advisor for Yumi. Juan Espinoza is a paid consultant for AI Health. AI Health played no role in the design, execution, analysis, or write up of this work. AI Health did not play a role in the decision to publish this manuscript and had no editorial input. The authors declare no other competing interests.
Figures
Similar articles
-
The association between community-level economic hardship and childhood obesity prevalence in Los Angeles.Pediatr Obes. 2013 Dec;8(6):411-7. doi: 10.1111/j.2047-6310.2012.00123.x. Epub 2012 Dec 13. Pediatr Obes. 2013. PMID: 23239616
-
Development and validation of a community-level social determinants of health index for drug overdose deaths in the HEALing Communities Study.J Subst Use Addict Treat. 2024 Feb;157:209186. doi: 10.1016/j.josat.2023.209186. Epub 2023 Oct 20. J Subst Use Addict Treat. 2024. PMID: 37866438 Free PMC article.
-
Examining neighbourhood-level disparities in Black, Latina/o, Asian, and White physical health, mental health, chronic conditions, and social disadvantage in California.Glob Public Health. 2023 Jan;18(1):2273425. doi: 10.1080/17441692.2023.2273425. Epub 2023 Oct 30. Glob Public Health. 2023. PMID: 37902041
-
Opportunities to Address Obesity Disparities Among High-Risk Latino Children and Adolescents.Curr Obes Rep. 2021 Sep;10(3):332-341. doi: 10.1007/s13679-021-00445-x. Epub 2021 Jul 14. Curr Obes Rep. 2021. PMID: 34263434 Free PMC article. Review.
-
Health Disparities, Inequities, and Social Determinants of Health in Multiple Sclerosis and Related Disorders in the US: A Review.JAMA Neurol. 2021 Dec 1;78(12):1515-1524. doi: 10.1001/jamaneurol.2021.3416. JAMA Neurol. 2021. PMID: 34605866 Review.
Cited by
-
Relationship between social development indicators and mortality due to Diabetes Mellitus in Brazil: a space-time analysis.Rev Lat Am Enfermagem. 2023 Aug 14;31:e3971. doi: 10.1590/1518-8345.6592.3971. eCollection 2023. Rev Lat Am Enfermagem. 2023. PMID: 37586008 Free PMC article.
-
Exploring social vulnerability in National Health Safety Network surgical site infections.Infect Control Hosp Epidemiol. 2025 Mar 26;46(6):1-8. doi: 10.1017/ice.2025.52. Online ahead of print. Infect Control Hosp Epidemiol. 2025. PMID: 40134340 Free PMC article.
-
Associations of Longitudinal BMI-Percentile Classification Patterns in Early Childhood with Neighborhood-Level Social Determinants of Health.Child Obes. 2025 Jan;21(1):65-75. doi: 10.1089/chi.2023.0157. Epub 2024 Aug 26. Child Obes. 2025. PMID: 39187268
-
Cardiovascular reactivity during conversations about discrimination is buffered by social support among U.S. Latines.Sci Rep. 2024 Nov 6;14(1):26964. doi: 10.1038/s41598-024-76795-y. Sci Rep. 2024. PMID: 39505989 Free PMC article.
-
Alzheimer's disease and Alzheimer's disease-related dementias in Hispanics: Identifying influential factors and supporting caregivers.Ageing Res Rev. 2024 Jan;93:102178. doi: 10.1016/j.arr.2023.102178. Epub 2023 Dec 27. Ageing Res Rev. 2024. PMID: 38154509 Free PMC article. Review.
References
-
- National Center for Health Statistics (U.S.) Gindi R, Franco S, Woodall A. Health, United States, 2019. 2021. - PubMed
-
- Center for Disease Control and Prevention. Racial and Ethnic Disparities in Heart Disease: Center for Disease Control and Prevention; 2019. https://www.cdc.gov/nchs/hus/spotlight/HeartDiseaseSpotlight_2019_0404.pdf. Accessed 22 June 2022.
-
- Centers for Disease Control and Prevention. National Center for Health Statistics. 2017 National Health and Nutrition Examination Survey Data. https://wwwn.cdc.gov/nchs/nhanes/continuousnhanes/default.aspx?BeginYear.... Accessed 22 June 2022.
Publication types
MeSH terms
Grants and funding
LinkOut - more resources
Full Text Sources
Medical
