. 2023 Jan 6;14(1):95.
doi: 10.1038/s41467-022-35494-w.

Molecular subtypes of ALS are associated with differences in patient prognosis

Affiliations

Molecular subtypes of ALS are associated with differences in patient prognosis

Jarrett Eshima et al. Nat Commun. .

Abstract

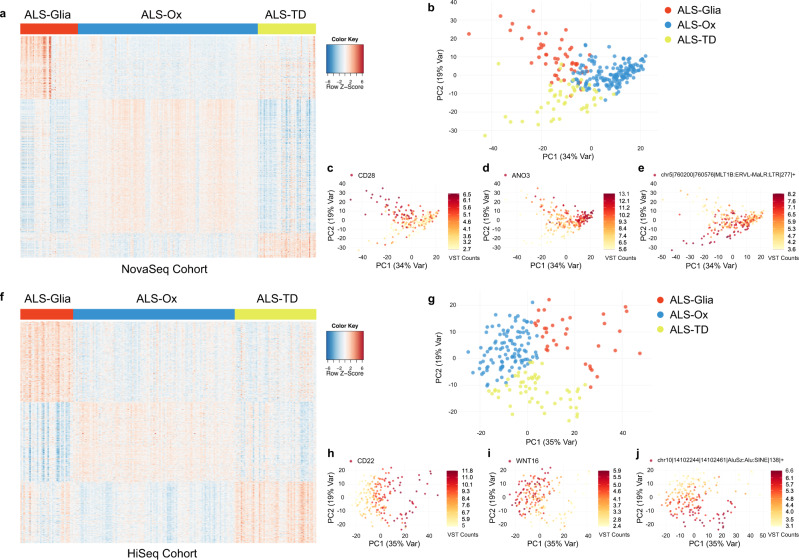
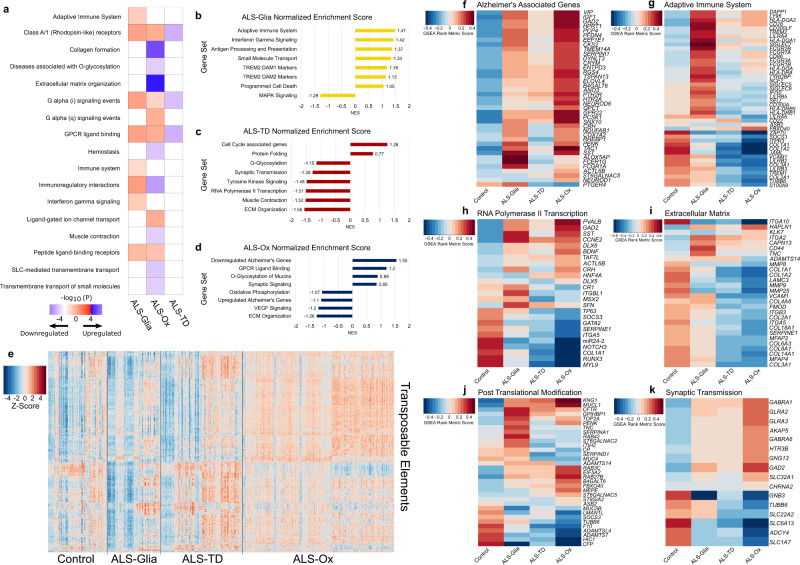
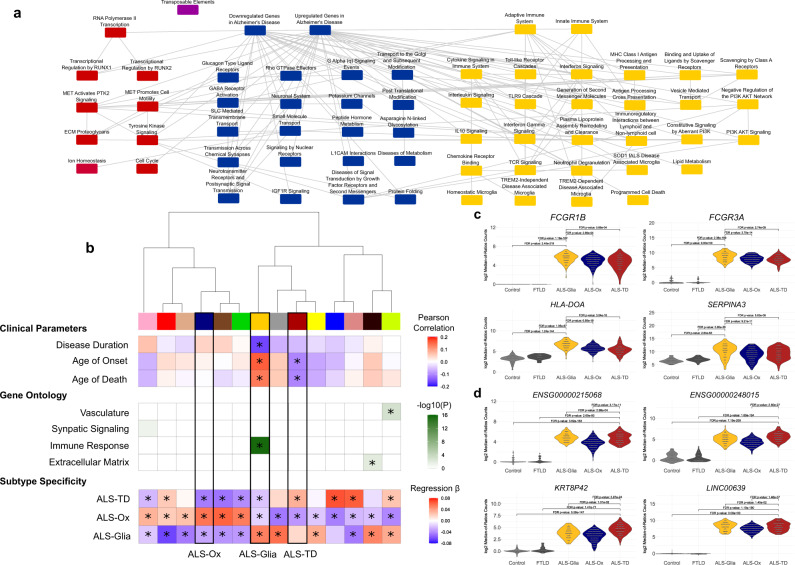
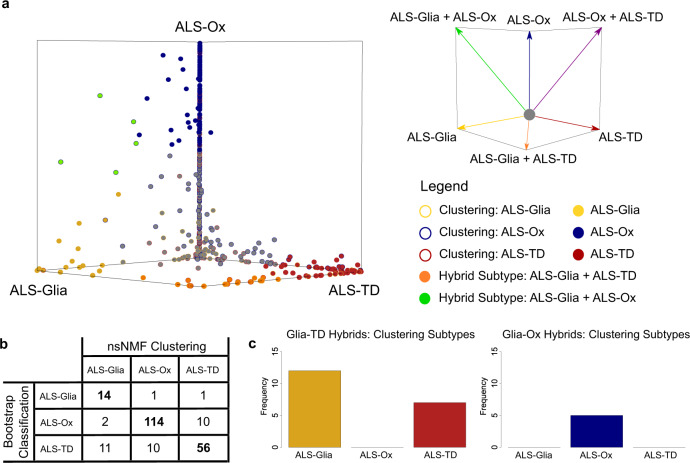
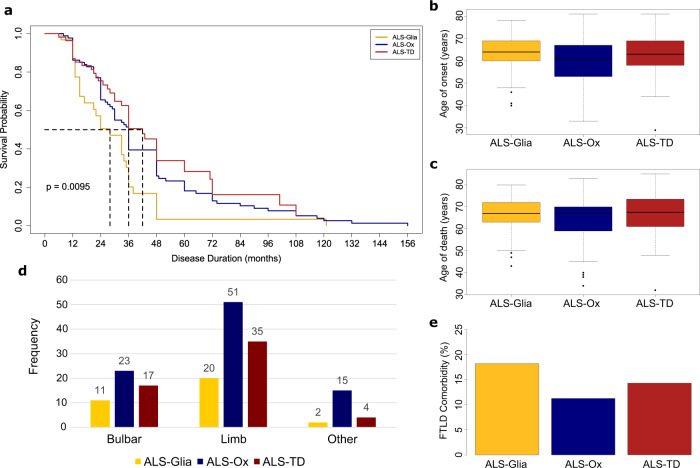
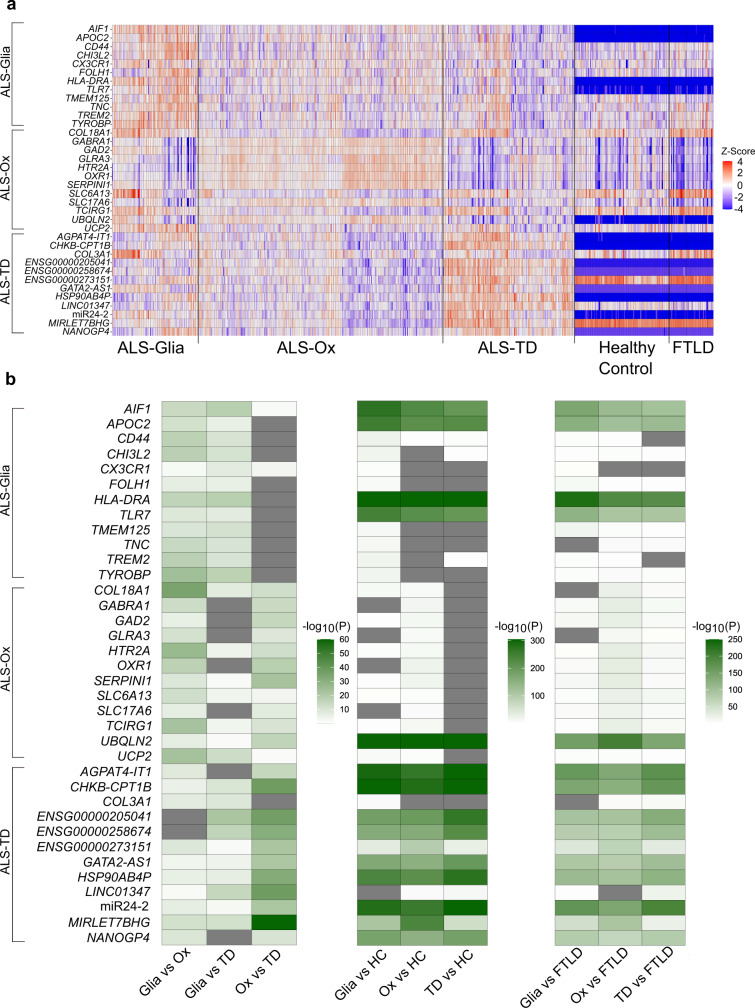
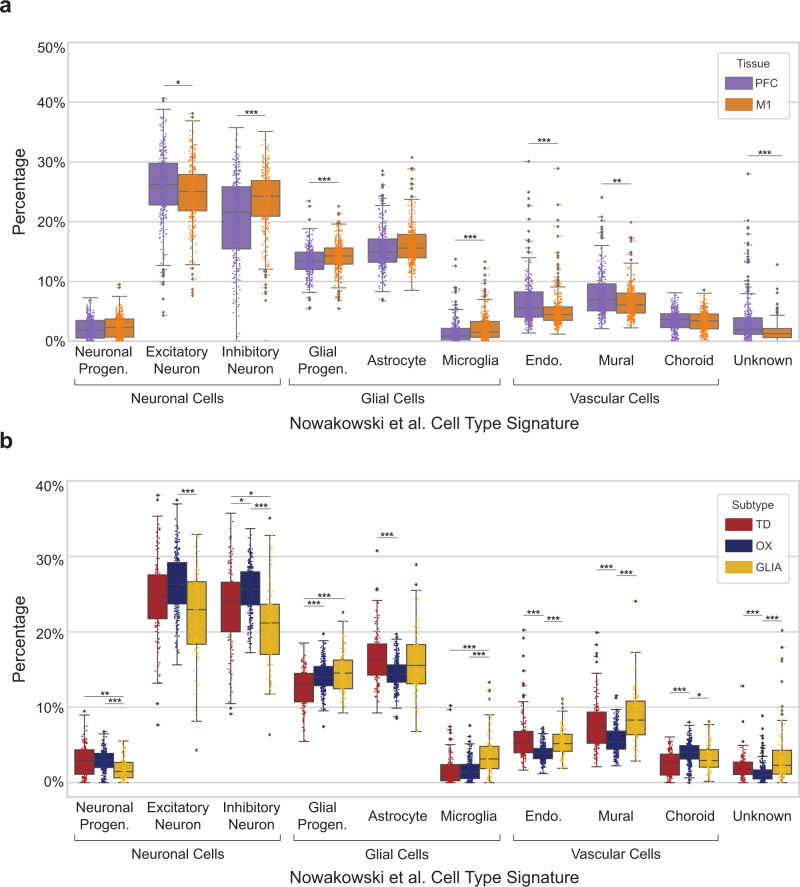
Amyotrophic Lateral Sclerosis (ALS) is a neurodegenerative disease with poorly understood clinical heterogeneity, underscored by significant differences in patient age at onset, symptom progression, therapeutic response, disease duration, and comorbidity presentation. We perform a patient stratification analysis to better understand the variability in ALS pathology, utilizing postmortem frontal and motor cortex transcriptomes derived from 208 patients. Building on the emerging role of transposable element (TE) expression in ALS, we consider locus-specific TEs as distinct molecular features during stratification. Here, we identify three unique molecular subtypes in this ALS cohort, with significant differences in patient survival. These results suggest independent disease mechanisms drive some of the clinical heterogeneity in ALS.


Conflict of interest statement

R.B. is the chairman of the board of Iron Horse Diagnostics, which has not contributed financially, or by any other means, to this study. The remaining authors declare no competing interests.

Figures

Fig. 1
Fig. 1. Unsupervised clustering analysis with ALS postmortem cortex transcriptomes.
a Heatmap of 741 genes and transposable elements selected by SAKE shows transcript overexpression in a subtype-specific fashion for the NovaSeq cohort (n = 255 biologically independent samples). Transcript counts are z-score normalized. b Principal component analysis shows three distinct clusters when considering the first two principal components. c Sample expression of CD28 transcripts was plotted in the same PCA space, with elevated counts seen for the ALS-Glia subtype. A darker color corresponds to higher feature expression. d Expression of the ANO3 gene shows specificity for the oxidative stress and altered synaptic signaling subtype. e The ALS-TD subtype shows specific upregulation of transposable element chr5 | 760200 | 760576 | MLT1B:ERVL-MaLR:LTR | 277 | + compared to the other two subtypes. f Heatmap of 618 genes and TEs shows subtype-specific expression in the HiSeq cohort (n = 196 biologically independent samples). g PCA considering the HiSeq cohort shows three distinct clusters of ALS patient transcriptomes. h Elevated expression of CD22 is seen in the activated glia subtype. i Subtype-specific expression of WNT16 in the ALS-Ox subtype. j chr10 | 14102244 | 14102461|AluSz:Alu:SINE | 138 | + is overexpressed in the ALS-TD subtype. Source data are provided as a Source Data file.
Fig. 2
Fig. 2. Enrichment analysis identifies subtype-specific disease pathways.
a Benjamini-Hochberg adjusted p-values, derived from a Fisher’s exact test, are presented on the –log10 scale. All presented pathways are significantly enriched in at least one subtype. Negative enrichment is encoded as the negative magnitude of the –log10(adjusted p-value). P, Fisher’s exact test, one-tailed, Benjamini-Hochberg method for multiple hypothesis test correction. bd Gene sets enriched in each ALS subtype are presented along the Y-axis, with GSEA normalized enrichment score (NES) presented along the X-axis. e Heatmap of transposable element expression, with 426 unique TEs and 544 biologically independent transcriptomes. Patient samples were plotted by subgroup, with the thin black lines denoting sample separation by subtype. TE count values were subject to VST, followed by z-score normalization, with red indicating elevated expression. fk Pathways enriched specifically for one or more subtypes were generated using GSEA rank metric scores. Genes comprising each functional pathway are included, with subtype-specific gene enrichment scores encoded on a red-blue scale. Source data are provided as a Source Data file.
Fig. 3
Fig. 3. Network construction elucidates subtype-specific disease pathways and eigengenes associated with ALS patient clinical outcomes.
a Network of pathways associated with the ALS cohort, color coded by subtype, with maroon indicating ALS-TD, navy denoting ALS-Ox, and gold signifying ALS-Glia. b WGCNA identifies gene subsets significantly correlated with ALS patient age of disease onset, age of death, and disease duration (univariate regression, two-tailed). Eigengene labels, moving left to right in the dendrogram, are: pink, red, tan, navy (ALS-Ox), brown, green, gold (ALS-Glia), gray, maroon (ALS-TD), yellow, blue, salmon, black, and green-yellow. Eigengenes were enriched for gene ontology and Bonferroni-adjusted p-values are shown (Fisher’s exact test, one-sided). Subtype-specific expression of eigengenes was determined using dummy regression (two-tailed), with the β coefficient presented as a heatmap. A positive β coefficient denotes subtype upregulation of transcripts comprising the particular eigengene. Bonferroni-adjusted p-values less than 0.05 are denoted with *. c Univariate plots showing gene expression levels of four features (FCGR1B, FCGR3A, HLA-DOA, SERPINA3) in the gold eigengene – with evidence for ALS-Glia specificity. P, DESeq2 differential expression using the negative binomial distribution, two-tailed, false discovery rate (FDR) method for multiple hypothesis test correction. d ALS-TD specific expression of four representative features (ENSG00000215068, ENSG00000248015, KRT8P42, LINC00639) in the maroon eigengene. P, same as c. Source data are provided as a Source Data file.
Fig. 4
Fig. 4. Score-based classification uncovers hybrid subtype states in the ALS cohort.
a Subtype scoring was implemented with bootstrapping to assess the spectrum of disease phenotypes presented in ALS. Each point corresponds to a single transcriptome derived from the frontal or motor postmortem cortex, n = 451 biologically independent samples. Patient samples were initially placed at the origin, moved in the direction of the subtype axis for each round of bootstrapping that passed the subtype score threshold, and could only reach the vertex if the patient sample passed the threshold in all rounds of bootstrapping. Data points are filled according to the bootstrap-based subtype assignment and borders are included to denote the patient subtype obtained from unsupervised clustering. Transcriptomes that approached the vertices shared by two subtypes are considered to express a hybrid subtype state. Patient samples are color-coded gray if they failed to pass the subtype score thresholds in ≥ 50% of bootstrap iterations. b Confusion matrix showing unsupervised clustering results in each classification subtype. c Clustering results in Glia-TD and Glia-Ox hybrids. Source data are provided as a Source Data file.
Fig. 5
Fig. 5. Assessment of ALS patient clinical parameters in the context of disease subtypes.
a Kaplan–Meier survival for the three identified ALS subtypes, with n = 150 patients. Patients without an available age of onset or disease duration were excluded from this analysis. The ALS-Glia subtype is significantly associated with a shorter survival duration (p < 0.01, log-rank test). The ALS-Ox subtype had a median survival duration of 36 months, while the ALS-TD group had the longest median survival (42 months). b Age of disease onset plotted as boxplots for the three ALS subtypes, with n = 151 patients. No significant differences are observed in age of onset by subtype. The median is indicated by the solid black line, and first and third quartiles are captured by the bounds of the box. Boxplot whiskers are defined as the first and third quartiles –/+ interquartile range times 1.5, respectively, and outliers are denoted as solid black points. Minimum and maximum values are captured by the lowermost and uppermost points, respectively, or whisker bound if no outliers are shown. c Age at death plotted as boxplots for the ALS-Glia, ALS-Ox, and ALS-TD subtypes, with n = 178 patients. Again, no significant differences are observed. d ALS subtype site of symptom onset, with the ‘Other’ category comprising axial (4), axial-limb (2), bulbar-limb (4), axial-bulbar (1), generalized (1), and unknown (9) sites of onset. e FTLD comorbidity was converted to a percentage and plotted as a bar graph. A Chi-square test of independence was used to assess whether ALS subtype and FTLD comorbidity were associated (p = 0.59, one-tailed). Source data are provided as a Source Data file.
Fig. 6
Fig. 6. Subtype-specific gene expression.
a Heatmap showing expression of 36 subtype-specific transcripts for all patient samples considered in this study. Count values are adjusted for RIN, site of sample preparation, and sequencing platform covariates. Expression is z-score normalized, using ALS patient expression to define the mean and standard deviation. Control samples with a z-score < –4 are adjusted to –4 for plotting purposes. b Presentation of FDR-adjusted p-values following pairwise differential expression analysis. P-values are –log10 transformed prior to plotting. Gray colored entries indicate an adjusted p-value > 0.05. P, DESeq2 differential expression using the negative binomial distribution, two-tailed, FDR method for multiple hypothesis test correction. Source data are provided as a Source Data file.
Fig. 7
Fig. 7. Bulk tissue cell deconvolution in ALS subtypes.
a Cell type percentages in the prefrontal and motor cortices for all patient samples considered in this study. b Fractions of cell types in the frontal and motor postmortem cortex, considered in the context of the ALS subtypes. Significant differences in cell type percentages were assessed using a two-sided Wilcoxon rank sum test with Bonferroni p-value adjustment. Adjusted p-values are denoted using the following scheme: *** p < 0.001; **p < 0.01; *p < 0.05. The median is indicated by the solid black line, and first and third quartiles are captured by the bounds of the box. Boxplot whiskers are defined as the first and third quartiles ± interquartile range times 1.5, respectively, and outliers are denoted as solid black points. Minimum and maximum values are captured by the lowermost and uppermost points, respectively, or whisker bound if no outliers are shown. Source data are provided as a Source Data file, including exact p-values for all comparisons.

Similar articles

Cited by

References

    1. Mitchell JD, et al. Timelines in the diagnostic evaluation of people with suspected amyotrophic lateral sclerosis (ALS)/motor neuron disease (MND)–a 20-year review: can we do better? Amyotroph. Lateral Scler. 2010;11:537–541. - PubMed
    1. Bowser R, Turner MR, Shefner J. Biomarkers in amyotrophic lateral sclerosis: opportunities and limitations. Nat. Rev. Neurol. 2011;7:631–638. - PubMed
    1. Calvo A, et al. Factors predicting survival in ALS: a multicenter Italian study. J. Neurol. 2017;264:54–63. - PubMed
    1. Walhout, R., Verstraete, E., Van Den Heuvel, M. P., Veldink, J. H. & Van Den Berg, L.H. Patterns of symptom development in patients with motor neuron disease. Amyotroph. Lateral Scler. Frontotemporal Degener.19, 21–28 (2018). - PubMed
    1. Whitwell JL, et al. Neuroimaging correlates of pathologically defined subtypes of Alzheimer’s disease: a case-control study. Lancet Neurol. 2012;11:868–877. - PMC - PubMed

Publication types

MeSH terms