. 2023 Jan 6;14(1):96.
doi: 10.1038/s41467-022-35678-4.

Structure of the Sec14 domain of Kalirin reveals a distinct class of lipid-binding module in RhoGEFs

Affiliations

Structure of the Sec14 domain of Kalirin reveals a distinct class of lipid-binding module in RhoGEFs

Yunfeng Li et al. Nat Commun. .

Abstract

Gated entry of lipophilic ligands into the enclosed hydrophobic pocket in stand-alone Sec14 domain proteins often links lipid metabolism to membrane trafficking. Similar domains occur in multidomain mammalian proteins that activate small GTPases and regulate actin dynamics. The neuronal RhoGEF Kalirin, a central regulator of cytoskeletal dynamics, contains a Sec14 domain (KalbSec14) followed by multiple spectrin-like repeats and catalytic domains. Previous studies demonstrated that Kalirin lacking its Sec14 domain fails to maintain cell morphology or dendritic spine length, yet whether and how KalbSec14 interacts with lipids remain unknown. Here, we report the structural and biochemical characterization of KalbSec14. KalbSec14 adopts a closed conformation, sealing off the canonical ligand entry site, and instead employs a surface groove to bind a limited set of lysophospholipids. The low-affinity interactions of KalbSec14 with lysolipids are expected to serve as a general model for the regulation of Rho signaling by other Sec14-containing Rho activators.


Conflict of interest statement

The authors declare no competing interests.

Figures

Fig. 1
Fig. 1. Crystal structure of KalbSec14.
a Schematic diagram of common domains in major isoforms of Kalirin (Kal7, 9 and 12) and use of the four KALRN promoters that encode alternate first exons (Ex1A, 1B, 1 C and 1D). The CRAL_TRIO domain begins in exon 2, which is common to transcripts initiated at each of these four promoters. The KalbSec14 construct used in this study consists of the Ex1B front peptide, the CRAL_TRIO domain and the A helix of the first SR, all colored in blue. b Ribbon diagram of KalbSec14, with secondary structure elements labeled. The helices are shown in blue, the H7 helix in red and the β strands in orange. The first 17 residues of the Ex1B peptide are intrinsically disordered in the structure and the most N-terminal residue shown in this diagram is Val18. c Topology diagram of KalbSec14. Cylinders and arrows represent helices and β strands, respectively. d Molecular surface representation of KalbSec14 shown in an orientation similar to that in b and colored according to the local electrostatic potential calculated with the program ABPS.
Fig. 2
Fig. 2. KalbSec14 adopts a closed conformation containing a surface groove.
a Residues lining the presumed internal pocket are shown as licorice sticks. b Surface representation of the inner and surface cavities of KalbSec14 shown in an orientation similar to that in a. The cavity detection radius and cutoff are set at 5 Å and 3 Å, respectively, as defined by Pymol. Dashed ellipse indicates the location of the internal pocket. c Representation of the surface groove of KalbSec14 generated by HOLLOW. The exterior envelope is set at 8 Å3 over the surface atoms. The volume of the surface groove was calculated with CASTp. d Molecular surface representation of the surface groove of KalbSec14, colored according to the local electrostatic potential as calculated with ABPS.
Fig. 3
Fig. 3. Sequence-specific NMR backbone assignments for KalSec14.
a Sequence of the KalbSec14 residues visible in the crystal structure; red dots signify assigned residues. Proline residues are indicated by black asterisks. b Secondary structure propensity of KalSec14 derived using TALOS-N. Probabilities of occurrence for helices [ρ(α)] and β-sheet [ρ(β)] are shown in blue and orange, respectively. The corresponding secondary structure elements from the X-ray structure of KalbSec14 are shown across the top. Source data are provided as a Source Data file.
Fig. 4
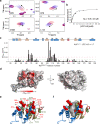
Fig. 4. KalbSec14 binds FC14 via the surface groove.
a Four residues of KalbSec14 that demonstrate CSPs when titrated with increasing amounts of FC14 (1:12 final molar ratio). For each residue, the cross peaks are color-ramped from red to blue with increasing FC14 concentrations, as indicated by arrow. The full series of spectra for the titration are shown in Supplementary Fig. 6a. b A plot of normalized global fitting of the averaged CSPs (δobs/δmax) as a function of FC14 concentration to estimate the KD for binding as described in Methods. The fitting data and the KD value represent the mean ± standard deviation (S.D.) of the CSP data for individual residues (n = 20). Source data are provided as a Source Data file. c Plot of per-residue backbone CSPs between free and FC14-bound states of KalbSec14. Proline residues and residues missing backbone assignment are indicated by an asterisk (black, proline; red, unassigned). Dashed green and red lines indicate CSP values within one (1σ) and two (2σ) S.D. of the average chemical shift distribution (0.026 ppm) among all assigned residues, respectively. Source data are provided as a Source Data file. d Surface representation of KalbSec14 colored according to CSPs induced by FC14 binding, from light gray (no observed CSP) to red (maximum CSP). Dashed ellipse indicates the surface groove. e Residues exhibiting the largest FC14-induced CSPs (>2σ) are shown as red spheres; the orientation of KalbSec14 matches that shown on the left side of d. f Surface representation of the surface groove surrounded with the residues specified in e.
Fig. 5
Fig. 5. Interaction of KalbSec14 with phospholipids.
a Representative Western blots from flotation assays with KalbSec14 alone (Control), and KalbSec14 with the control lipid mix (Lipo) or with the lipid mix containing the indicated additional lipid. After incubation at room temperature, the KalbSec14/liposome mixtures were placed onto an Accudenz cushion, overlaid with buffer containing lower concentrations of Accudenz and subjected to centrifugation. Four fractions were then collected from each gradient; the top fraction (fraction 1) contains at least 90% of the Liss Rhod PE marker included in the liposome mixture. The protein content of each fraction was quantified by Western blotting using an antibody to the Sec14 domain of Kalirin. Source data are provided as a Source Data file. b, c Quantified group data showing protein content of the top fraction for each condition shown in a. Stated value is normalized to total protein recovered from each gradient. Graph bars represent the mean ± S.D. of three (n = 3 for control, Lipo, LPC12:0, LPC16:0, DMPC, LPE14:0, LPG14:0 and LPI13:0), four (n = 4 for LPC14:0, LPC18:0 and LPS13:0) or five (n = 5 LPC18:1 and PI4P) independent experiments. Black dots indicate individual data points. P-values were determined using two-tailed Student’s t-test. Statistical significance was determined versus Lipo mix as values of p < 0.02 (**p < 0.001; *p < 0.02; listed if considered not statistically significant).
Fig. 6
Fig. 6. LPC14:0 binds to the surface groove of KalbSec14.
a Four residues of KalbSec14 that demonstrate CSPs when titrated with increasing amounts of LPC14:0 (1:7 final molar ratio). For each residue, the cross peaks are color-ramped from red to blue with increasing LPC14:0 concentrations, as indicated by arrow. The full series of spectra for the titration are shown in Supplementary Fig. 10a. b A plot of normalized global fitting of the averaged CSPs (δobs/δmax) as a function of LPC14:0 concentration to estimate the KD for binding. The fitting data and the KD value represent the mean ± S.D. of the CSP data for individual residues (n = 13). Source data are provided as a Source Data file. c Plot of per-residue backbone CSPs between free and LPC14:0-bound states of KalbSec14. Proline residues and residues missing backbone assignment are indicated by asterisks (black, proline; red, unassigned). Dashed green and red lines indicate CSP values within one (1σ) and two (2σ) S.D. of the average CSP (0.02 ppm) among all assigned residues, respectively. Source data are provided as a Source Data file. d Surface representation of KalbSec14 colored according to CSPs induced by LPC14:0 binding, from light gray (no observed CSP) to red (maximum CSP). Dashed ellipse indicates the surface groove. e Residues with large LPC14:0-induced CSPs mapped on the structure of KalbSec14; the structure is shown in an orientation similar to that in the left side of d. Residues with CSPs >1σ but <2σ and >2σ are shown as green and red spheres, respectively. f Surface representation of the surface groove surrounded with the residues specified in e.
Fig. 7
Fig. 7. Effects of the surface groove mutations of KalbSec14 on LPC14:0 binding.
a, c Titration data were obtained for two KalbSec14 mutant proteins, each bearing mutations at two positions, D69A/R70A (a) and S105A/K106A (c). For each mutant, data are shown for four residues that demonstrate CSPs when titrated with increasing amounts of LPC14:0 (1:24 and 1:15 final molar ratio for KalbSec14D69A/R70A and KalbSec14S105A/K106A, respectively); cross peaks are color-ramped from red to blue with increasing LPC14:0 concentrations, as indicated by arrow. The full series of spectra for the titration are shown in Supplementary Fig. 13a, b. b, d Plots of normalized global fitting of the averaged CSPs (δobs/δmax) as a function of LPC14:0 concentration to estimate the KD for binding KalbSec14D69A/R70A (b) and KalbSec14S105A/K106A (d). The fitting data and the KD values represent the mean ± S.D. of the CSP data for individual residues for KalbSec14D69A/R70A (n = 9) and KalbSec14S105A/K106A (n = 18). Source data are provided as a Source Data file.

Similar articles

Cited by

References

    1. Gupta AB, Wee LE, Zhou YT, Hortsch M, Low BC. Cross-species analyses identify the BNIP-2 and Cdc42GAP homology (BCH) domain as a distinct functional subclass of the CRAL_TRIO/Sec14 superfamily. PLoS One. 2012;7:e33863. - PMC - PubMed
    1. Grabon A, Bankaitis VA, McDermott MI. The interface between phosphatidylinositol transfer protein function and phosphoinositide signaling in higher eukaryotes. J. Lipid Res. 2019;60:242–268. - PMC - PubMed
    1. Saito K, Tautz L, Mustelin T. The lipid-binding SEC14 domain. Biochim. Biophys. Acta. 2007;1771:719–726. - PubMed
    1. Lipp NF, Ikhlef S, Milanini J, Drin G. Lipid exchangers: cellular functions and mechanistic links with phosphoinositide metabolism. Front. Cell Dev. Biol. 2020;8:663. - PMC - PubMed
    1. Kf de Campos M, Schaaf G. The regulation of cell polarity by lipid transfer proteins of the SEC14 family. Curr. Opin. Plant Biol. 2017;40:158–168. - PubMed

Publication types

LinkOut - more resources