. 2023 Jan 6;42(1):9.
doi: 10.1186/s13046-022-02586-w.

Helicobacter pylori-induced NAT10 stabilizes MDM2 mRNA via RNA acetylation to facilitate gastric cancer progression

Affiliations

Helicobacter pylori-induced NAT10 stabilizes MDM2 mRNA via RNA acetylation to facilitate gastric cancer progression

Min Deng et al. J Exp Clin Cancer Res. .

Erratum in

Abstract

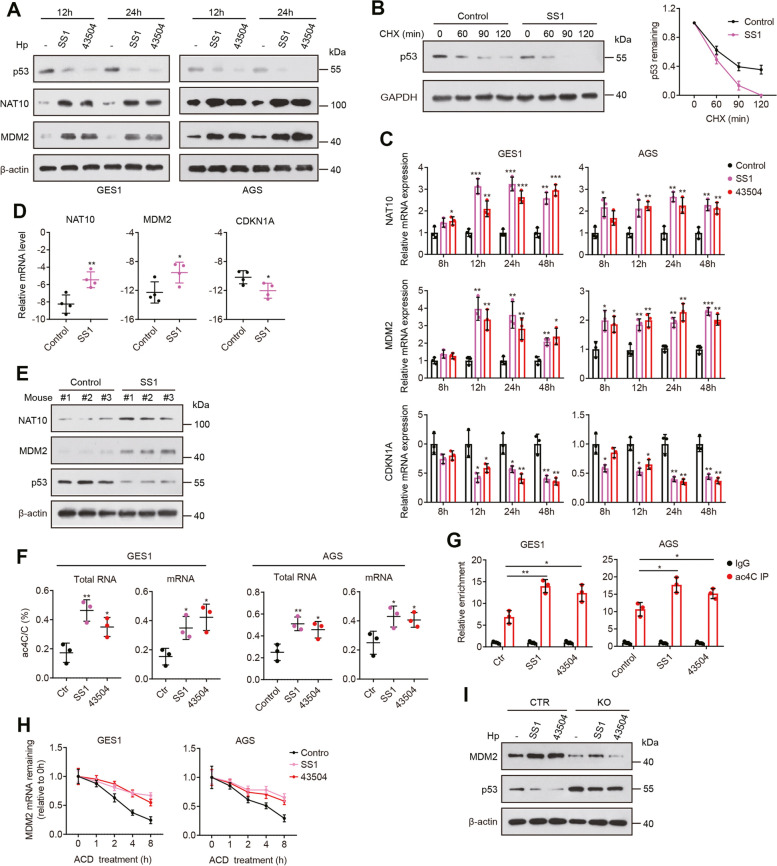
Background: N4-acetylcytidine (ac4C), a widespread modification in human mRNAs that is catalyzed by the N-acetyltransferase 10 (NAT10) enzyme, plays an important role in promoting mRNA stability and translation. However, the biological functions and regulatory mechanisms of NAT10-mediated ac4C were poorly defined.

Methods: ac4C mRNA modification status and NAT10 expression levels were analyzed in gastric cancer (GC) samples and compared with the corresponding normal tissues. The biological role of NAT10-mediated ac4C and its upstream and downstream regulatory mechanisms were determined in vitro and in vivo. The therapeutic potential of targeting NAT10 in GC was further explored.

Results: Here, we demonstrated that both ac4C mRNA modification and its acetyltransferase NAT10 were increased in GC, and increased NAT10 expression was associated with disease progression and poor patient prognosis. Functionally, we found that NAT10 promoted cellular G2/M phase progression, proliferation and tumorigenicity of GC in an ac4C-depedent manner. Mechanistic analyses demonstrated that NAT10 mediated ac4C acetylation of MDM2 transcript and subsequently stabilized MDM2 mRNA, leading to its upregulation and p53 downregulation and thereby facilitating gastric carcinogenesis. In addition, Helicobacter pylori (Hp) infection contributed to NAT10 induction, causing MDM2 overexpression and subsequent p53 degradation. Further investigations revealed that targeting NAT10 with Remodelin showed anti-cancer activity in GC and augmented the anti-tumor activity of MDM2 inhibitors in p53 wild-type GC.

Conclusions: These results suggest the critical role of NAT10-mediated ac4C modification in GC oncogenesis and reveal a previously unrecognized signaling cascade involving the Hp-NAT10-MDM2-p53 axis during GC development.

Keywords: Gastric cancer; Helicobacter pylori; MDM2; N-acetyltransferase 10; N4-acetylcytidine; p53.


Conflict of interest statement

The authors declare no potential conflicts of interest.

Figures

Fig. 1
Fig. 1
ac4C mRNA acetylation and NAT10 expression are upregulated in gastric cancer. A The ac4C/C ratio in polyA( +) mRNA isolated from 20 GCs (tumor) and paired normal gastric mucosal tissues (Normal) was quantified by HPLC–MS/MS. B The expression levels of NAT10 in GC vs. nontumor gastric tissues from the TCGA data and GEO datasets. C qRT–PCR analysis of NAT10 mRNA levels in 20 pairs of GC and adjacent normal tissues. A-C P values were calculated using a two-tailed t-test. D Pearson correlation analysis showing that the ac4C acetylation level is correlated with the mRNA expression of NAT10 in GC specimens. E Western blot assay of NAT10 protein levels in 15 GC tissues and paired normal tissues. T, gastric tumor; N, adjacent normal tissue. F IHC analyses of NAT10 expression in 202 GC and 185 adjacent normal tissues on tissue microarrays. Scale bar: 150 μm. G Overall survival curves for GC patients in the TMA cohort with high or low expression of NAT10. H Kaplan–Meier analyses of OS, FP and PPS for GC patients based on NAT10 expression using the online tool Kaplan–Meier Plotter. I Multivariate Cox analysis of factors associated with OS in TMA samples. CI, confidence interval; HR, hazard rate. Error bars, SD
Fig. 2
Fig. 2
NAT10 depletion inhibits GC cell proliferation and in vivo tumor growth. A Schematic of NAT10 with its known domains. Arrows indicate point mutations. B Western blot analysis was performed to confirm the level of NAT10 in control AGS cells, NAT10-knockout cells, knockout cells rescued with stable expression of wild-type or mutant NAT10, and BGC823 cells stably expressing NAT10 shRNAs or control shRNA. C-F The ac4C mRNA levels were tested by HPLC–MS/MS (C) and ac4C dot blot (D) analyses, and proliferation capacities were detected by CCK-8 (E) and colony formation (F) assays in the above cells. G The cell cycle distribution was assessed in the indicated cells by flow cytometry. H and I NAT10 knockout inhibited subcutaneous tumor growth (H) and the formation of tumor nodules in the peritoneal cavity (I), while overexpression of wild-type NAT10, but not of the K290A or G641E mutants, offset these effects (n = 5 mice/group). CTR, control; KO, NAT10 knockout; shCTR, control shRNA; shNAT10, NAT10 shRNA. Error bars indicate the SD. *P < 0.05, **P < 0.01, *** P < 0.001 (two-tailed t-test)
Fig. 3
Fig. 3
NAT10 maintains the stability of MDM2 mRNA via ac4C modification. A Heat map showing differentially expressed genes identified by RNA-seq in NAT10-knockout cells relative to the control cells. Green and red indicate low and high mRNA levels, respectively. B Volcano plot of altered ac4C peaks within mRNA transcripts between NAT10-knockout and control cells. C A Venn diagram shows overlapping mRNA transcripts that were both differentially expressed (DEG) and hypoacetylated upon NAT10 knockout and differentially expressed genes (DEG) following NAT10 knockdown. D The ac4C peak was enriched in the 3′UTR of MDM2 from the acRIP-seq data. Squares indicate a significant decrease in the ac4C peak in NAT10-knockout cells relative to control AGS cells. E The relative ac4C levels of the MDM2 transcript were evaluated in the indicated cells by acRIP-qPCR. F RIP assay with anti-NAT10 and anti-IgG antibodies was carried out to analyze the relative NAT10 enrichment in MDM2 mRNA. G The mRNA levels of MDM2 in the indicated cells. H MDM2 mRNA levels were measured in cells treated with Remodelin for 24 h. I and J MDM2, p53, p21 and PUMA were detected by Western blotting in the indicated cells. K Western blot analysis of NAT10, MDM2 and p53 in xenograft tumor tissues. L MDM2 mRNA stability assessment in the indicated cells treated with 5 μg/mL actinomycin D (ACD). M A schematic diagram illustrating the luciferase reporter plasmids containing the wild-type (Wt) MDM2 3’UTR fragment or its mutant (Mut) counterpart that lacks the ac4C peak region. N and O The relative mRNA expression (N) and activity (O) of firefly luciferase fused with the wild-type or mutant MDM2 3′UTR in control AGS cells, NAT10-knockout cells and knockout cells re-expressing wild-type or mutant NAT10. P Immunoblot of p53 protein and quantification of the relative level of p53 at the indicated time in control and NAT10-knockout AGS cells after treatment with 100 μg/ml cycloheximide (CHX) to block protein synthesis. Error bars represent the SD from three independent experiments. *P < 0.05, **P < 0.01, *** P < 0.001. ns, not significant. All P values were determined by two-tailed t-test
Fig. 4
Fig. 4
MDM2 is a major contributor to the function of NAT10 in gastric carcinogenesis. A Overexpression of MDM2 inhibited the upregulation of p53 and p21 proteins in NAT10-knockout AGS cells, while knockdown of MDM2 effectively reversed the inhibitory effect of NAT10 overexpression on p53 and p21. B MDM2 overexpression reversed the upregulation of p53 and p21 proteins by NAT10 knockdown in BGC823 cells. C and D The effects of NAT10 depletion on cell proliferation (C) and colonic growth (D) were rescued by transfection with MDM2, whereas cell proliferation and colonic growth of NAT10-overexpressing cells were prevented by knockdown of MDM2. E and F Cell cycle (E) and apoptosis (F) were measured in the indicated cells by flow cytometry. G MDM2 and NAT10 proteins were evaluated in NAT10-knockout AGS cells stably expressing MDM2 or vector control. H MDM2 overexpression rescued the impaired capacity of tumor growth triggered by NAT10 knockout (n = 5 mice/group). Error bars, SD. *P < 0.05, **P < 0.01, ***P < 0.001 using a two-tailed t-test
Fig. 5
Fig. 5
NAT10 overexpression correlates with high levels of MDM2 ac4C modification and MDM2 expression in gastric cancer specimens. A and B The ac4C levels of the MDM2 transcript were measured by acRIP-qPCR analysis (A), and MDM2 mRNA levels were tested by qRT–PCR (B) in 20 GC and paired normal gastric mucosal tissues. The differences were determined with a two-tailed t-test. C ac4C levels of MDM2 mRNA were positively correlated with MDM2 and NAT10 expression in GC specimens. D The graph shows a significant correlation of NAT10 mRNA with MDM2 expression in GCs. E The TCGA and GEO datasets shows that NAT10 and MDM2 levels were correlated in GC tissues. r and P values were determined by Pearson correlation test (C-E). FH Representative images of IHC staining of NAT10 and MDM2 in normal gastric tissues and two GC samples with high or low expression of both proteins are shown (F). Scale bar, 150 μm. NAT10 expression was positively correlated with MDM2 expression (G). r and P values were calculated using the Pearson correlation test. Kaplan–Meier analysis indicates the correlation between the combination of high expression of NAT10 and MDM2 and poorer OS (H). Error bars, SD
Fig. 6
Fig. 6
Hp infection enhances NAT10 expression and regulates p53 stability. A Western blot analysis of p53, NAT10 and MDM2 following coculture of GES1 and AGS cells with Hp. B The stability of p53 protein was determined in GES1 cells cocultured with Hp SS1 using the cycloheximide chase method. C qRT–PCR was performed to analyze NAT10, MDM2 and CDKN1A expression in the indicated cells. D and E qRT–PCR analysis of NAT10, MDM2 and CDKN1A expression (D) and Western blot analysis of NAT10, MDM2 and p53 (E) in gastric tissues from mice challenged with Hp SS1 or Brucella broth (Control) for 3 weeks. F The global ac4C acetylation levels in mRNA and total RNA from GES1 and AGS cells cultured in the presence or absence of Hp. G The ac4C levels of MDM2 mRNA in cells treated as described in H. H The stability of MDM2 mRNA was assessed in the indicated cells treated with 5 μg/mL ACD. The MDM2 mRNA abundance relative to that of GAPDH as quantified by qRT–PCR. I Protein levels were tested in NAT10-knockout and control cells following coculture with Hp. SS1, Hp strain SS1; 43,504, Hp strain ATCC43504. Error bars, SD. *P < 0.05, **P < 0.01, ***P < 0.001 (two-tailed t-test)
Fig. 7
Fig. 7
Remodelin suppresses gastric cancer growth and improves the sensitivity of GC cells to MDM2 inhibitors. A and B Dose–response curves (A) and growth IC50 values (B) of gastric cancer and normal gastric cell lines following exposure to Remodelin for 72 h in a CCK-8 assay. C and D Clonogenic assay of gastric cell lines after exposure to increasing concentrations of Remodelin. E Nude mice were subcutaneously implanted with BGC823 cells and treated intraperitoneally with different doses of Remodelin daily for 4 weeks (5 mice per group). Tumor volumes were measured as a surrogate for tumor burden. F Survival curve of mice treated as described in E. G p53, p21 and MDM2 protein levels in AGS cells treated for 24 h with DMSO (vehicle), HDM201 (or Nutlin-3), Remodelin, or a combination of HDM201 (or Nutlin-3) and Remodelin were tested by Western blotting. Densitometric analysis for p53, p21, and MDM2 is shown in the right panel. H and I Combination study of the inhibitory effects of Remodelin and MDM2 inhibitors on the growth of the p53 wild-type GC cell lines AGS and BGC823 based on a CCK-8 assay. The combination index (CI) values were determined with CompuSyn software. J BGC823 cells were subcutaneously implanted into nude mice. Animals were treated daily with vehicle control, HDM201 (10 mg/kg), Remodelin (30 mg/kg), or the combination of both drugs for 4 weeks (6 mice per group). The tumor volume is shown. K Survival curves of mice treated in J. Rem, Remodelin; Nutlin, Nutlin-3. Error bars indicate the SD. *P < 0.05, **P < 0.01, ***P < 0.001(two-tailed t-test). ns, not significant
Fig. 8
Fig. 8
Schematic model for the Hp-NAT10-MDM2-p53 axis in promoting the development of GC

Similar articles

Cited by

References

    1. Sung H, Ferlay J, Siegel RL, Laversanne M, Soerjomataram I, Jemal A, et al. Global Cancer Statistics 2020: GLOBOCAN Estimates of Incidence and Mortality Worldwide for 36 Cancers in 185 Countries. CA Cancer J Clin. 2021;71:209–249. doi: 10.3322/caac.21660. - DOI - PubMed
    1. Van Cutsem E, Sagaert X, Topal B, Haustermans K, Prenen H. Gastric cancer. Lancet. 2016;388:2654–2664. doi: 10.1016/S0140-6736(16)30354-3. - DOI - PubMed
    1. Tan P, Yeoh KG. Genetics and Molecular Pathogenesis of Gastric Adenocarcinoma. Gastroenterology. 2015;149:1153–1162. doi: 10.1053/j.gastro.2015.05.059. - DOI - PubMed
    1. Ajani JA, Lee J, Sano T, Janjigian YY, Fan D, Song S. Gastric adenocarcinoma Nat Rev Dis Primers. 2017;3:17036. doi: 10.1038/nrdp.2017.36. - DOI - PubMed
    1. Chen X, Li A, Sun BF, Yang Y, Han YN, Yuan X, et al. 5-methylcytosine promotes pathogenesis of bladder cancer through stabilizing mRNAs. Nat Cell Biol. 2019;21:978–990. doi: 10.1038/s41556-019-0361-y. - DOI - PubMed

MeSH terms