

Future world cancer death rate prediction
- PMID: 36609490
- PMCID: PMC9822976
- DOI: 10.1038/s41598-023-27547-x
Future world cancer death rate prediction
Abstract
Cancer is a worldwide illness that causes significant morbidity and death and imposes an immense cost on global public health. Modelling such a phenomenon is complex because of the non-stationarity and complexity of cancer waves. Apply modern novel statistical methods directly to raw clinical data. To estimate extreme cancer death rate likelihood at any period in any location of interest. Traditional statistical methodologies that deal with temporal observations of multi-regional processes cannot adequately deal with substantial regional dimensionality and cross-correlation of various regional variables. Setting: multicenter, population-based, medical survey data-based biostatistical approach. Due to the non-stationarity and complicated nature of cancer, it is challenging to model such a phenomenon. This paper offers a unique bio-system dependability technique suited for multi-regional environmental and health systems. When monitored over a significant period, it yields a reliable long-term projection of the chance of an exceptional cancer mortality rate. Traditional statistical approaches dealing with temporal observations of multi-regional processes cannot effectively deal with large regional dimensionality and cross-correlation between multiple regional data. The provided approach may be employed in numerous public health applications, depending on their clinical survey data.
© 2023. The Author(s).
Conflict of interest statement
The authors declare no competing interests.
Figures
References
-
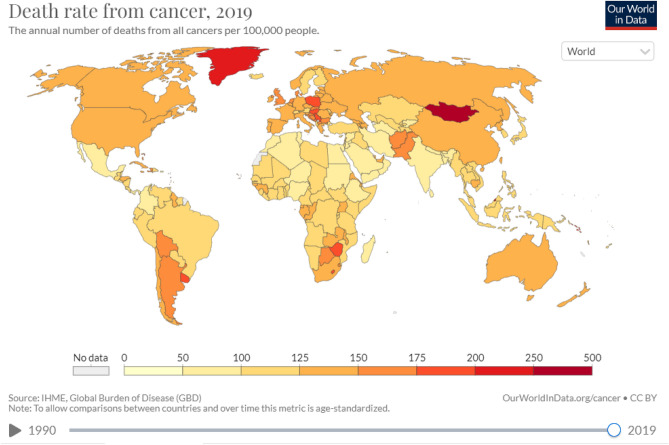
- Ritchie, H., Spooner, F. & Roser, M. Causes of death. In Our World in DataOur World in Data, https://ourworldindata.org/causes-of-death.
-
- Surveillance, Epidemiology, and End Results (SEER) Program. SEER*Stat Database: Incidence- SEER 9 Registries Research Data with Delay- Adjustment, Malignant Only, November 2020 Submission (1975- 2018) <Katrina/Rita Population Adjustment>- Linked to County Attributes- Total US, 1969- 2018 Counties. National Cancer Institute, Division of Cancer Control and Population Sciences, Surveillance Research Program, Surveillance Systems Branch (2021).
-
- Surveillance, Epidemiology, and End Results (SEER) Program. SEER*Stat Database: Incidence- SEER 18 Registries Research Data + Hurricane Katrina Impacted Louisiana Cases, November 2020 Submission (2000- 2018) <Katrina/Rita Population Adjustment>- Linked to County Attributes- Total US, 1969–2018 Counties. National Cancer Institute, Division of Cancer Control and Population Sciences, Surveillance Research Program, Surveillance Systems Branch (2021).
Publication types
MeSH terms
LinkOut - more resources
Full Text Sources
Medical
