. 2023 Jan 6;14(1):101.
doi: 10.1038/s41467-022-35570-1.

Amazon windthrow disturbances are likely to increase with storm frequency under global warming

Affiliations

Amazon windthrow disturbances are likely to increase with storm frequency under global warming

Yanlei Feng et al. Nat Commun. .

Abstract

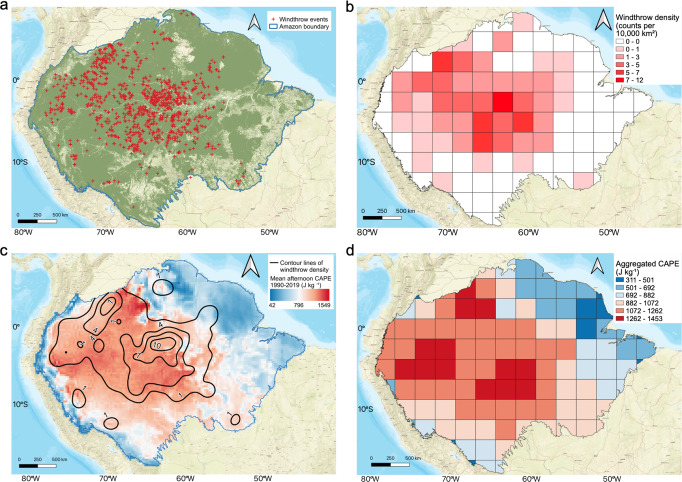
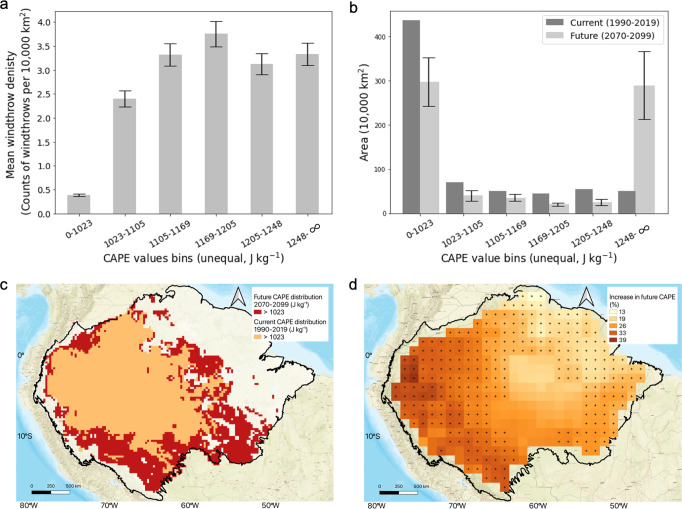
Forest mortality caused by convective storms (windthrow) is a major disturbance in the Amazon. However, the linkage between windthrows at the surface and convective storms in the atmosphere remains unclear. In addition, the current Earth system models (ESMs) lack mechanistic links between convective wind events and tree mortality. Here we find an empirical relationship that maps convective available potential energy, which is well simulated by ESMs, to the spatial pattern of large windthrow events. This relationship builds connections between strong convective storms and forest dynamics in the Amazon. Based on the relationship, our model projects a 51 ± 20% increase in the area favorable to extreme storms, and a 43 ± 17% increase in windthrow density within the Amazon by the end of this century under the high-emission scenario (SSP 585). These results indicate significant changes in tropical forest composition and carbon cycle dynamics under climate change.


Conflict of interest statement

The authors declare no competing interests.

Figures

Fig. 1
Fig. 1. The spatial pattern of windthrows and mean afternoon convective available potential energy (CAPE).
a 1012 Windthrow events identified manually using Landsat 8 images, green color in the background represents forested area. b Windthrow density in 2.5° × 2.5° grids. c Contour lines of windthrow density (counts per 10,000 km2) over the mean afternoon CAPE at 0.25° resolution. d Mean afternoon CAPE aggregated in 2.5° × 2.5° grids using the 90th percentile over the grid.
Fig. 2
Fig. 2. The relationship maps convective available potential energy (CAPE) to windthrow density and future increase in CAPE simulated by Earth system models under the high-emission scenario.
a Mean windthrow density as a function of CAPE values, calculated using the data shown in Figs. 1a, c. The boundaries of the CAPE bins were selected to have the same number of observed windthrows in each bin to avoid noise at the tails. The error bars (SD) of the windthrow density were generated using 10,000 bootstrapped samples of the 1012 windthrow points. The lower and upper CAPE bin boundaries were expanded to a minimum of 0 and a maximum of infinity with an assumption that the windthrow density is similar for the neighboring CAPE values. b The area of the Amazon region in each CAPE bin for the past 30 years and for the last 30 years of the century. The error bars (SD) of future CAPE were generated using scaled 2070–2099 CMIP6 CAPE from 10 ESMs. c The increase in area with CAPE over 1023 J kg−1, with orange pixels representing mean 1990–2019 ERA 5 CAPE higher than 1023 J kg−1 and red pixels representing mean scaled 2070–2099 CMIP6 CAPE higher than 1023 J kg−1. d Ensemble-mean increase of CAPE from the current climate (1990–2014) to the future climate (2070–2099) under the SSP585 scenario. Since CMIP6 models provide historic simulations only up to 2015, data from 2015 to 2020 are not included. Stippling indicates regions where all 10 ESMs agree on the increase of CAPE, with CAPE calculated using daily surface pressure and atmospheric profiles at standard pressure levels.

References

    1. Esquivel-Muelbert, A. et al. Tree mode of death and mortality risk factors across Amazon forests. Nat. Commun. 11, 5515 (2020). - PMC - PubMed
    1. Negrón-Juárez, R. I. et al. Vulnerability of Amazon forests to storm-driven tree mortality. Environ. Res. Lett. 13, 054021 (2018).
    1. Negrón-Juárez RI, et al. Detection of subpixel treefall gaps with landsat imagery in Central Amazon forests. Remote Sens. Environ. 2011;115:3322–3328.
    1. Chambers JQ, Negrón-Juárez RI, Hurtt GC, Marra DM, Higuchi N. Lack of intermediate-scale disturbance data prevents robust extrapolation of plot-level tree mortality rates for old-growth tropical forests. Ecol. Lett. 2009;12:22–25. - PubMed
    1. Nelson BW, et al. Forest disturbance by large blowdowns in the Brazilian Amazon. Ecology. 1994;75:853–858.

Publication types