. 2023 Jan 6;8(1):24.
doi: 10.1038/s41392-022-01291-6.

COVID-19-associated monocytic encephalitis (CAME): histological and proteomic evidence from autopsy

Affiliations

COVID-19-associated monocytic encephalitis (CAME): histological and proteomic evidence from autopsy

Pei-Pei Zhang et al. Signal Transduct Target Ther. .

Abstract

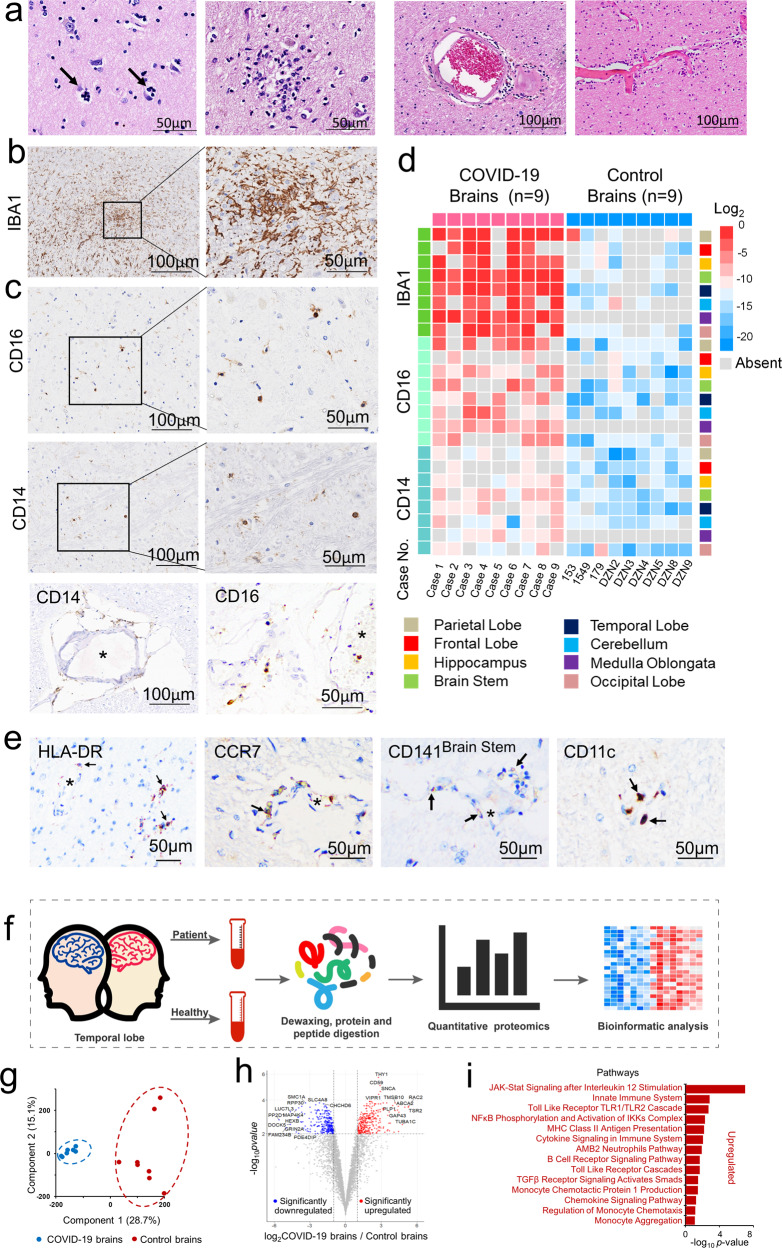
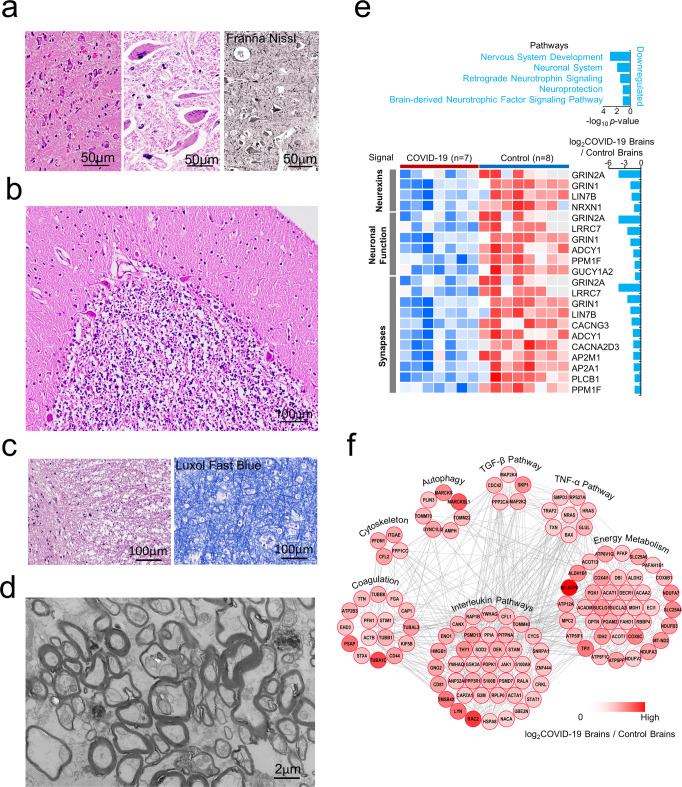
Severe neurological symptoms are associated with Coronavirus disease 2019 (COVID-19). However, the morphologic features, pathological nature and their potential mechanisms in patient brains have not been revealed despite evidence of neurotropic infection. In this study, neuropathological damages and infiltrating inflammatory cells were quantitatively evaluated by immunohistochemical staining, ultrastructural examination under electron microscopy, and an image threshold method, in postmortem brains from nine critically ill COVID-19 patients and nine age-matched cadavers of healthy individuals. Differentially expressed proteins were identified by quantitative proteomic assays. Histopathological findings included neurophagocytosis, microglia nodules, satellite phenomena, extensive edema, focal hemorrhage, and infarction, as well as infiltrating mononuclear cells. Immunostaining of COVID-19 brains revealed extensive activation of both microglia and astrocytes, severe damage of the blood-brain barrier (BBB) and various degrees of perivascular infiltration by predominantly CD14+/CD16+/CD141+/CCR7+/CD11c+ monocytes and occasionally CD4+/CD8+ T lymphocytes. Quantitative proteomic assays combined with bioinformatics analysis identified upregulated proteins predominantly involved in immune responses, autophagy and cellular metabolism in COVID-19 patient brains compared with control brains. Proteins involved in brain development, neuroprotection, and extracellular matrix proteins of the basement membrane were downregulated, potentially caused by the activation of transforming growth factor β receptor and vascular endothelial growth factor signaling pathways. Thus, our results define histopathological and molecular profiles of COVID-19-associated monocytic encephalitis (CAME) and suggest potential therapeutic targets.


Conflict of interest statement

X.-W.B. is the editorial board member of Signal Transduction and Targeted Therapy, but he has not been involved in the process of manuscript handling.

Figures

Fig. 1
Fig. 1
Monocyte infiltration and extensive microglia activation in COVID-19 brains. a Histology shows neuronophagia, microglial nodule and perivascular inflammation in COVID-19 brain tissues. b Immunohistochemical staining for IBA1 shows reactive activation of microglia. c Immunohistochemistry shows CD16+ and CD14+ inflammatory cells infiltrating perivascular space and parenchyma. d Quantitative analysis of the type and distribution of immune cells in the brains of all COVID-19 patients. In addition to CD16+ and CD14+ infiltrating cells, lymphocytic infiltration around the vessel is also seen (please see Supplementary Fig. S1). e The mononuclear cells (black arrows) in the microvessel (*) walls and perivascular spaces are positive for monocyte biomarkers HLA-DR, CCR7, CD141 and CD11c. f Scheme of proteomics study. g Principal component analysis of 15 samples based on quantitative profiles of proteins of brain tissues. Red and blue dots represent brain samples from COVID-19 patients and healthy controls. The red color represents control brains, while the blue color represents COVID-19 brains. h Volcano plots of the −log10 p-value vs. the log2 protein abundance comparisons between brains from normal subjects and those with COVID-19. Proteins outside the significance threshold lines (−log10 (p-value) > 2 and log2 (fold change) > 1 or <−1) are in red (upregulated) or blue (downregulated). The p values are calculated for proteins identified in brain tissues from the COVID-19 patients and healthy controls. i Proteomic analysis showing the activated monocyte-related pathway changes and release of inflammatory factors
Fig. 2
Fig. 2
Structural damage and molecular alterations of blood–brain barrier (BBB) in COVID-19 brains. a Hyperemia and dilatation of blood vessels, perivascular infiltration of inflammatory cells, destruction of glial membrane and damage of BBB. GFAP immunohistochemistry showing damaged and discontinuous glial membranes were damaged and discontinuous. b Damaged BBB with degenerative capillary endothelial cells (Endo), abnormal tight junction, broken basement membranes (BM) and swollen glial membrane (GM, i.e., astrocytic end-feet). Organelles such as mitochondria (Mi) show degeneration. RBC, red blood cell. c Quantitative analysis of proteins significantly increased in COVID-19 patients correlated with the degree of cerebral edema. d Elevated glial fibrillary acidic protein (GFAP) is seen in the brain of COVID-19 patients and is associated with glial membrane destruction and astrocyte activation. e Perivascular space correlated with astrocyte activation. f Heatmap analysis of six types of ECM categories identified in the basement membrane (BM) according to log2 fold changes of COVID-19 brains vs. control brains. Red and blue boxes indicate proteins with increased or decreased abundance, respectively, in brain tissues from COVID-19 patients. g Functional pathway enrichment analysis of differentially expressed proteins in brain tissues from COVID-19 patients vs. healthy controls. Color bars represent the −log10 P value of the upregulated or downregulated functional categories with COVID-19 brains vs. control brains. h Functional analysis of differentially expressed proteins in brain tissues from patients with COVID-19 vs. controls. Columns on the left of the heatmap represent different function categories. The right of the heatmap represents gene names. Red and blue boxes indicate the log10 p-value of the intensity of the enriched or depleted proteins, respectively. The histogram shows the ratio of protein intensities from COVID-19 brains compared to control brains. Y-axis represents the log2 COVID-19/control brains
Fig. 3
Fig. 3
Similar cytokine profiles in COVID-19-associated encephalitis and SARS-CoV2-induced lung and liver injury. a Inflammation analysis of differentially expressed proteins in brain tissues from patients diagnosed with COVID-19 vs. controls. Columns on the left of the heatmap represent different inflammatory factors. The right of the heatmap lists gene names. Red and blue boxes indicate normalized intensity of the enriched or depleted proteins, respectively. Histogram shows the ratio of protein intensities from the COVID-19 patients. Y-axis represents the log2 COVID-19/Controls. b Immunohistochemistry shows endothelial cells, lymphocytes, and monocytes positive for IL-4, IL-6, IL-8, IL-12, TGF- β, and TNF-α. c The similarities of inflammatory factors in the brain, lung, and liver tissues of COVID-19 patients
Fig. 4
Fig. 4
Neuron and myelin sheath damage associated with abnormal protein expression in COVID-19 brains. a Cerebral neurons show various degrees of damage, including red degeneration of neurons, dissolution and disappearance of Nissl bodies, and formation of giant neurons in gray matter. b The number of cerebellar Purkinje and granular cells was decreased and their dendrites and axons show injured. c Loose and rupture of white matter. d Electron microscopic examination shows the swollen axons and myelin sheath (scale bars 2 μm). e Functional pathway enrichment analysis of differentially expressed proteins in brain tissues from patients with COVID-19 vs. controls. Blue bars represent the −log10 p-value of the downregulated functional categories with COVID-19 vs. controls. Columns on the left of the heatmap represent different function categories. The right of the heatmap represents the gene names. Red and blue boxes indicate normalized intensity of the enriched or depleted proteins, respectively. Histogram showing the ratio of protein intensities from COVID-19 brains compared to control brains. Y-axis represents the log2 COVID-19/controls. f Interaction network of proteins differentially expressed in brains of patients with COVID-19 vs. controls. The primary biological process analyses include a map of functional categories. Red circles represent proteins with high expression in brain tissue from patients diagnosed with COVID-19 compared to controls. Color gradient indicates the protein abundance levels in the brains of COVID-19 patients

References

    1. Yao XH, et al. A cohort autopsy study defines COVID-19 systemic pathogenesis. Cell Res. 2021;31:836–846. - PMC - PubMed
    1. Gupta A, et al. Extrapulmonary manifestations of COVID-19. Nat. Med. 2020;26:1017–1032. - PMC - PubMed
    1. Mao L, et al. Neurologic manifestations of hospitalized patients with coronavirus disease 2019 in Wuhan, China. JAMA Neurol. 2020;77:683–690. - PMC - PubMed
    1. Ellul MA, et al. Neurological associations of COVID-19. Lancet Neurol. 2020;19:767–783. - PMC - PubMed
    1. Ho CY, et al. Postmortem assessment of olfactory tissue degeneration and microvasculopathy in patients with COVID-19. JAMA Neurol. 2022;79:544–553. - PMC - PubMed

Publication types

Substances