. 2023 Jan 6;14(1):98.
doi: 10.1038/s41467-022-35238-w.

A comprehensive single-cell map of T cell exhaustion-associated immune environments in human breast cancer

Affiliations

A comprehensive single-cell map of T cell exhaustion-associated immune environments in human breast cancer

Sandra Tietscher et al. Nat Commun. .

Abstract

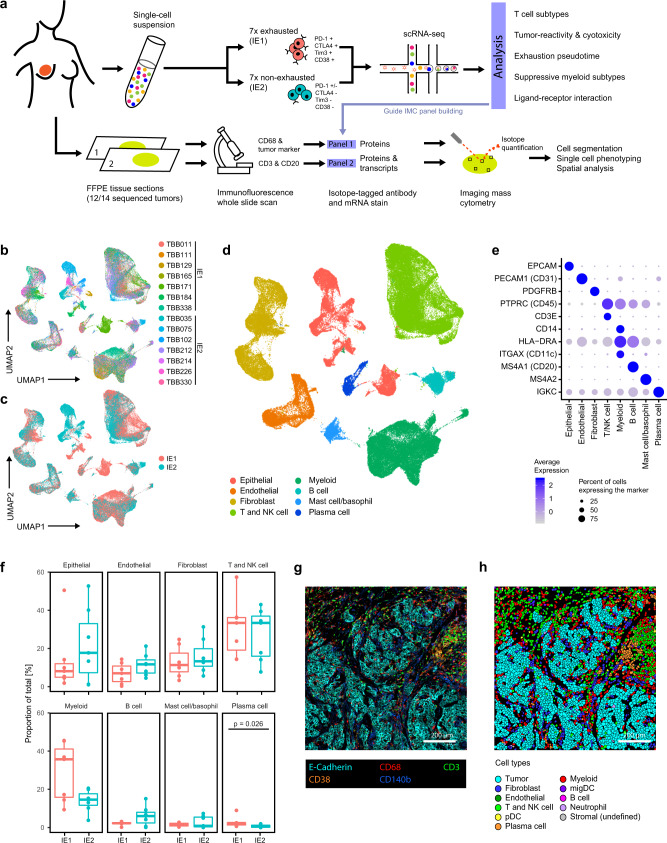
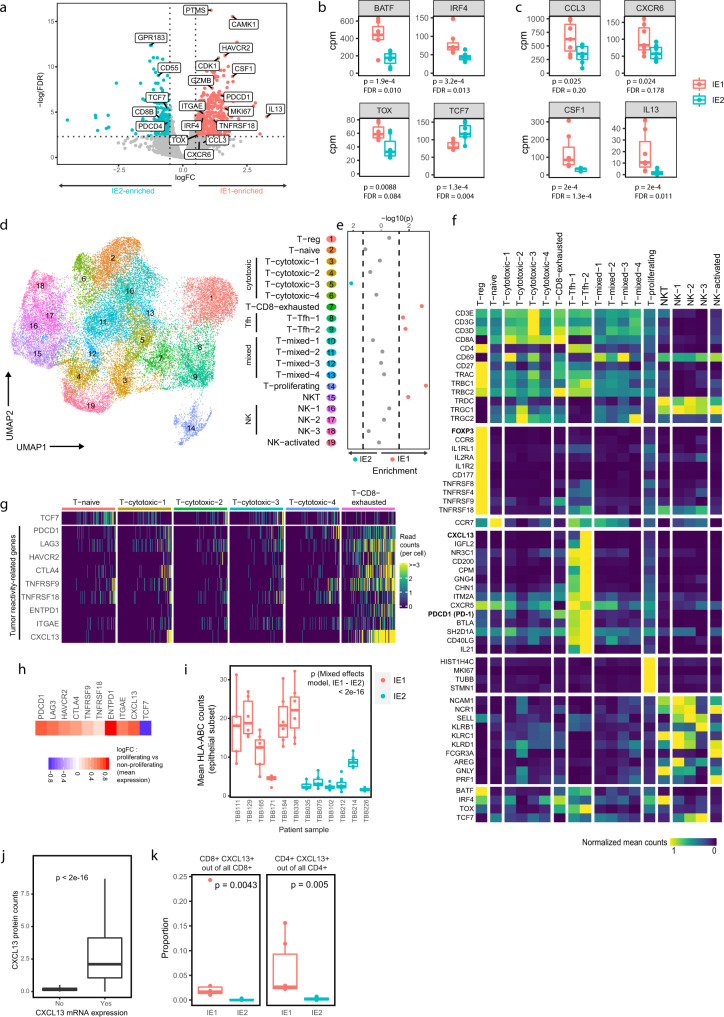
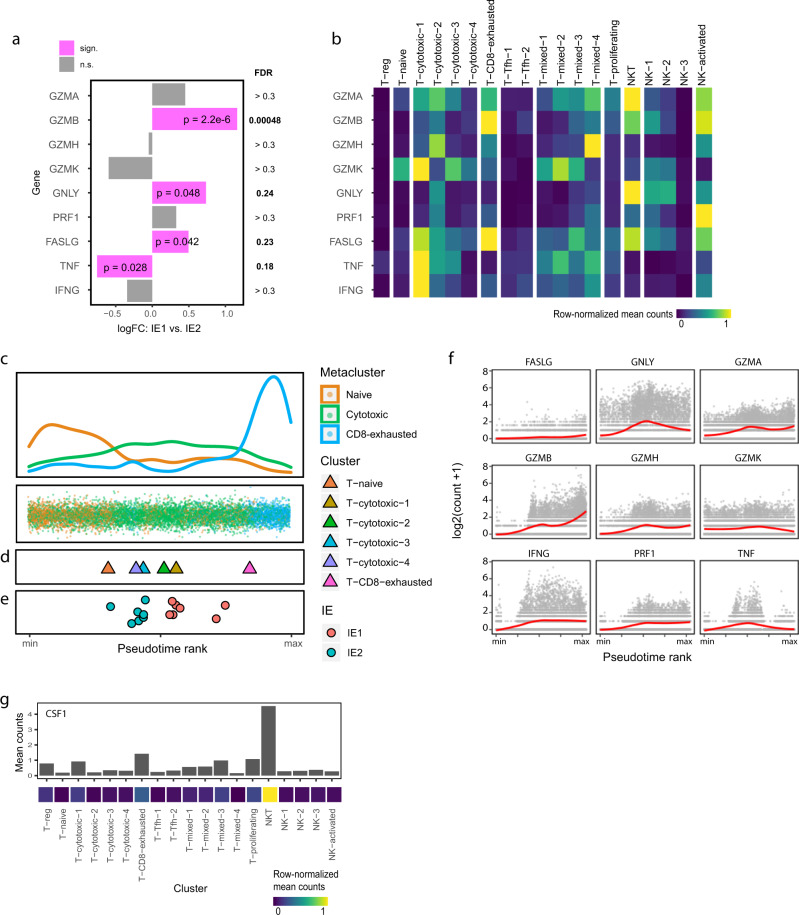
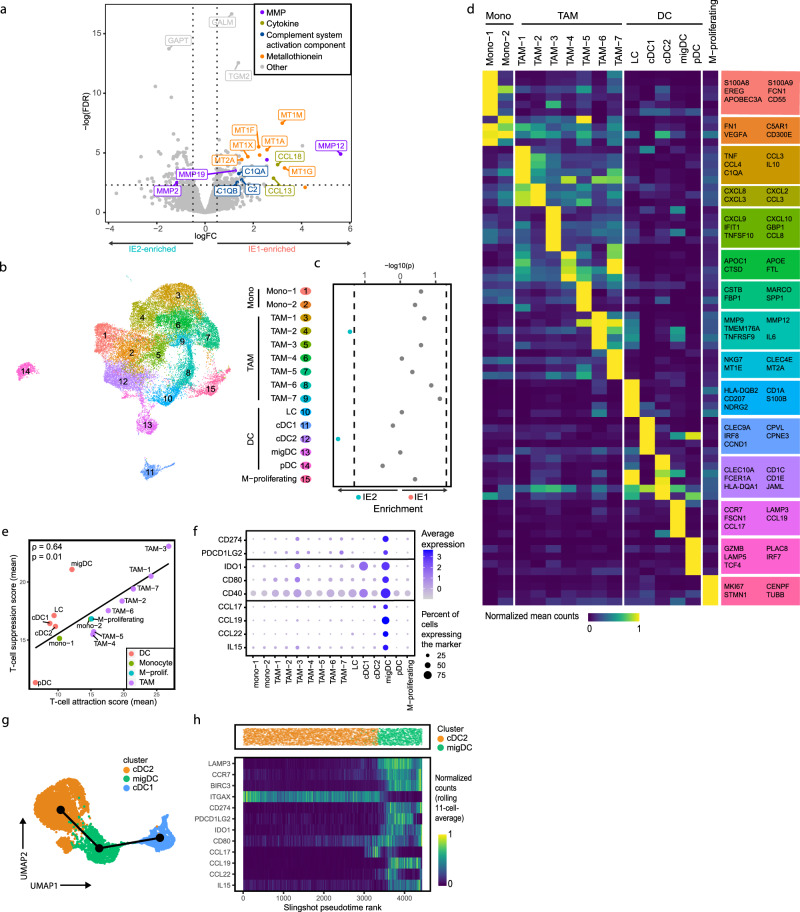
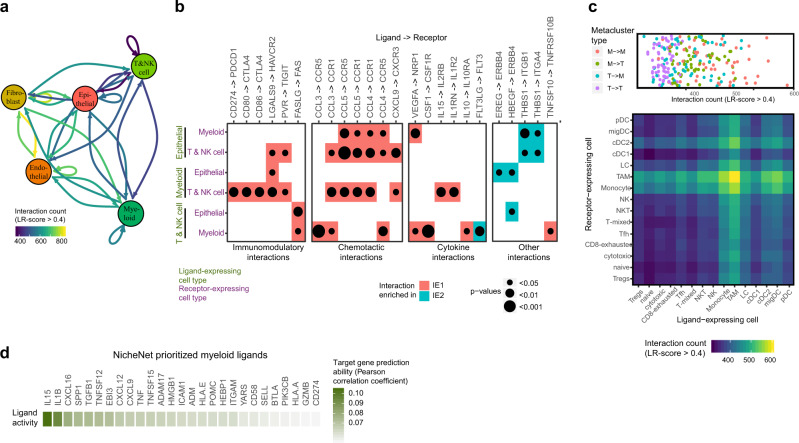
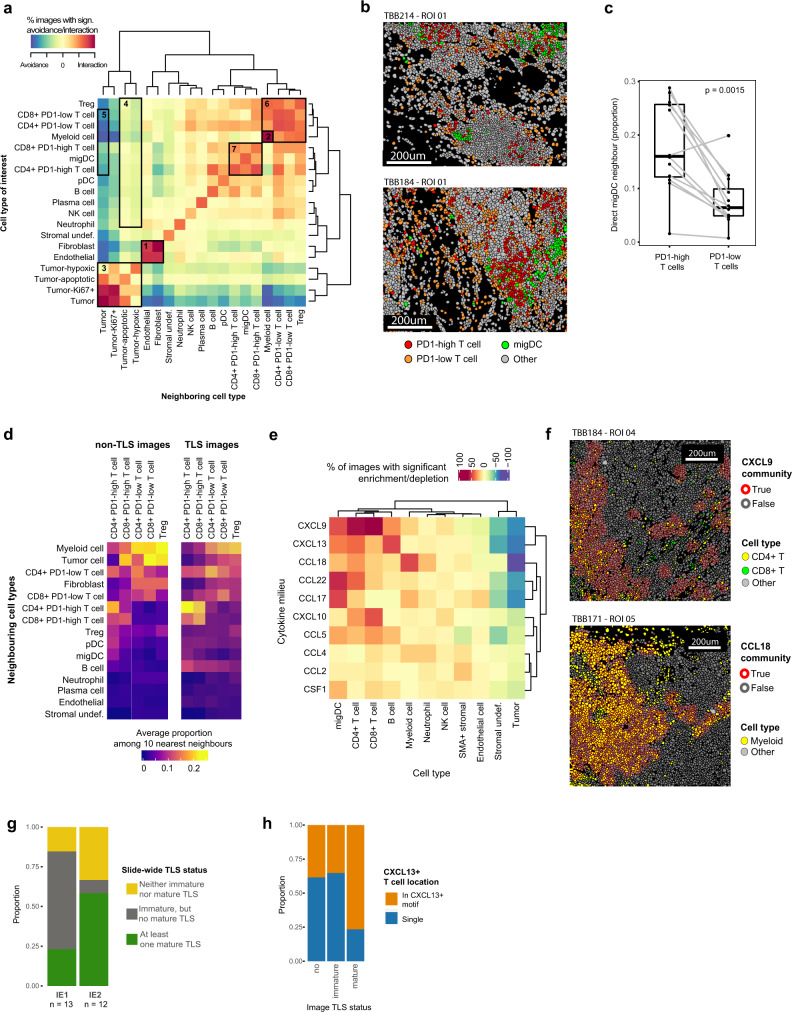
Immune checkpoint therapy in breast cancer remains restricted to triple negative patients, and long-term clinical benefit is rare. The primary aim of immune checkpoint blockade is to prevent or reverse exhausted T cell states, but T cell exhaustion in breast tumors is not well understood. Here, we use single-cell transcriptomics combined with imaging mass cytometry to systematically study immune environments of human breast tumors that either do or do not contain exhausted T cells, with a focus on luminal subtypes. We find that the presence of a PD-1high exhaustion-like T cell phenotype is associated with an inflammatory immune environment with a characteristic cytotoxic profile, increased myeloid cell activation, evidence for elevated immunomodulatory, chemotactic, and cytokine signaling, and accumulation of natural killer T cells. Tumors harboring exhausted-like T cells show increased expression of MHC-I on tumor cells and of CXCL13 on T cells, as well as altered spatial organization with more immature rather than mature tertiary lymphoid structures. Our data reveal fundamental differences between immune environments with and without exhausted T cells within luminal breast cancer, and show that expression of PD-1 and CXCL13 on T cells, and MHC-I - but not PD-L1 - on tumor cells are strong distinguishing features between these environments.


Conflict of interest statement

B.B. is a co-founder of Navignostics, a precision oncology diagnostics company based on multiplexed tumor imaging. All other authors declare no competing interests.

Figures

Fig. 1
Fig. 1. Transcriptomic and spatial proteomic analysis of breast tumor immune environments.
a Sample selection and experimental approach. b UMAP plot of scRNA-seq data from all 120,000 cells colored by patient. c UMAP plot of scRNA-seq data colored by immune environment (IE). d UMAP plot of scRNA-seq data colored by cell type. e DotPlot showing transcript expression of main cell type markers in the indicated cell subsets. f Proportion (% of total cells) of main cell types in IE1 and IE2 tumors. Cell types were annotated based on marker expression in scRNA-Seq data. Two-sided Wilcoxon rank sum test was used for statistical analysis. Boxplot centers indicate the group median, boxplot bodies show interquartile ranges (IQR), and whiskers extend to the largest and the smallest value within 1.5 times the IQR above the 75th percentile and below the 25th percentile, respectively. n = 12 independent patient samples. g Exemplary IMC image showing staining patterns for the indicated markers. h Single-cell masks for the IMC image displayed in g colored by cell type. IMC staining patterns and single-cell masks were compared for all 77 images with similar results.
Fig. 2
Fig. 2. The T cell phenotypic landscape of exhausted and non-exhausted immune environments.
a Volcano plot showing differential expression between T and NK cells of IE1 versus IE2 samples in pseudobulk patient-averaged scRNA-seq data. Dashed lines indicate false discovery rate (FDR) of 0.1 and log2 fold change (logFC) of 0.5. Boxplots comparing T and NK pseudobulk expression in counts per million (cpm) for selected transcription factors (b) and cytokines/receptors (c) between IE1 and IE2 samples. d UMAP plot of scRNA-seq data from 36,000 T and NK cells colored by Seurat cluster, annotated with the indicated cell type labels. e Enrichment of cluster frequencies, annotated by cell type, in IE1 or IE2 samples. Dashed lines indicate p = 0.05 (two-sided Wilcoxon rank sum test). f Heatmap showing normalized average expression of selected marker genes for all T and NK cell clusters. g Single-cell count heatmap of selected genes associated with tumor-reactivity and/or exhaustion. 100 cells were randomly sampled from the naïve T cell cluster and from each CD8+ T cell cluster; columns represent single cells. h Heatmap displaying the fold change in mean expression of the indicated genes in proliferating versus non-proliferating T and NK cells. i Boxplot comparing image-averaged single-cell HLA-ABC expression in IMC data for the epithelial subsets of IE1 versus IE2 samples. Each dot represents one image. A mixed effects model was fitted on the log1p-transformed data. j Boxplot comparing mean CXCL13 protein counts between CXCL13-expressing and non-expressing T cells in IMC. k Boxplot comparing CXCL13high cell proportions out of all CD8+ T cells (left) and CD4+ T cells (right) between IE1 and IE2 samples in IMC. Only non-TLS images were included. For scatterplots, Spearman correlation coefficient (two-tailed test) and p value are indicated. For boxplots, two-sided Wilcoxon rank sum test was used for statistical analysis unless otherwise noted. Boxplot centers indicate group median, bodies show IQR, and whiskers extend to the largest and smallest value lying within 1.5 times the IQR above the 75th percentile and below the 25th percentile, respectively. For b, c, i and k: n = 14 independent patient samples.
Fig. 3
Fig. 3. Cytotoxic effector profiles differ between exhausted and non-exhausted immune environments.
a Bar plot showing differential expression of the indicated transcripts in T and NK cells between IE1 and IE2 tumors (patient-averaged pseudobulk data). p values are derived from EdgeR analysis and are not multiple testing corrected. FDR values indicate the genome-wide false discovery rate as given by EdgeR. b Heatmap showing normalized average single-cell expression of cytotoxic genes for all T and NK cell clusters. c Pseudotime ordering of CD8+ T cells in all samples based on scRNA-seq data. Single cells are colored according to metacluster (bottom) and the corresponding density plot is displayed (top). d Mean pseudotime scores for individual cell phenotype clusters. e Mean pseudotime scores for individual samples colored by immune environment. f Single-cell expression of the indicated cytotoxic genes along pseudotime. The analysis was done on scRNA-seq data from CD8+ T cells in all samples. Red line corresponds to locally estimated scatterplot smoothing (LOESS) curve. g Average single-cell CSF1 expression in all T and NK cell clusters displayed as a bar chart (top) and in a normalized heatmap (bottom).
Fig. 4
Fig. 4. Myeloid cell phenotypes in exhausted immune environments indicate inflammation and T cell-suppressive potential.
a Volcano plot showing differential gene expression between myeloid cells of IE1 and IE2 samples in pseudobulk patient-averaged scRNA-seq data. Dashed lines indicate an FDR of 0.1 and a logFC of 0.5. Genes are colored by functional group. b UMAP plot of scRNA-seq data from 26,000 myeloid cells colored by Seurat cluster and annotated by cell type. c Enrichment of cluster frequencies in IE1 and IE2 samples. Two-sided Wilcoxon rank sum test was used for statistical analysis and dashed lines indicate a p value of 0.05. d Heatmap showing normalized average single-cell expression of the top 10 differentially expressed genes for all myeloid cell clusters. Selected genes overexpressed in the respective cluster are indicated in the colored boxes. e Scatterplot of the mean T cell-suppression score versus the mean T cell-attraction score for all myeloid cell clusters. f DotPlot showing expression of main migDC markers across all myeloid cell clusters. g UMAP of cDC subsets and migDCs with Slingshot trajectories overlaid. h Slingshot pseudotime ordering of single cells from the cDC2 and migDC subsets (top) and heatmap showing normalized expression of selected genes along pseudotime using the rolling average expression over 11 cells (bottom). Genes with log counts per million <1.5 in EdgeR analysis were excluded for plots ad. For scatterplots, Spearman correlation coefficient (two-tailed test) and p value are indicated.
Fig. 5
Fig. 5. Ligand-receptor analysis predicts TIME-wide and exhaustion-specific cellular crosstalk.
a Social graph depicting the number of interactions between the five most frequent cell types. b Enrichment of selected ligand-receptor interactions in either IE1 or IE2 tumors for the given cell type pairs. Selections were made based on literature evidence and biological interpretability. The full list of enriched interaction pairs is in Supplementary Data 6. White squares denote interactions with an enrichment p value >0.05 or a mean LR score <0.4 in the given cell type pair. Two-sided Wilcoxon rank sum test was used for statistical analysis. c DotPlot (top) and heatmap (bottom) depicting the number of interactions between different myeloid and T and NK cell metaclusters. M indicates myeloid metacluster; T indicates T and NK cell metacluster. d Heatmap showing the myeloid-derived ligands with the highest ability to affect exhaustion-related target gene expression as predicted by NicheNet.
Fig. 6
Fig. 6. IMC reveals cellular neighborhoods, cytokine milieus and tertiary lymphoid structures.
a Heat map indicating significant pairwise cell type interaction/avoidance in individual images from the Protein Panel dataset (n = 77 images, 1000 permutations each). Significance is indicated by square color (p < 0.01, two-sided permutation tests), corrected for relative cell type frequency. Highlighted interactions indicate (1) fibroblast-endothelial interactions, (2) myeloid auto-interactions, (3) tumor compartment, (4) hypoxic/apoptotic tumor cell to immune cell interactions, (5) tumor to T cell subtype interactions, (6) main immune compartment, and (7) migDC-PD-1high T cell interaction. b Single-cell masks for selected IMC images (top: mature TLS image, bottom: immature TLS image). Only a subsection of each image is shown. c Paired boxplot comparing the percentage of PD-1high T cells versus PD-1low T cells that have at least one migDC as a direct neighbor. Each pair of dots represents a separate sample (n = 14 independent patient samples; two-sided paired Wilcoxon rank sum test). Boxplot centers indicate group median, bodies show IQR, and whiskers extend to the largest and the smallest value lying within 1.5 times the IQR above the 75th percentile and below the 25th percentile, respectively. d Heatmap displaying the average relative proportion of each indicated cell type among the 10 nearest neighbors for each T cell subtype across non-TLS images (left) and TLS-images (mature and immature, right). e Heatmap indicating significant relative enrichment or depletion of each cell type in the different cytokine milieus in all images of the RNA Panel dataset (Fisher’s exact test; n = 77 images; for each individual combination, only images containing the respective community and cell type were included). f Single-cell masks for selected representative IMC images with cell outline colored by the indicated cytokine community and cell body colored by cell type. The selected images are representative of cellular patterns seen across the dataset (n total = 77 images). g Stacked barplots indicating the slide-wide TLS status for 13 IE1 samples and 12 IE2 samples. h Stacked barplots showing the proportions of CXCL13+ T cells that are part of a CXCL13-cytokine-cluster for images with the indicated TLS status.

References

    1. Sosman JA, et al. Improved survival with ipilimumab in patients with metastatic melanoma. N. Engl. J. Med. 2010;363:711–723. - PMC - PubMed
    1. Robert C, et al. Durable complete response after discontinuation of pembrolizumab in patients with metastatic melanoma. J. Clin. Oncol. 2018;36:1668–1674. - PubMed
    1. Berghmans, T., Dingemans, A., Hendriks, L. E. L. & Cadranel, J. Immunotherapy for nonsmall cell lung cancer: a new therapeutic algorithm. Eur. Respir. J. 55, 1901907 (2020). - PubMed
    1. Wang J, et al. Role of immune checkpoint inhibitor-based therapies for metastatic renal cell carcinoma in the first-line setting: a Bayesian network analysis. EBioMedicine. 2019;47:78–88. - PMC - PubMed
    1. Vonderheide RH, Domchek SM, Clark AS. Immunotherapy for breast cancer: what are we missing? Clin. Cancer Res. 2017;23:2640–2646. - PMC - PubMed

Publication types

Substances